| Param | Original file | Final file |
|---|---|---|
| Filename | modeM0/AS1A05_056T01_9000002540_17118cztM0_level2.evt | modeM0/AS1A05_056T01_9000002540_17118cztM0_level2_quad_clean.evt |
| Size (bytes) | 559,362,240 | 103,464,000 |
| Size | 533.4 MB | 98.7 MB |
| Events in quadrant A | 3,913,788 | 657,571 |
| Events in quadrant B | 3,868,798 | 670,796 |
| Events in quadrant C | 4,264,903 | 624,619 |
| Events in quadrant D | 4,349,531 | 623,699 |
| Mode M0 | |||
|---|---|---|---|
| Quadrant | BADHDUFLAG | Total packets | Discarded packets |
| A | 0 | 16832 | 2 |
| B | 0 | 16560 | 2 |
| C | 0 | 18018 | 2 |
| D | 0 | 18120 | 2 |
| Mode M9 | |||
|---|---|---|---|
| Quadrant | BADHDUFLAG | Total packets | Discarded packets |
| A | 0 | 17 | 0 |
| B | 0 | 17 | 0 |
| C | 0 | 17 | 0 |
| D | 0 | 17 | 0 |
| Mode SS | |||
|---|---|---|---|
| Quadrant | BADHDUFLAG | Total packets | Discarded packets |
| A | 0 | 166 | 0 |
| B | 0 | 166 | 0 |
| C | 0 | 166 | 0 |
| D | 0 | 166 | 0 |
| Quadrant | Total seconds | Saturated seconds | Saturation percentage |
|---|---|---|---|
| A | 8001 | 73 | 0.912386% |
| B | 8001 | 89 | 1.112361% |
| C | 8001 | 112 | 1.399825% |
| D | 8001 | 140 | 1.749781% |
Noise dominated data is calculated using 1-second bins in cleaned event files. If a bin has >2000 counts, and if more than 50% of those come from <1% of pixels, then it is considered to be noise-dominated and hence unusable.
| Quadrant | # 1 sec bins | Bins with >0 counts | Bins with >2000 counts | High rate bins dominated by noise | Noise dominated (total time) | Noise dominated (detector-on time) | Marked lightcurve |
|---|---|---|---|---|---|---|---|
| A | 9781 | 8002 | 8 | 8 | 0.08% | 0.10% | 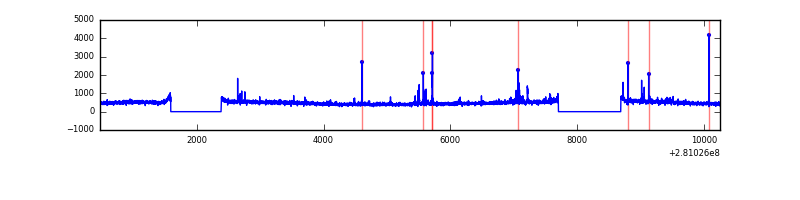 |
| B | 9781 | 8002 | 0 | 0 | 0.00% | 0.00% | 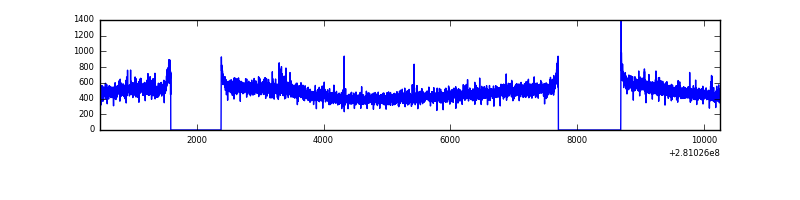 |
| C | 9781 | 8002 | 4 | 4 | 0.04% | 0.05% | 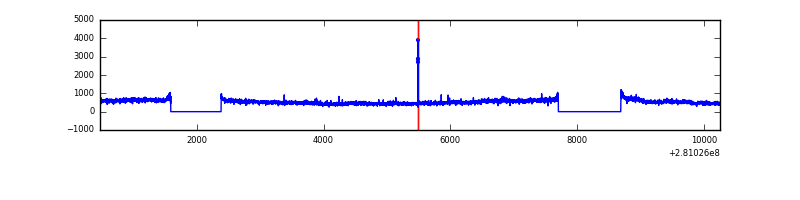 |
| D | 9781 | 8003 | 79 | 79 | 0.81% | 0.99% | 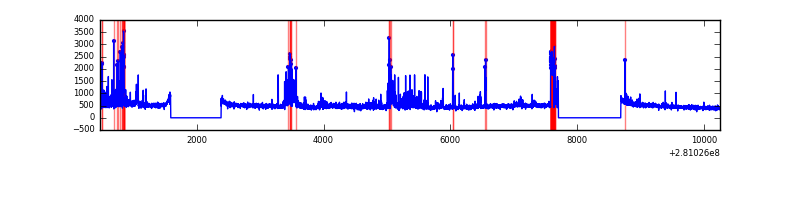 |
Top three noisy pixels from each quadrant. If the there are fewer than three noisy pixels in the level2.evt file, extra rows are filled as -1
| Pixel properties | Quadrant properties | ||||||
|---|---|---|---|---|---|---|---|
| Quadrant | DetID | PixID | Counts | Sigma | Mean | Median | Sigma |
| A | 4 | 2 | 136537 | 681.05 | 981 | 960 | 199.1 |
| A | 0 | 226 | 8450 | 37.62 | 981 | 960 | 199.1 |
| A | 3 | 137 | 7503 | 32.87 | 981 | 960 | 199.1 |
| B | 12 | 111 | 23587 | 119.68 | 981 | 953 | 189.1 |
| B | 0 | 230 | 22032 | 111.46 | 981 | 953 | 189.1 |
| B | 11 | 111 | 19921 | 100.3 | 981 | 953 | 189.1 |
| C | 3 | 233 | 464253 | 2114.86 | 932 | 938 | 219.1 |
| C | 14 | 238 | 140984 | 639.26 | 932 | 938 | 219.1 |
| C | 5 | 112 | 18265 | 79.09 | 932 | 938 | 219.1 |
| D | 5 | 222 | 712318 | 3114.86 | 940 | 912 | 228.4 |
| D | 1 | 52 | 65627 | 283.35 | 940 | 912 | 228.4 |
| D | 2 | 234 | 30884 | 131.23 | 940 | 912 | 228.4 |
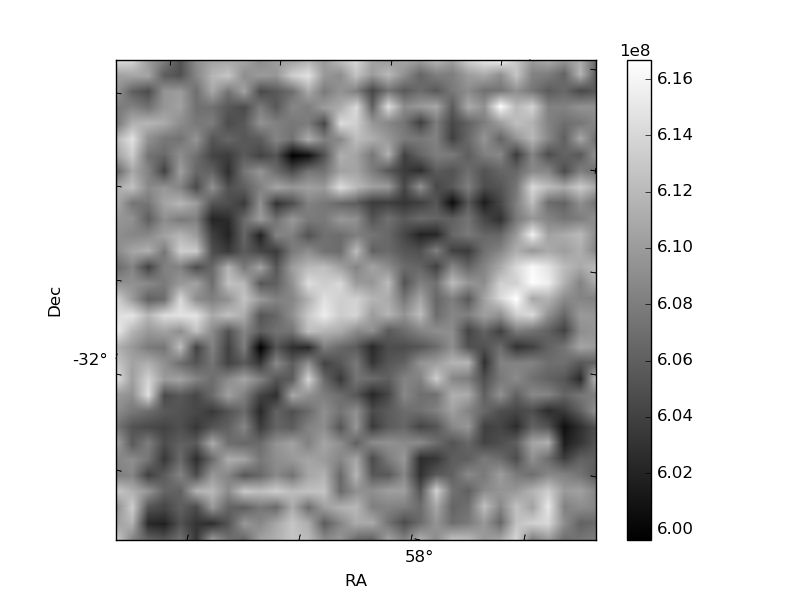
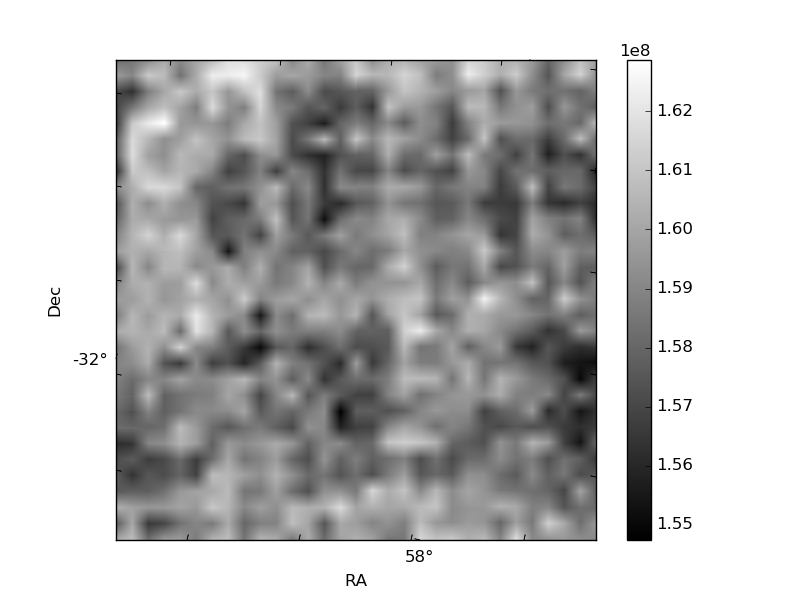
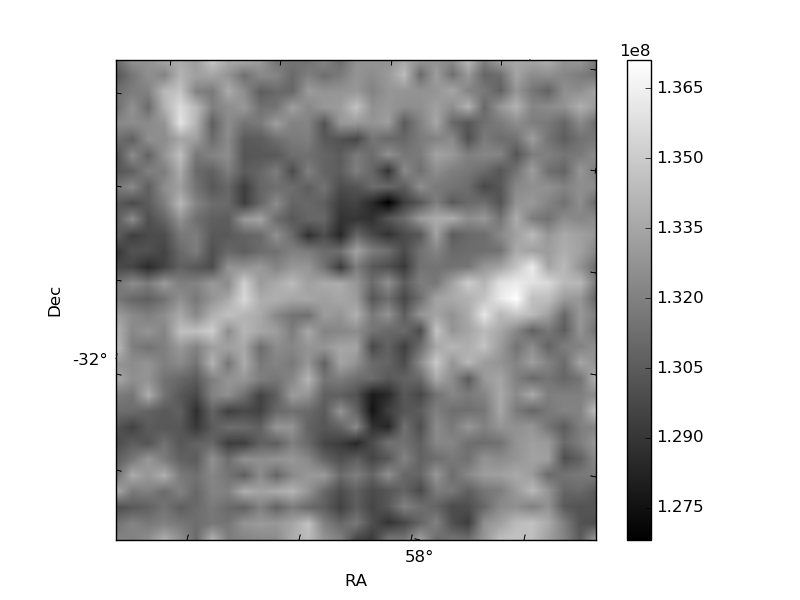
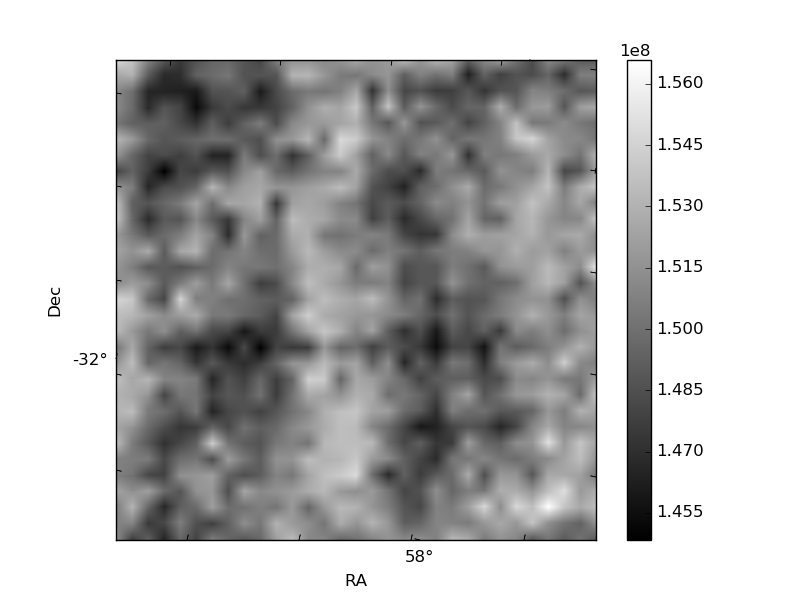
Histogram calculated using DETX and DETY for each event in the final _common_clean file
| Quadrant A | 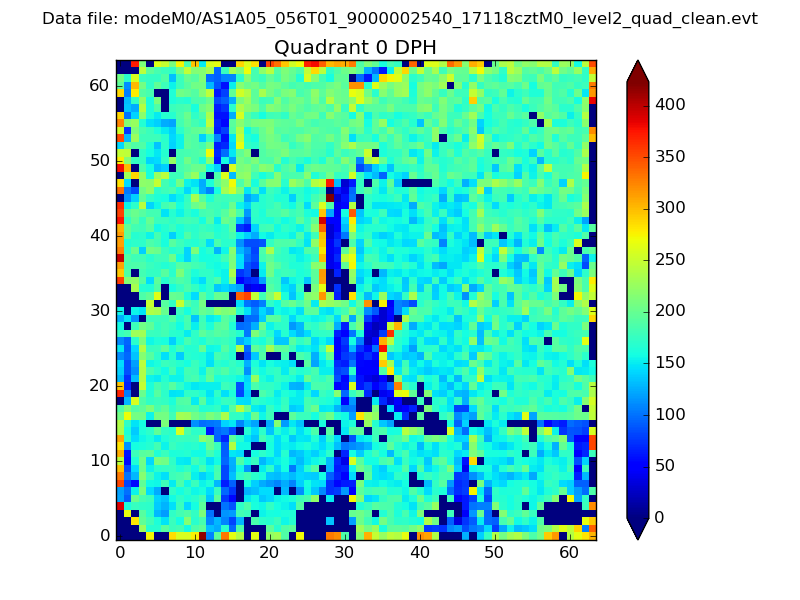 |
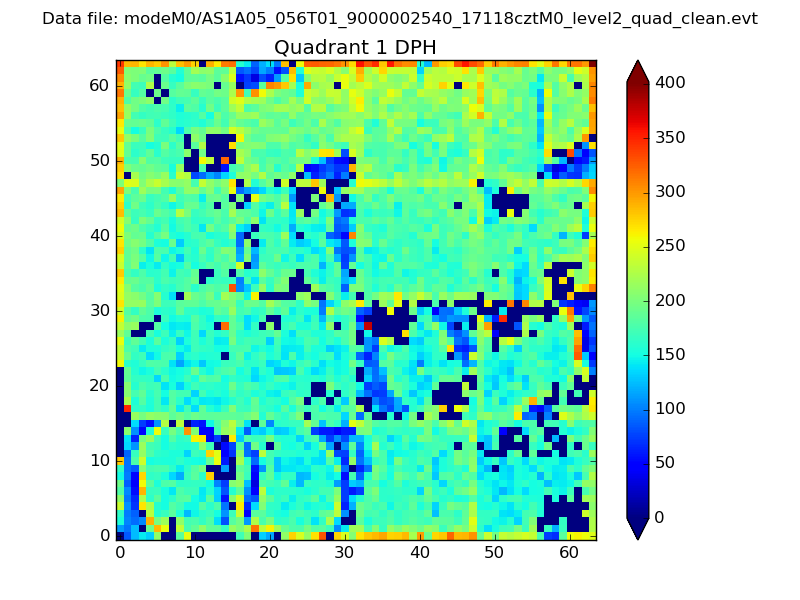 |
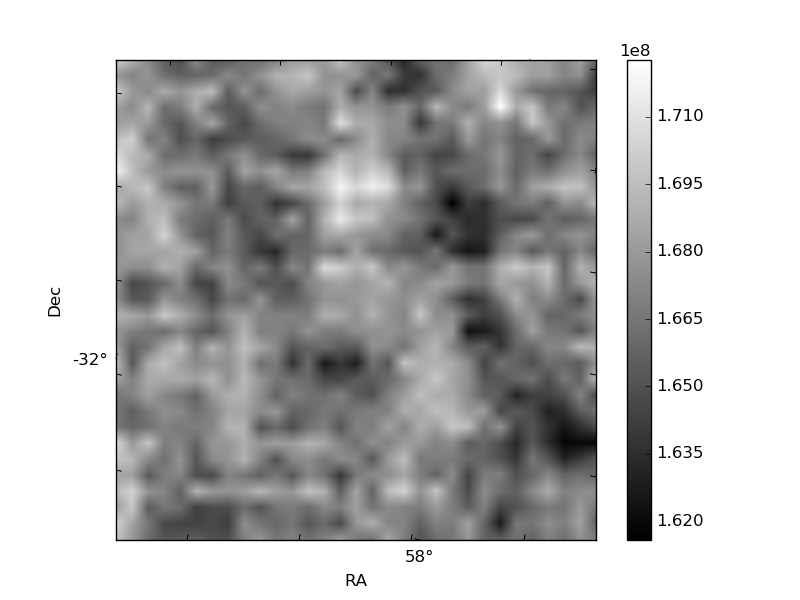
Quadrant B |
|---|---|---|---|
| Quadrant D | 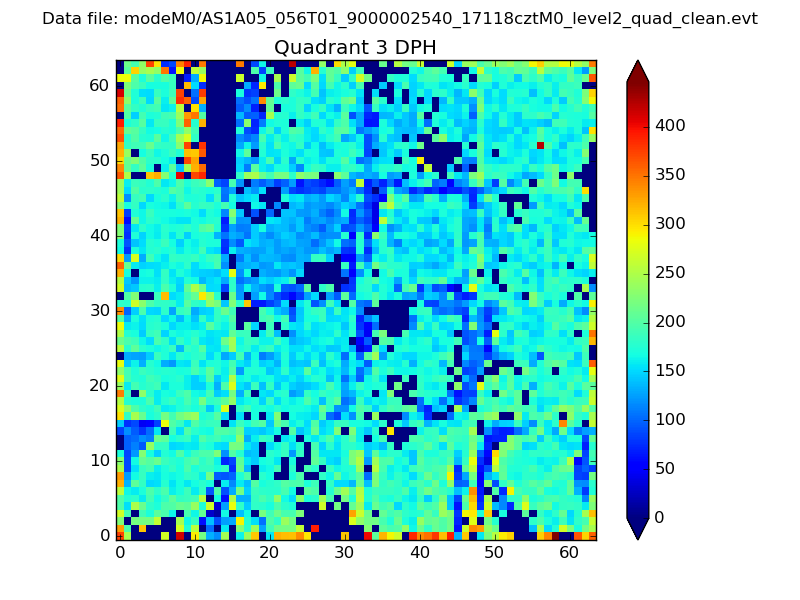 |
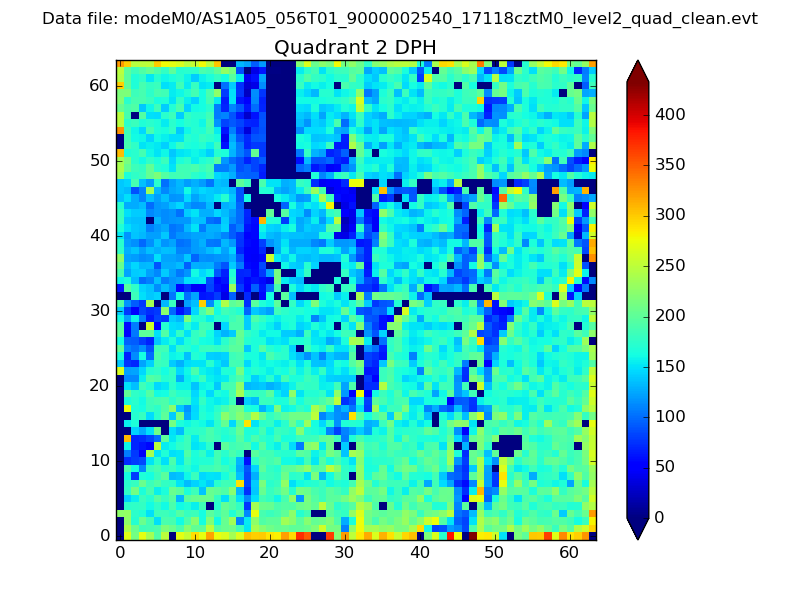 |
Quadrant C |
| Plot type | Count rate plots | Images |
|---|---|---|
| Comparison with Poisson distribution Blue bars denote a histogram of data divided into 1 sec bins. Red curve is a Poisson curve with rate = median count rate of data. |
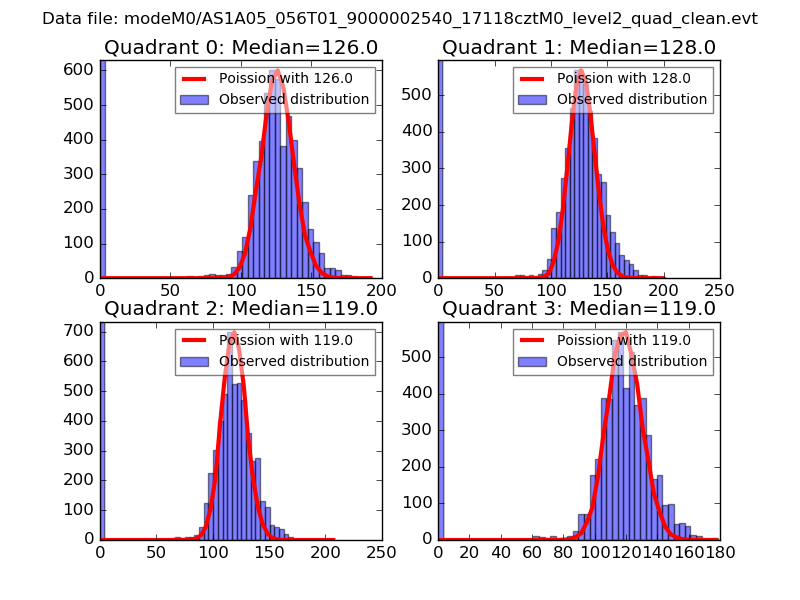 |
 |
| Quadrant-wise count rates Data is divided into 100 sec bins |
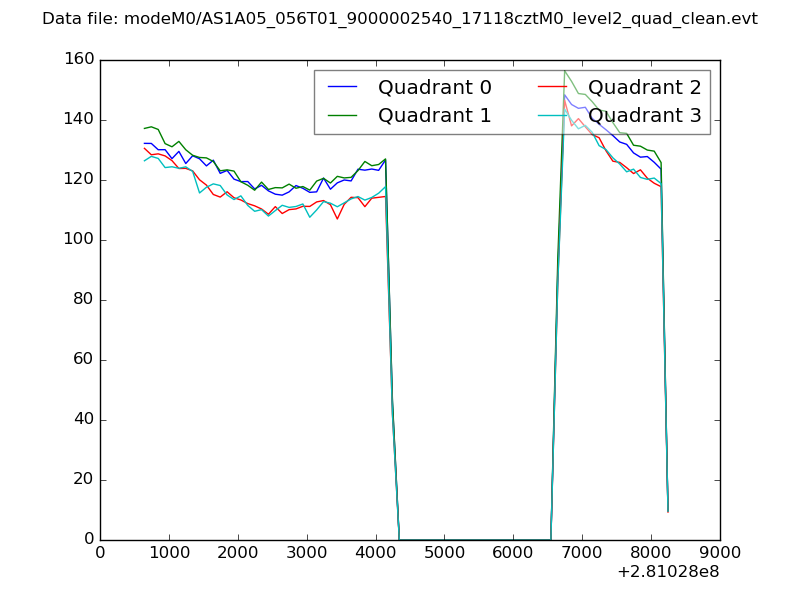 |
|
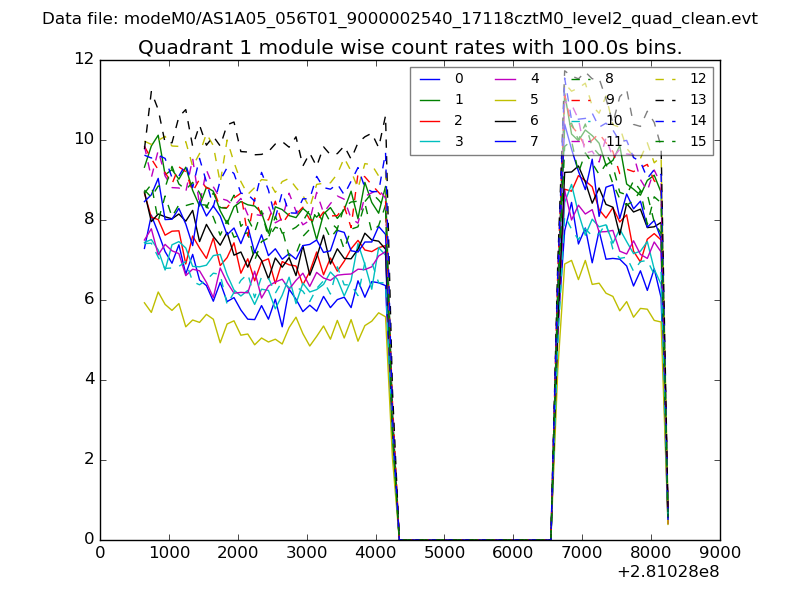
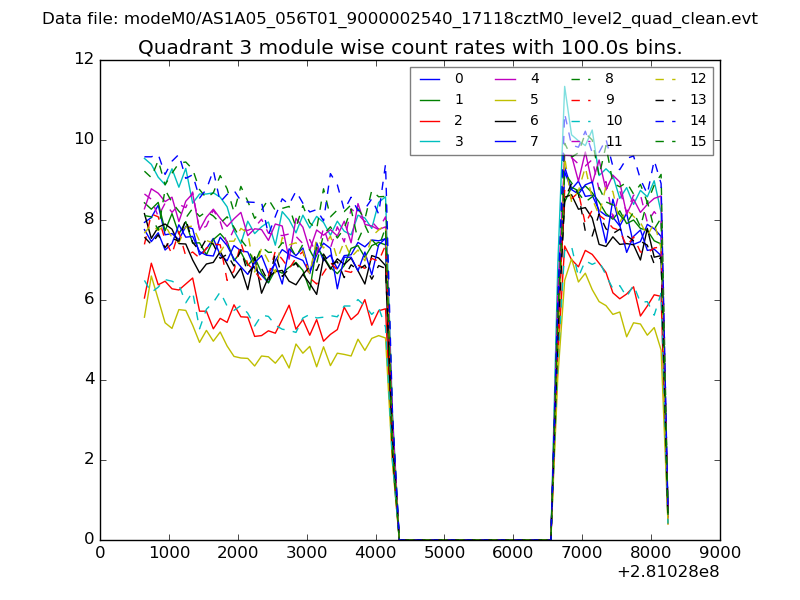
| Module-wise count rates for Quadrant A Data is divided into 100 sec bins |
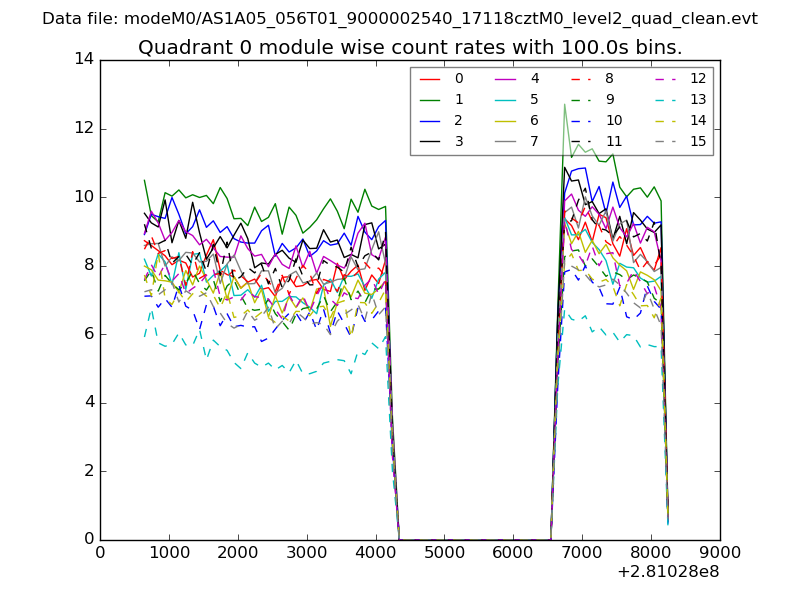 |
 |
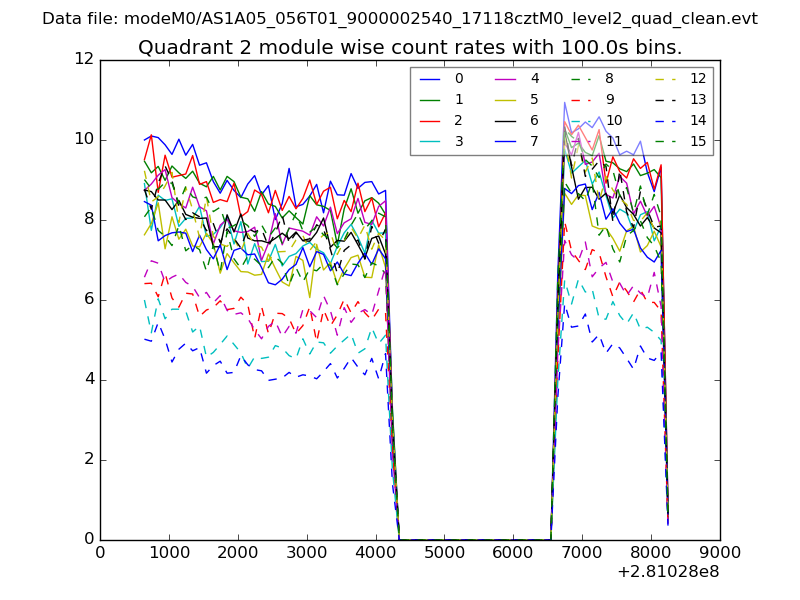
| Module-wise count rates for Quadrant B Data is divided into 100 sec bins |
 |
 |
| Module-wise count rates for Quadrant C Data is divided into 100 sec bins |
 |
 |
| Module-wise count rates for Quadrant D Data is divided into 100 sec bins |
 |
 |
| Parameter | Plot |
|---|---|
| CZT HV Monitor | 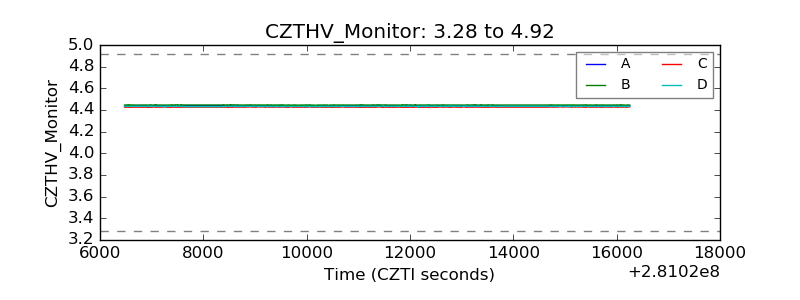 |
| D_VDD | 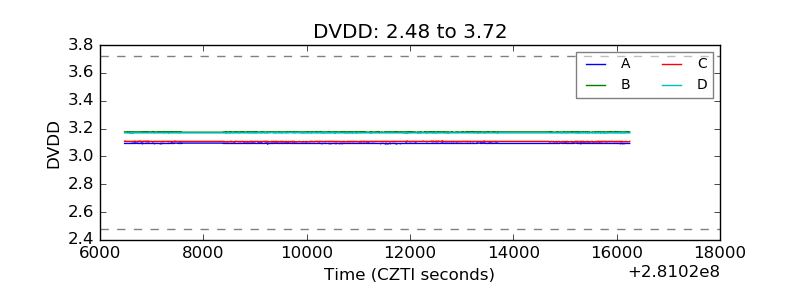 |
| Temperature 1 | 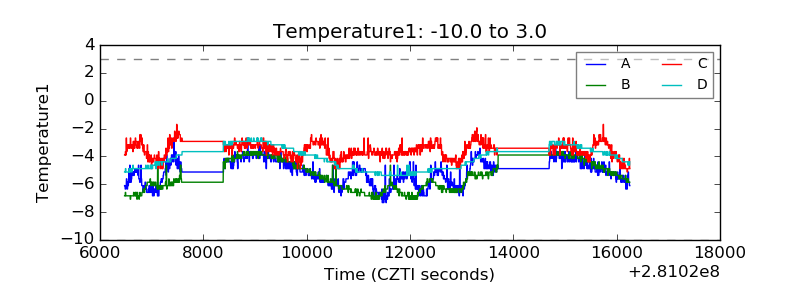 |
| Veto HV Monitor | 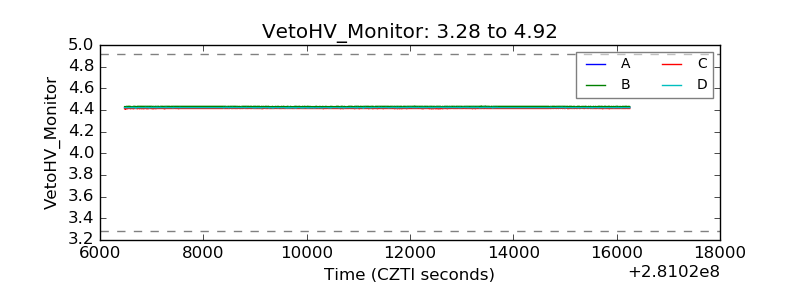 |
| Veto LLD | 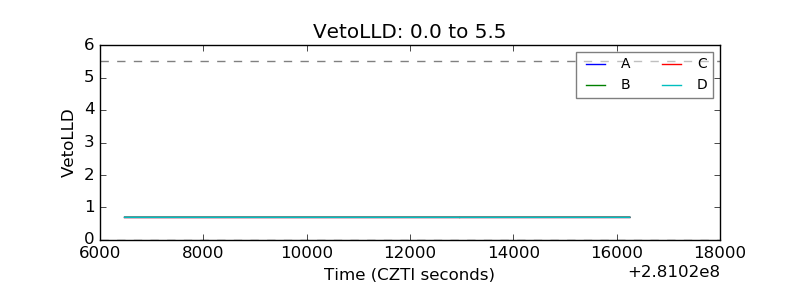 |
| Alpha Counter | 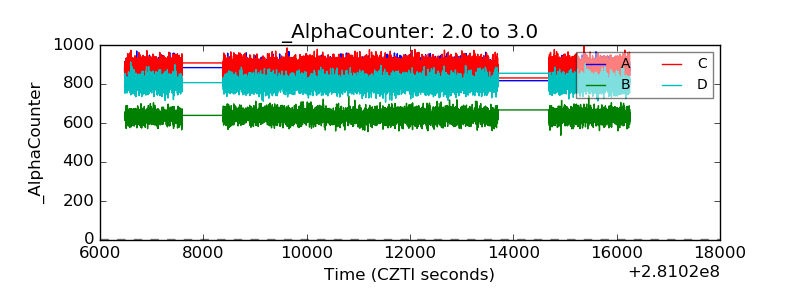 |
| _CPM_Rate | 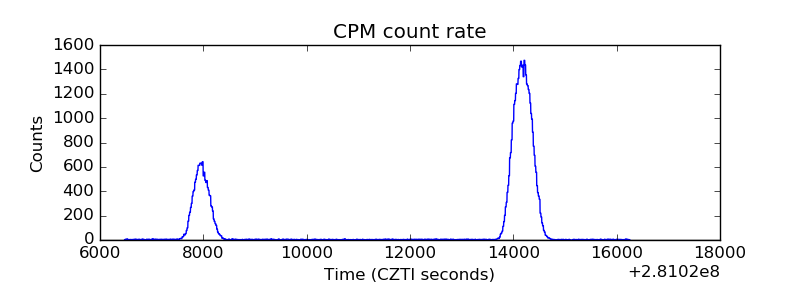 |
| CZT Counter | 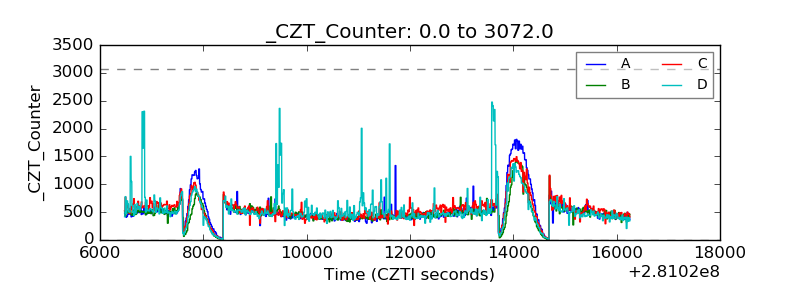 |
| +2.5 Volts monitor |  |
| +5 Volts monitor |  |
| _ROLL_ROT | 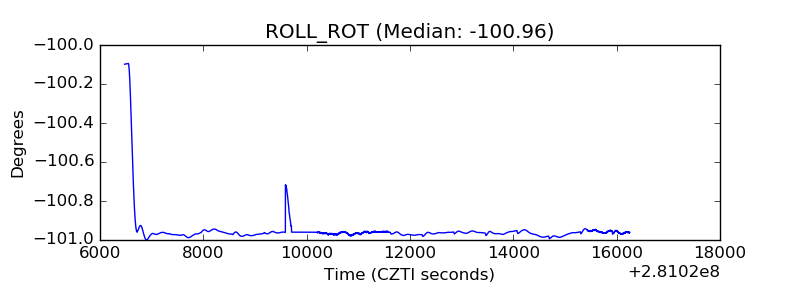 |
| _Roll_DEC | 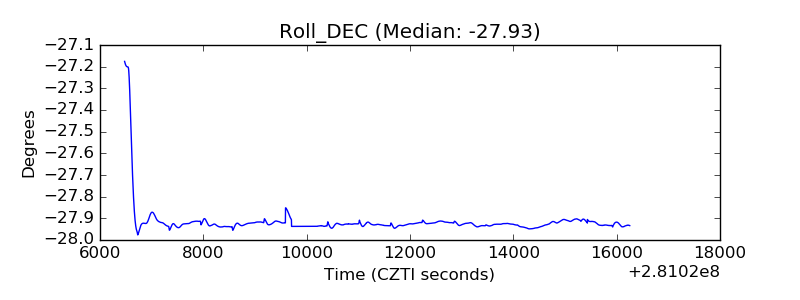 |
| _Roll_RA | 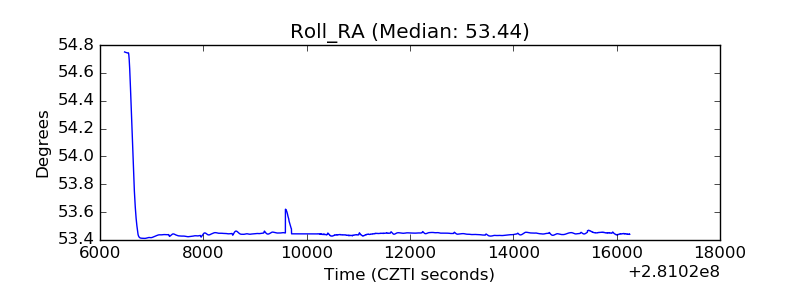 |
| Veto Counter |  |