| Param | Original file | Final file |
|---|---|---|
| Filename | modeM0/AS1A05_056T01_9000002540_17120cztM0_level2.evt | modeM0/AS1A05_056T01_9000002540_17120cztM0_level2_quad_clean.evt |
| Size (bytes) | 440,887,680 | 98,645,760 |
| Size | 420.5 MB | 94.1 MB |
| Events in quadrant A | 3,303,169 | 646,237 |
| Events in quadrant B | 3,259,472 | 661,292 |
| Events in quadrant C | 3,360,332 | 612,858 |
| Events in quadrant D | 2,982,643 | 608,931 |
| Mode M0 | |||
|---|---|---|---|
| Quadrant | BADHDUFLAG | Total packets | Discarded packets |
| A | 0 | 14120 | 2 |
| B | 0 | 13973 | 2 |
| C | 0 | 14170 | 3 |
| D | 0 | 13537 | 2 |
| Mode M9 | |||
|---|---|---|---|
| Quadrant | BADHDUFLAG | Total packets | Discarded packets |
| A | 0 | 11 | 0 |
| B | 0 | 11 | 0 |
| C | 0 | 11 | 0 |
| D | 0 | 11 | 0 |
| Mode SS | |||
|---|---|---|---|
| Quadrant | BADHDUFLAG | Total packets | Discarded packets |
| A | 0 | 134 | 0 |
| B | 0 | 134 | 0 |
| C | 0 | 134 | 0 |
| D | 0 | 134 | 0 |
| Quadrant | Total seconds | Saturated seconds | Saturation percentage |
|---|---|---|---|
| A | 6568 | 55 | 0.837393% |
| B | 6569 | 69 | 1.050388% |
| C | 6568 | 54 | 0.822168% |
| D | 6568 | 9 | 0.137028% |
Noise dominated data is calculated using 1-second bins in cleaned event files. If a bin has >2000 counts, and if more than 50% of those come from <1% of pixels, then it is considered to be noise-dominated and hence unusable.
| Quadrant | # 1 sec bins | Bins with >0 counts | Bins with >2000 counts | High rate bins dominated by noise | Noise dominated (total time) | Noise dominated (detector-on time) | Marked lightcurve |
|---|---|---|---|---|---|---|---|
| A | 7693 | 6569 | 21 | 21 | 0.27% | 0.32% | 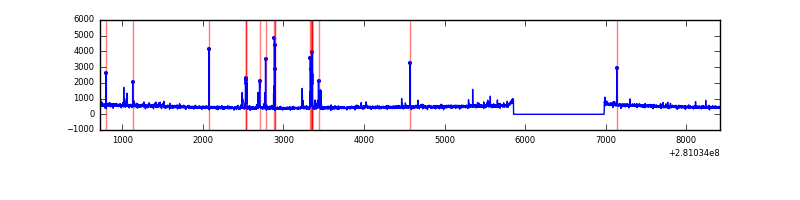 |
| B | 7694 | 6570 | 14 | 14 | 0.18% | 0.21% | 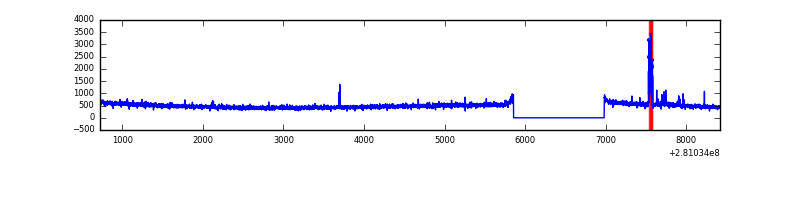 |
| C | 7693 | 6569 | 1 | 1 | 0.01% | 0.02% | 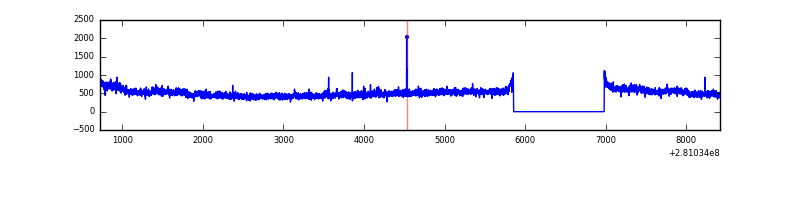 |
| D | 7693 | 6569 | 1 | 1 | 0.01% | 0.02% | 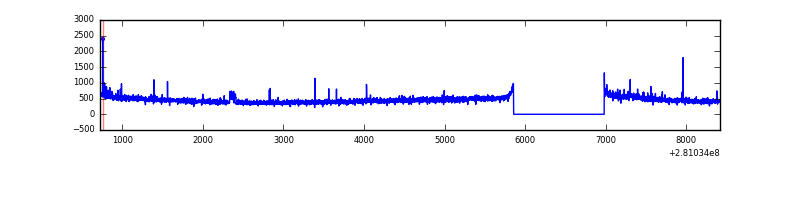 |
Top three noisy pixels from each quadrant. If the there are fewer than three noisy pixels in the level2.evt file, extra rows are filled as -1
| Pixel properties | Quadrant properties | ||||||
|---|---|---|---|---|---|---|---|
| Quadrant | DetID | PixID | Counts | Sigma | Mean | Median | Sigma |
| A | 4 | 2 | 208153 | 1259.95 | 804 | 788 | 164.6 |
| A | 0 | 226 | 7003 | 37.76 | 804 | 788 | 164.6 |
| A | 3 | 137 | 5946 | 31.34 | 804 | 788 | 164.6 |
| B | 0 | 229 | 95252 | 607.56 | 808 | 790 | 155.5 |
| B | 12 | 111 | 18749 | 115.51 | 808 | 790 | 155.5 |
| B | 11 | 111 | 16055 | 98.18 | 808 | 790 | 155.5 |
| C | 3 | 233 | 253864 | 1422.23 | 762 | 768 | 178.0 |
| C | 14 | 238 | 117881 | 658.1 | 762 | 768 | 178.0 |
| C | 9 | 160 | 8254 | 42.07 | 762 | 768 | 178.0 |
| D | 15 | 0 | 27199 | 141.35 | 770 | 751 | 187.1 |
| D | 2 | 234 | 24848 | 128.78 | 770 | 751 | 187.1 |
| D | 5 | 222 | 21384 | 110.27 | 770 | 751 | 187.1 |
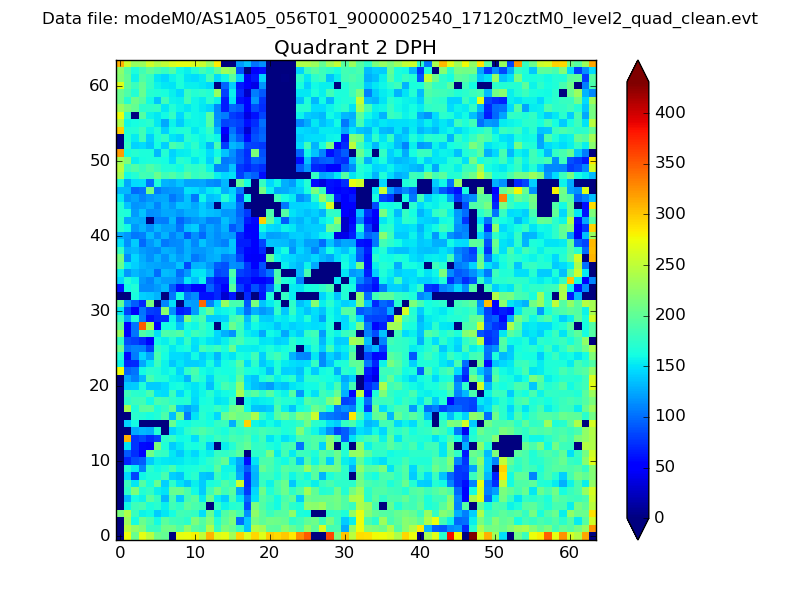
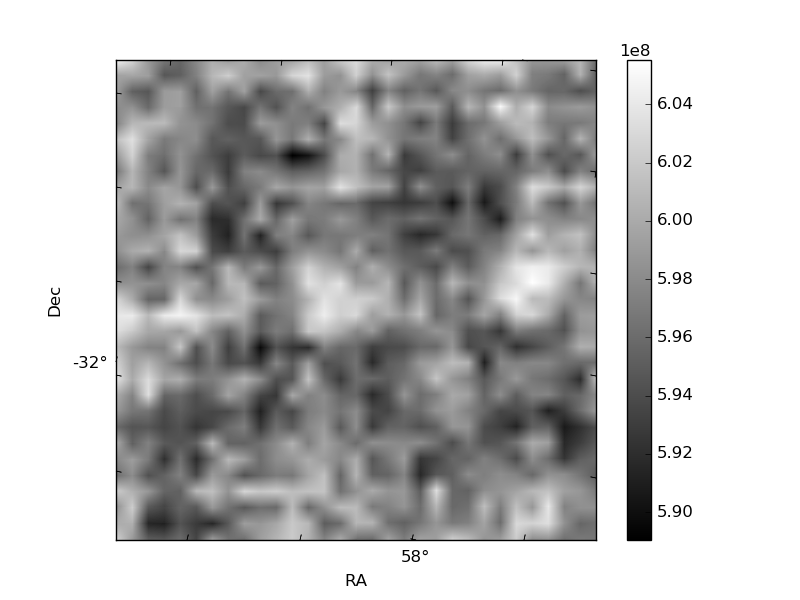
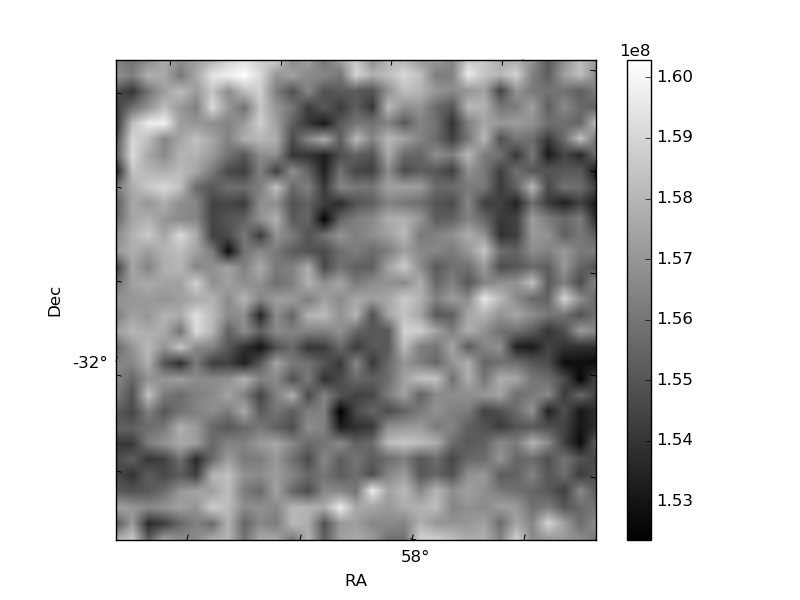
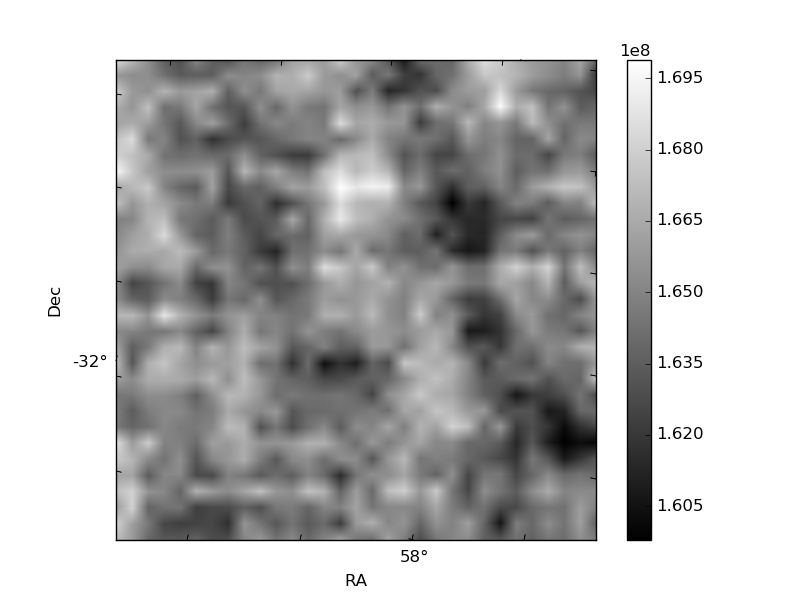
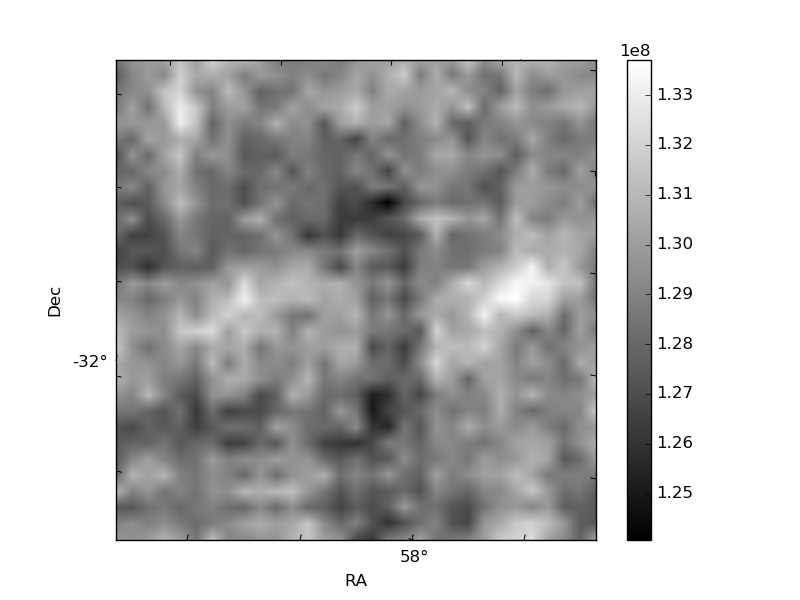
Histogram calculated using DETX and DETY for each event in the final _common_clean file
| Quadrant A | 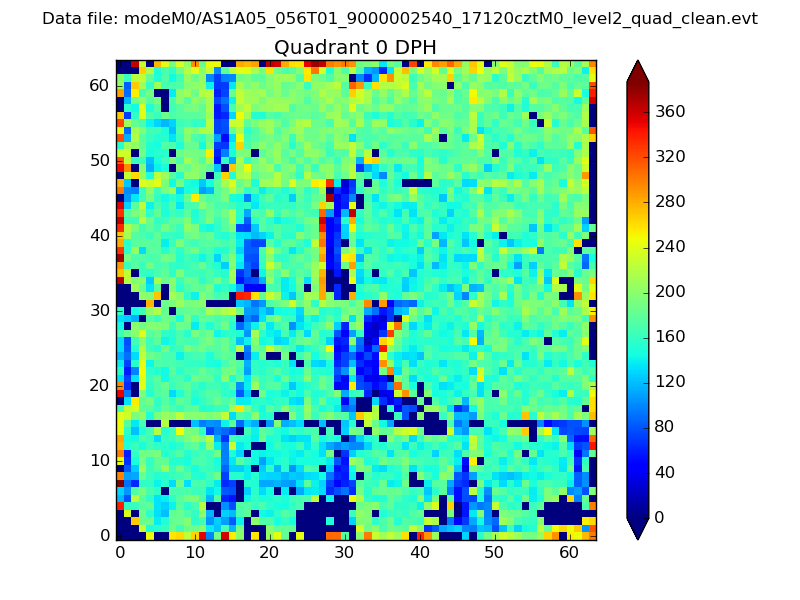 |
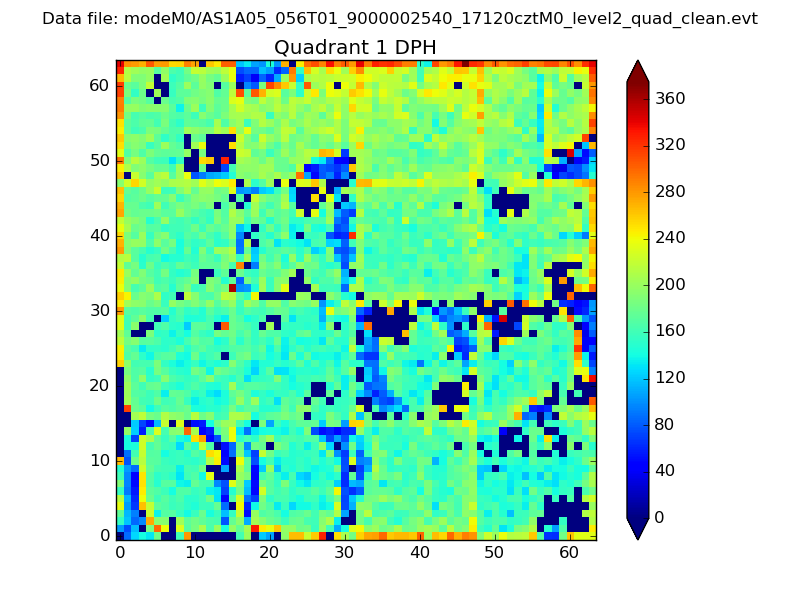 |
Quadrant B |
|---|---|---|---|
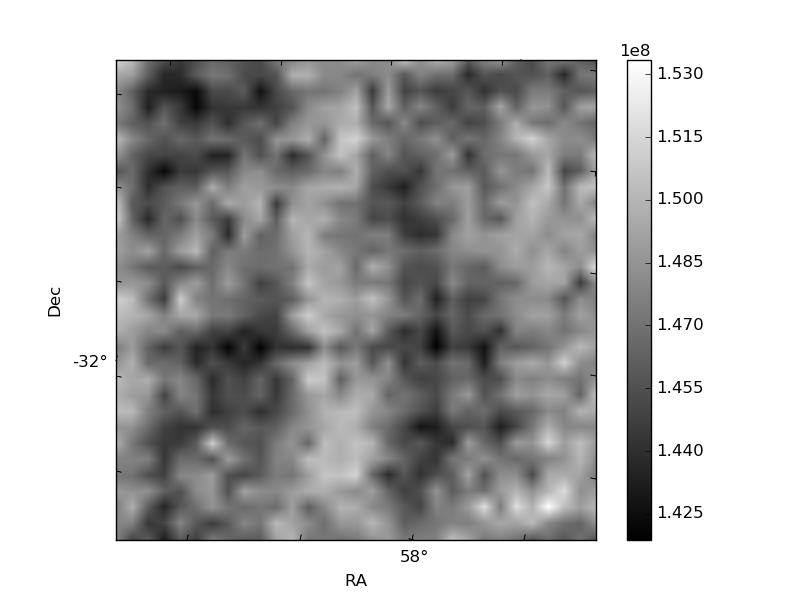
| Quadrant D | 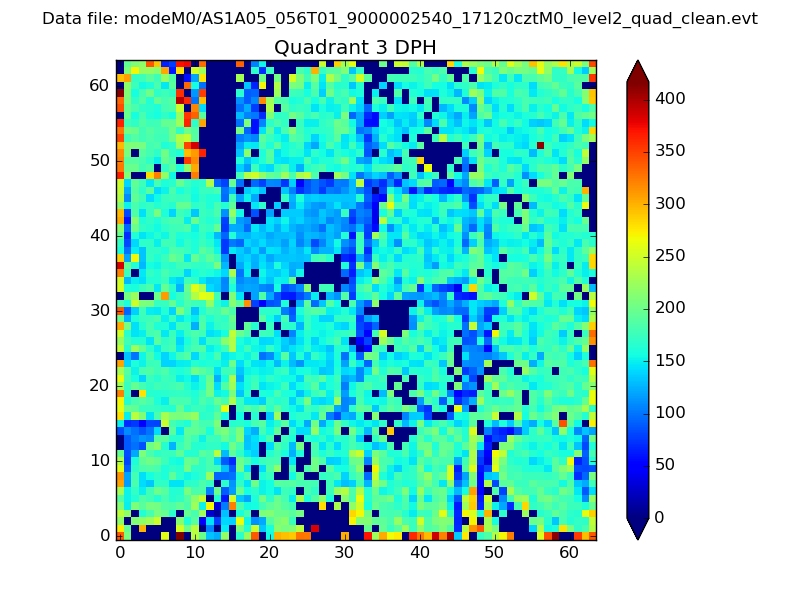 |
 |
Quadrant C |
| Plot type | Count rate plots | Images |
|---|---|---|
| Comparison with Poisson distribution Blue bars denote a histogram of data divided into 1 sec bins. Red curve is a Poisson curve with rate = median count rate of data. |
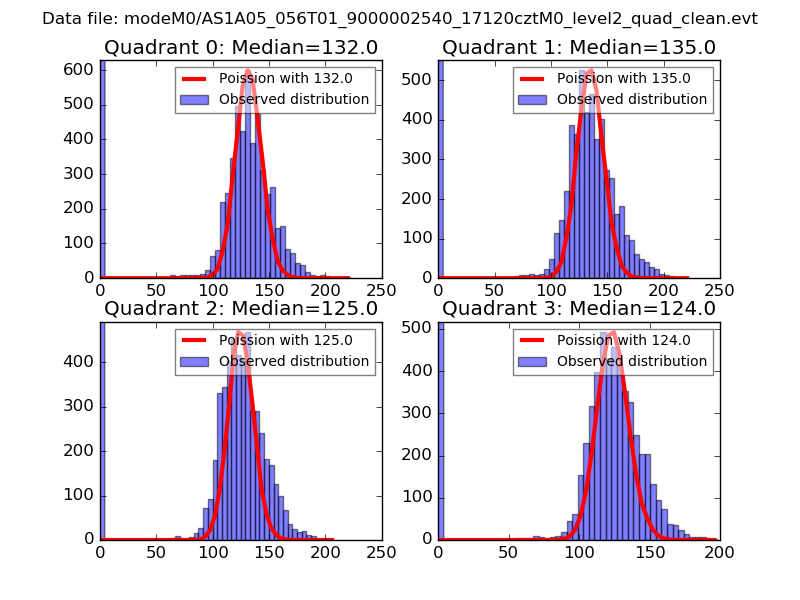 |
 |
| Quadrant-wise count rates Data is divided into 100 sec bins |
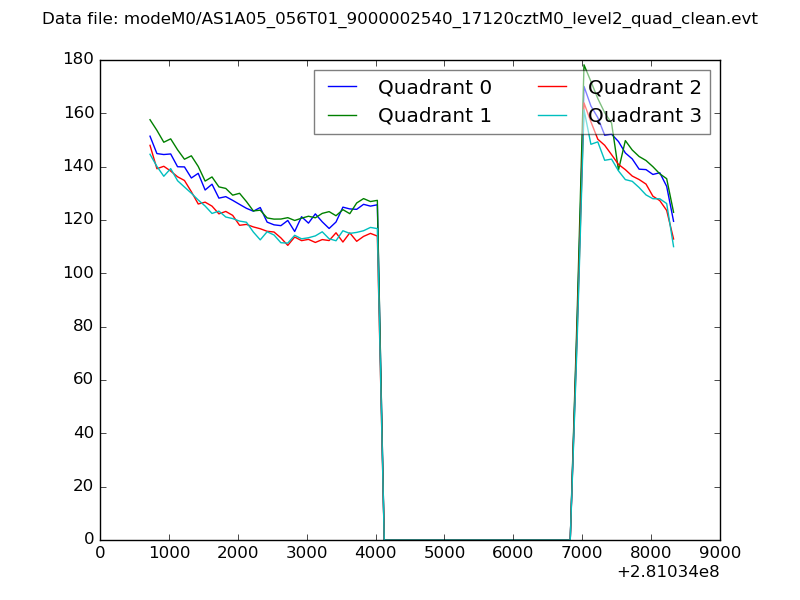 |
|
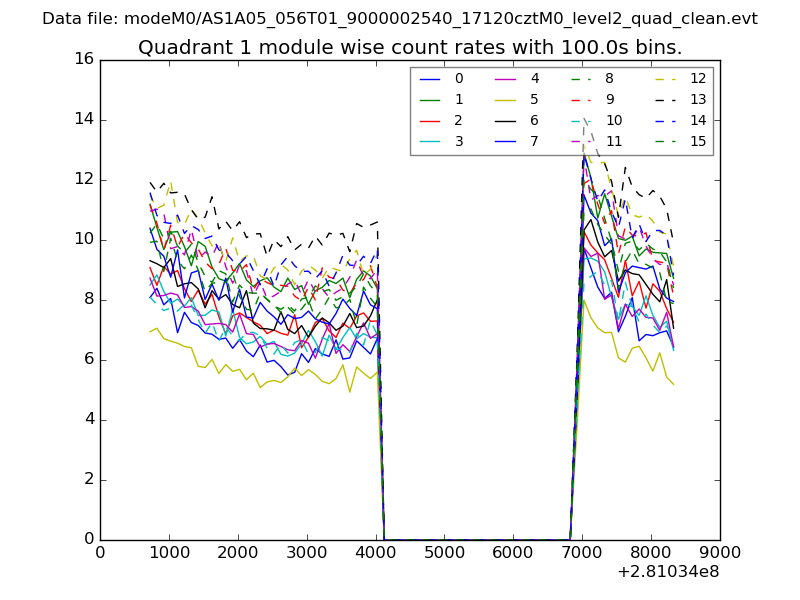
| Module-wise count rates for Quadrant A Data is divided into 100 sec bins |
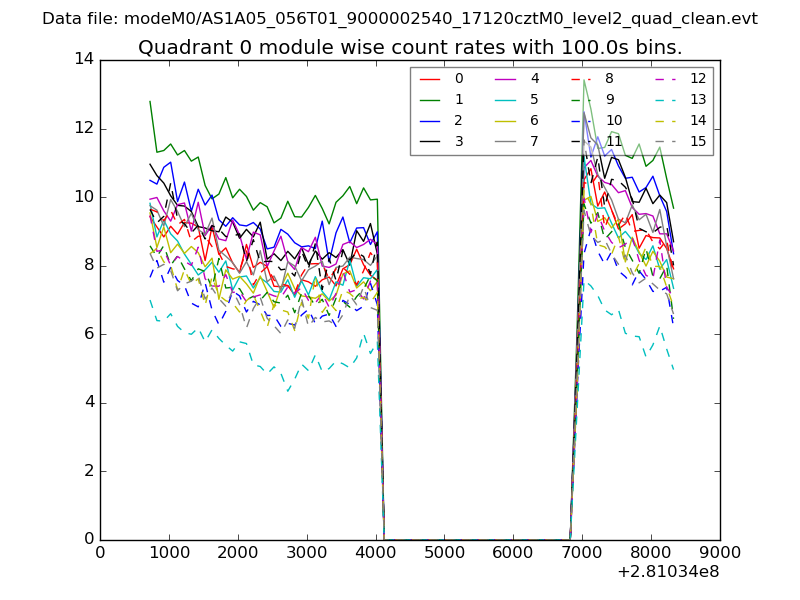 |
 |
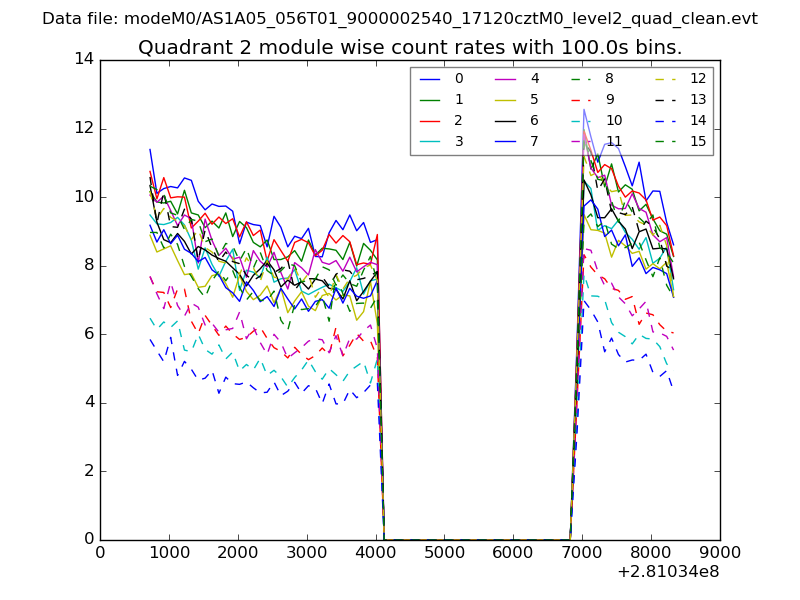
| Module-wise count rates for Quadrant B Data is divided into 100 sec bins |
 |
 |
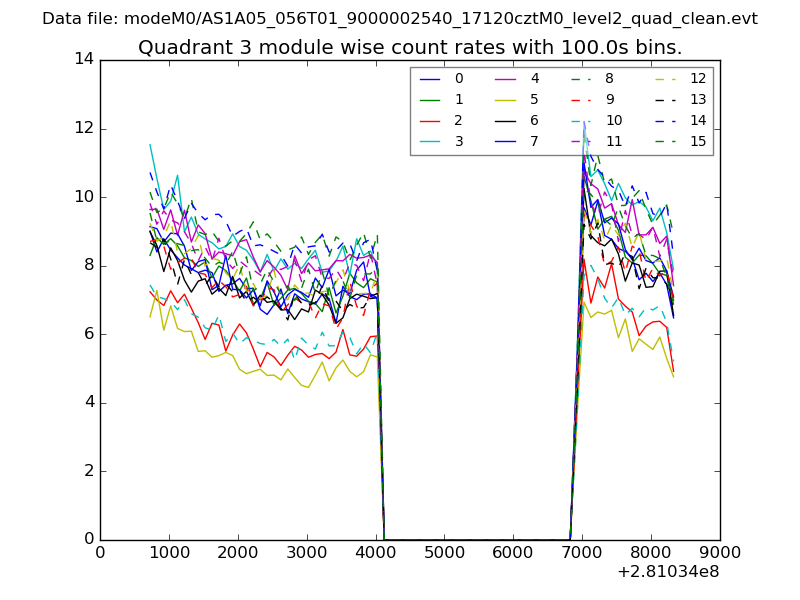
| Module-wise count rates for Quadrant C Data is divided into 100 sec bins |
 |
 |
| Module-wise count rates for Quadrant D Data is divided into 100 sec bins |
 |
 |
| Parameter | Plot |
|---|---|
| CZT HV Monitor | 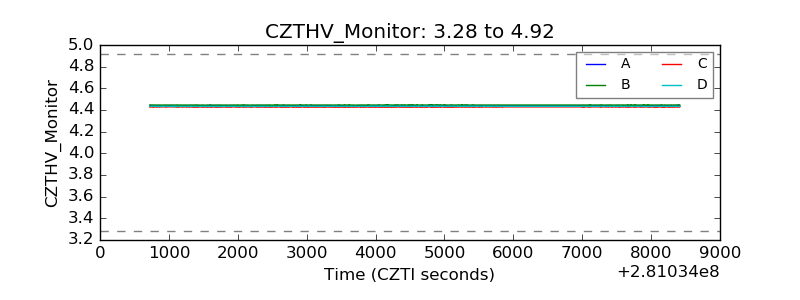 |
| D_VDD | 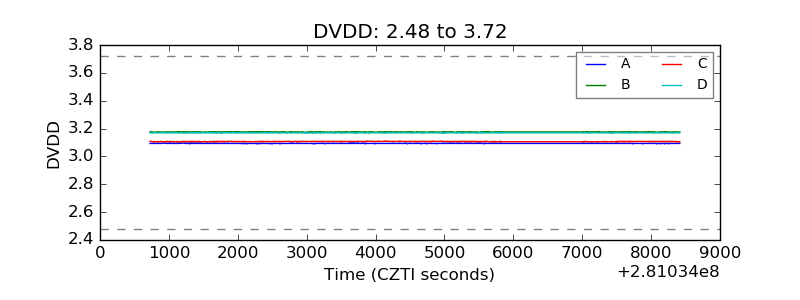 |
| Temperature 1 | 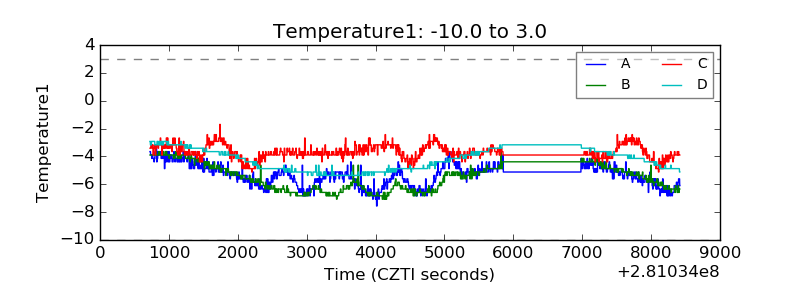 |
| Veto HV Monitor |  |
| Veto LLD | 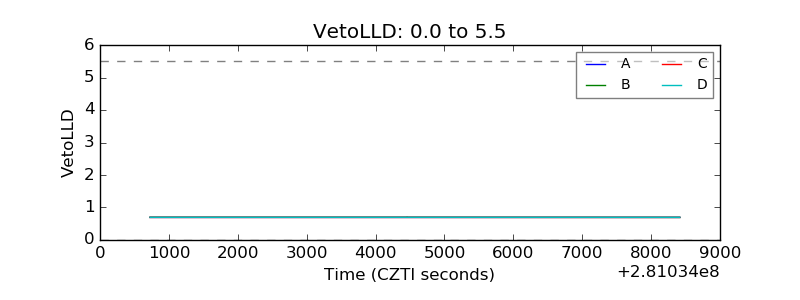 |
| Alpha Counter | 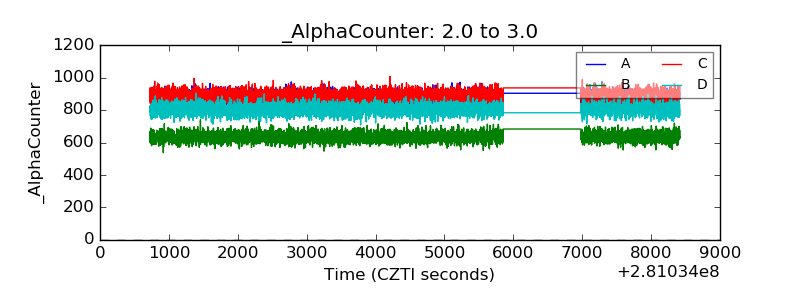 |
| _CPM_Rate | 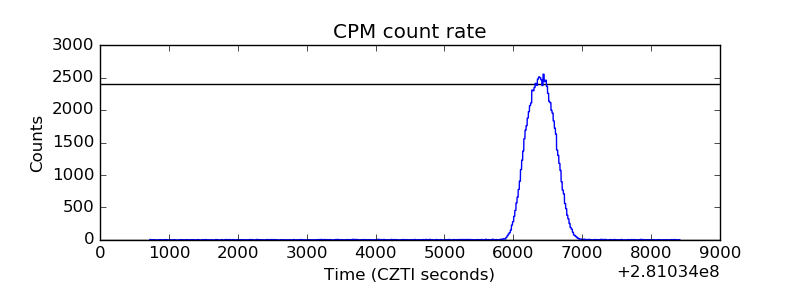 |
| CZT Counter | 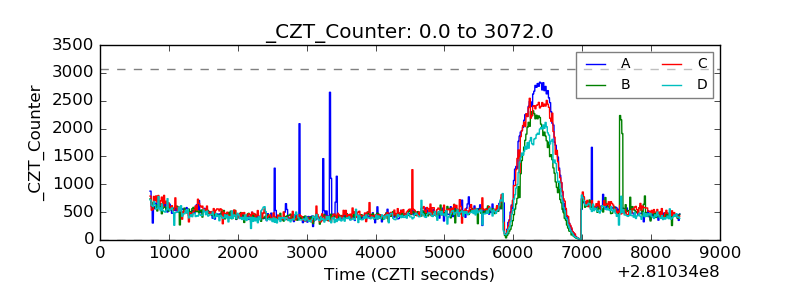 |
| +2.5 Volts monitor |  |
| +5 Volts monitor |  |
| _ROLL_ROT | 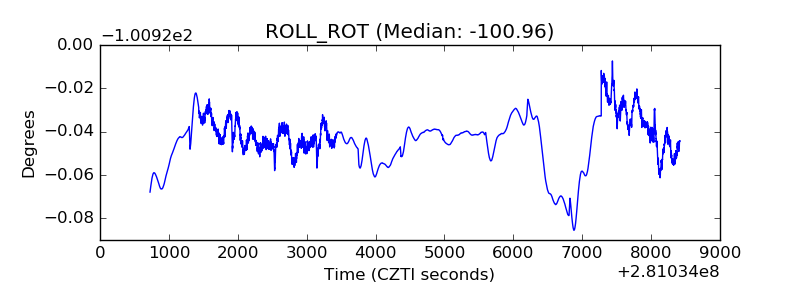 |
| _Roll_DEC | 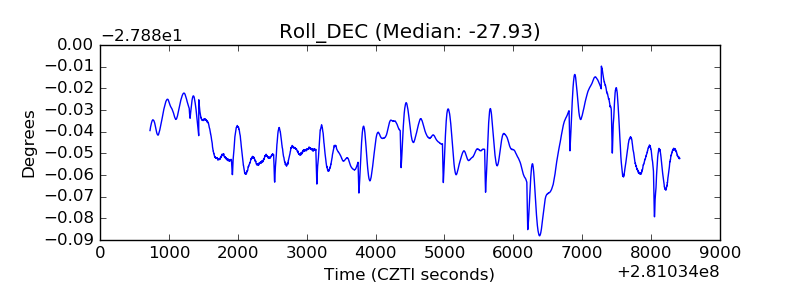 |
| _Roll_RA | 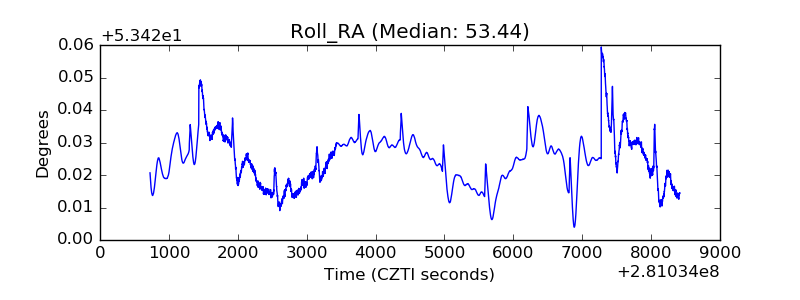 |
| Veto Counter | 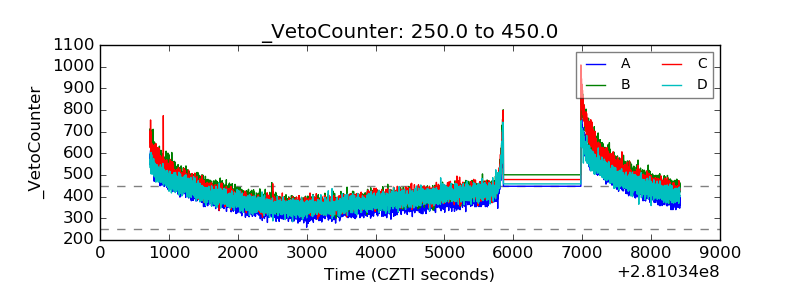 |