| Param | Original file | Final file |
|---|---|---|
| Filename | modeM0/AS1A05_056T01_9000002540_17121cztM0_level2.evt | modeM0/AS1A05_056T01_9000002540_17121cztM0_level2_quad_clean.evt |
| Size (bytes) | 445,455,360 | 98,294,400 |
| Size | 424.8 MB | 93.7 MB |
| Events in quadrant A | 3,183,390 | 644,514 |
| Events in quadrant B | 3,321,954 | 665,382 |
| Events in quadrant C | 3,393,150 | 614,059 |
| Events in quadrant D | 3,148,216 | 597,344 |
| Mode M0 | |||
|---|---|---|---|
| Quadrant | BADHDUFLAG | Total packets | Discarded packets |
| A | 0 | 13682 | 2 |
| B | 0 | 14033 | 2 |
| C | 0 | 13959 | 2 |
| D | 0 | 13939 | 2 |
| Mode M9 | |||
|---|---|---|---|
| Quadrant | BADHDUFLAG | Total packets | Discarded packets |
| A | 0 | 14 | 0 |
| B | 0 | 15 | 0 |
| C | 0 | 15 | 0 |
| D | 0 | 15 | 0 |
| Mode SS | |||
|---|---|---|---|
| Quadrant | BADHDUFLAG | Total packets | Discarded packets |
| A | 0 | 134 | 0 |
| B | 0 | 134 | 0 |
| C | 0 | 134 | 0 |
| D | 0 | 134 | 0 |
| Quadrant | Total seconds | Saturated seconds | Saturation percentage |
|---|---|---|---|
| A | 6526 | 32 | 0.490346% |
| B | 6526 | 69 | 1.057309% |
| C | 6526 | 51 | 0.781489% |
| D | 6526 | 42 | 0.643580% |
Noise dominated data is calculated using 1-second bins in cleaned event files. If a bin has >2000 counts, and if more than 50% of those come from <1% of pixels, then it is considered to be noise-dominated and hence unusable.
| Quadrant | # 1 sec bins | Bins with >0 counts | Bins with >2000 counts | High rate bins dominated by noise | Noise dominated (total time) | Noise dominated (detector-on time) | Marked lightcurve |
|---|---|---|---|---|---|---|---|
| A | 7751 | 6527 | 1 | 1 | 0.01% | 0.02% | 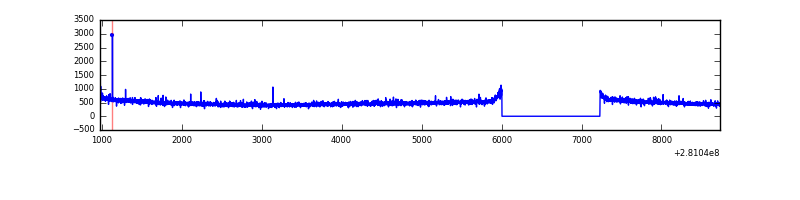 |
| B | 7751 | 6527 | 14 | 14 | 0.18% | 0.21% | 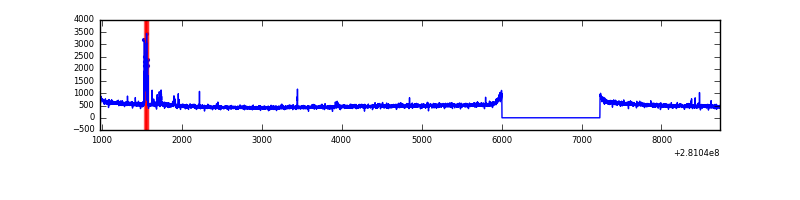 |
| C | 7751 | 6526 | 0 | 0 | 0.00% | 0.00% | 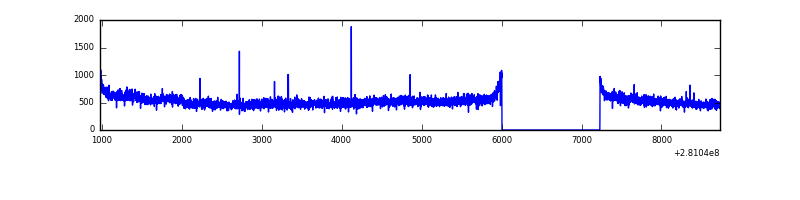 |
| D | 7751 | 6527 | 23 | 23 | 0.30% | 0.35% | 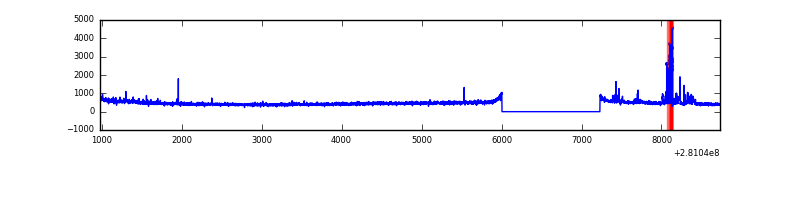 |
Top three noisy pixels from each quadrant. If the there are fewer than three noisy pixels in the level2.evt file, extra rows are filled as -1
| Pixel properties | Quadrant properties | ||||||
|---|---|---|---|---|---|---|---|
| Quadrant | DetID | PixID | Counts | Sigma | Mean | Median | Sigma |
| A | 4 | 2 | 18440 | 107.54 | 819 | 805 | 164.0 |
| A | 12 | 189 | 14437 | 83.13 | 819 | 805 | 164.0 |
| A | 0 | 226 | 7143 | 38.65 | 819 | 805 | 164.0 |
| B | 0 | 229 | 93955 | 590.8 | 826 | 807 | 157.7 |
| B | 12 | 111 | 18828 | 114.3 | 826 | 807 | 157.7 |
| B | 11 | 111 | 16070 | 96.81 | 826 | 807 | 157.7 |
| C | 3 | 233 | 202494 | 1103.23 | 783 | 791 | 182.8 |
| C | 14 | 238 | 122041 | 663.18 | 783 | 791 | 182.8 |
| C | 5 | 112 | 10240 | 51.68 | 783 | 791 | 182.8 |
| D | 5 | 222 | 173810 | 898.36 | 783 | 760 | 192.6 |
| D | 2 | 234 | 23511 | 118.11 | 783 | 760 | 192.6 |
| D | 6 | 18 | 8710 | 41.27 | 783 | 760 | 192.6 |
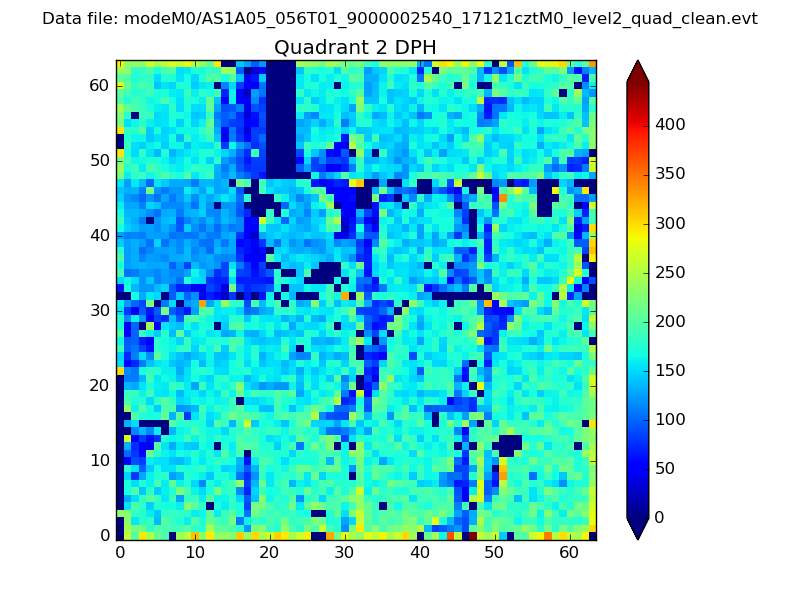
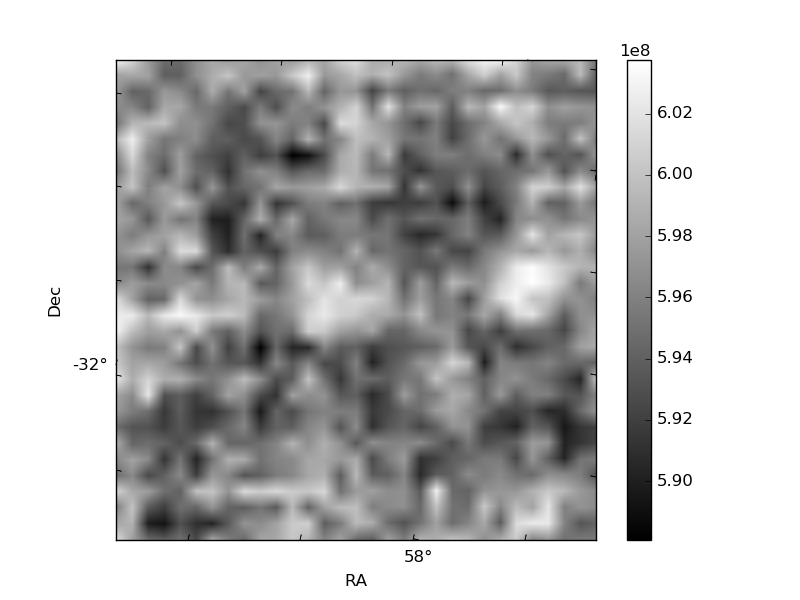
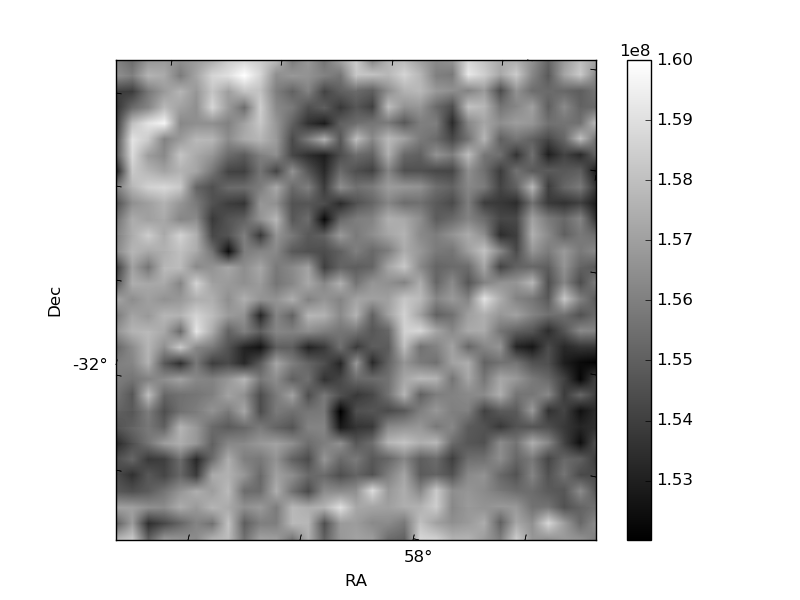
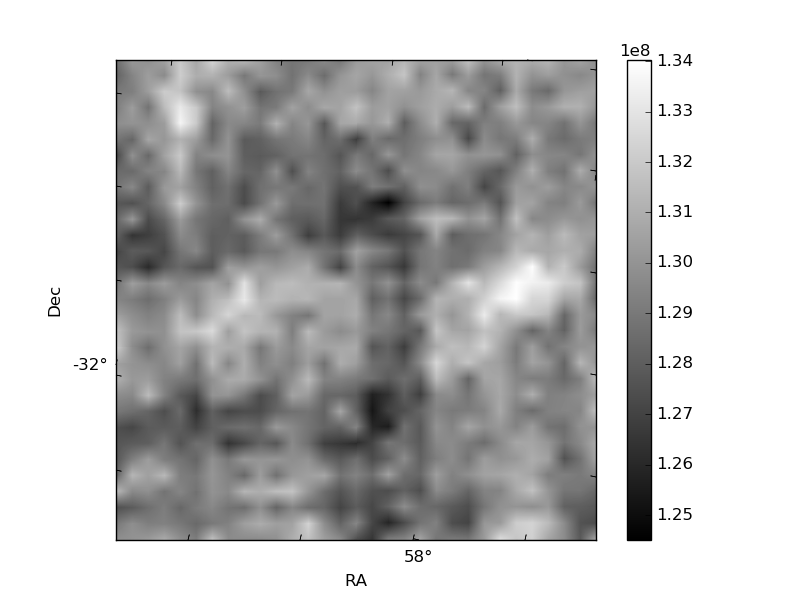
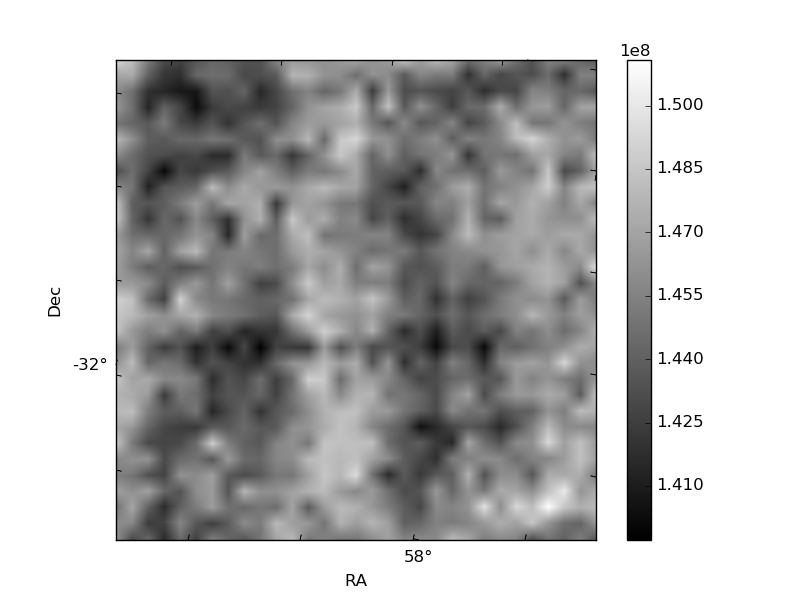
Histogram calculated using DETX and DETY for each event in the final _common_clean file
| Quadrant A | 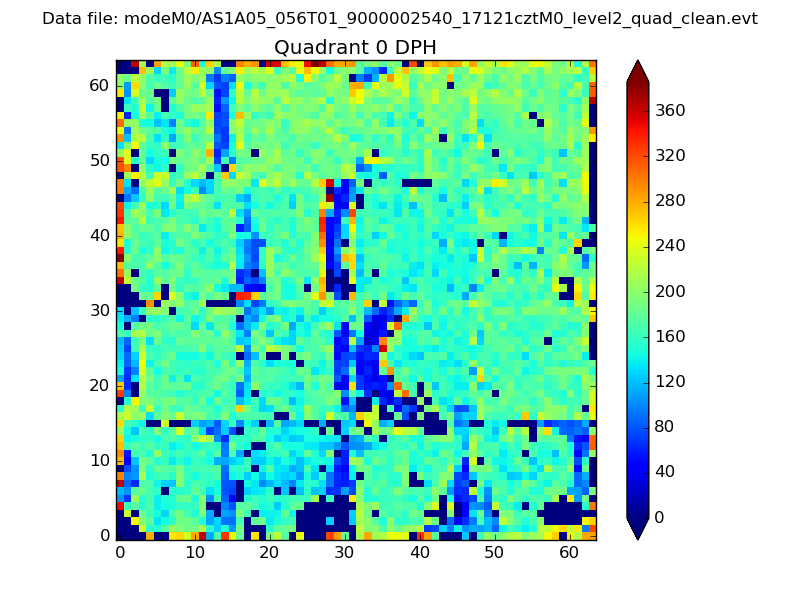 |
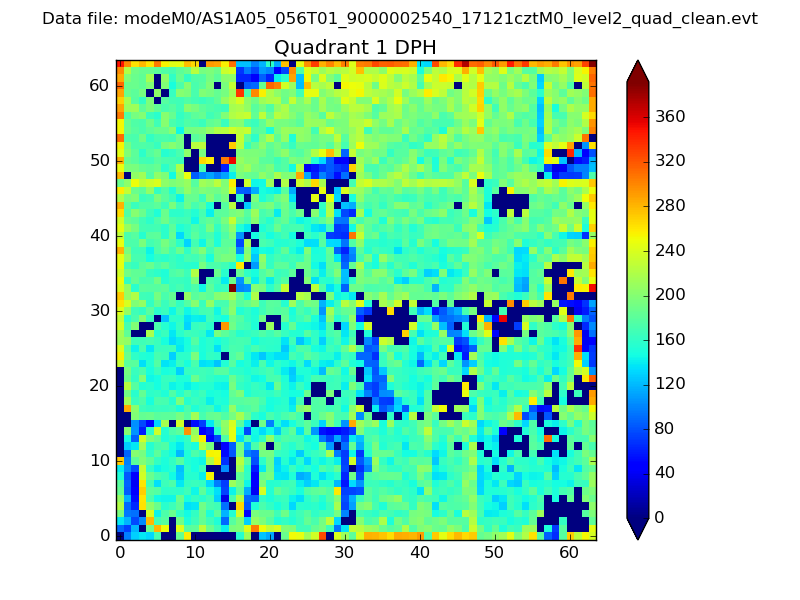 |
Quadrant B |
|---|---|---|---|
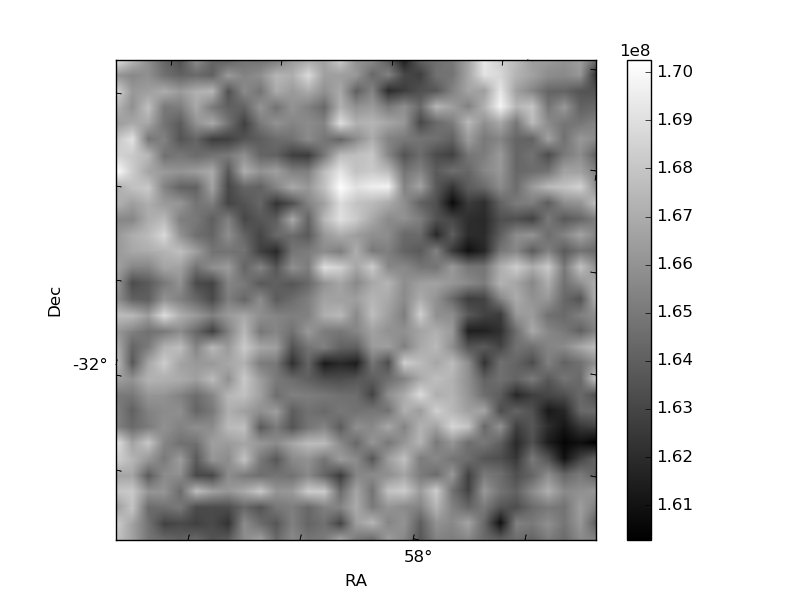
| Quadrant D | 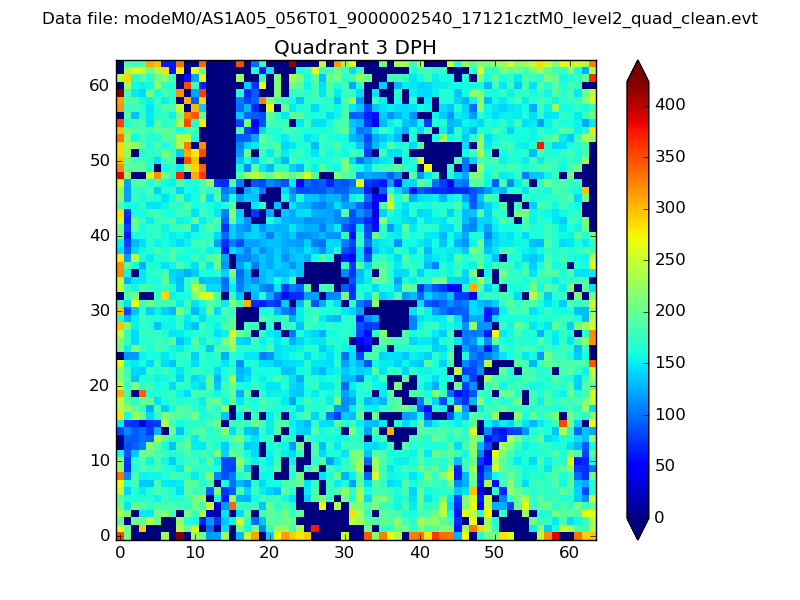 |
 |
Quadrant C |
| Plot type | Count rate plots | Images |
|---|---|---|
| Comparison with Poisson distribution Blue bars denote a histogram of data divided into 1 sec bins. Red curve is a Poisson curve with rate = median count rate of data. |
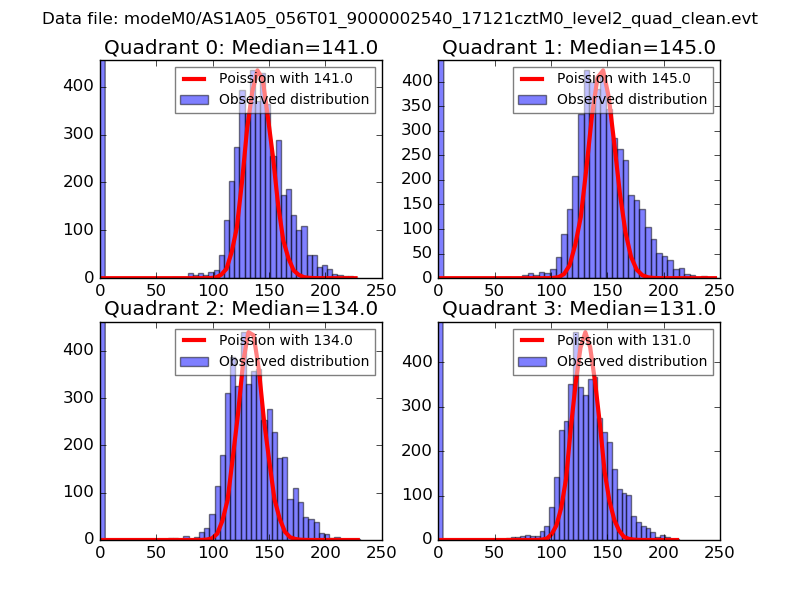 |
 |
| Quadrant-wise count rates Data is divided into 100 sec bins |
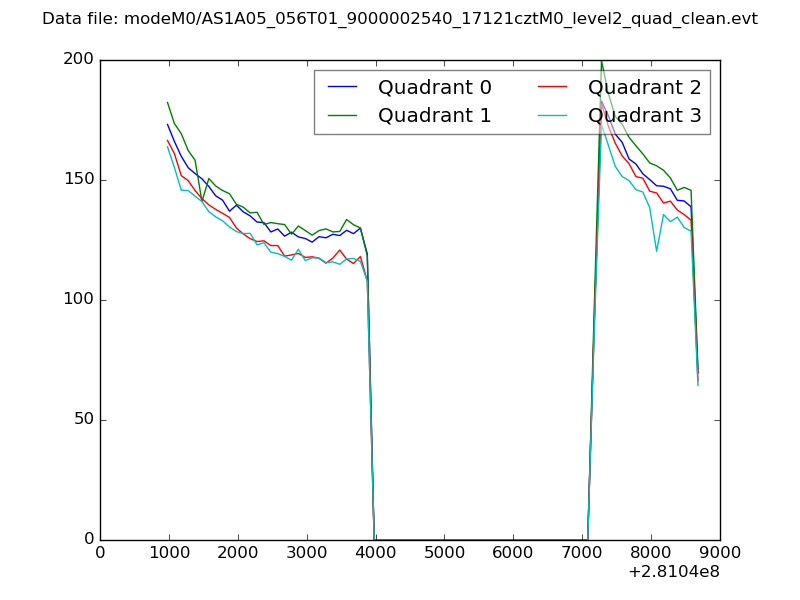 |
|
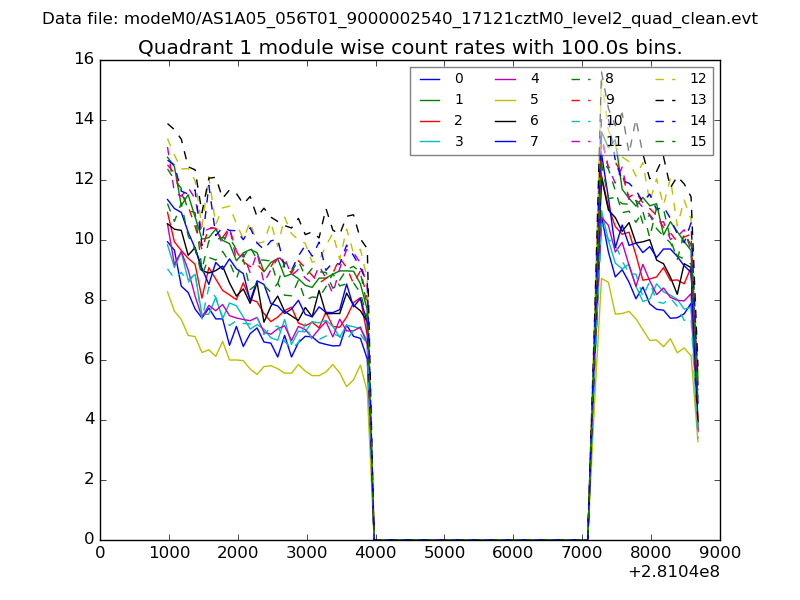
| Module-wise count rates for Quadrant A Data is divided into 100 sec bins |
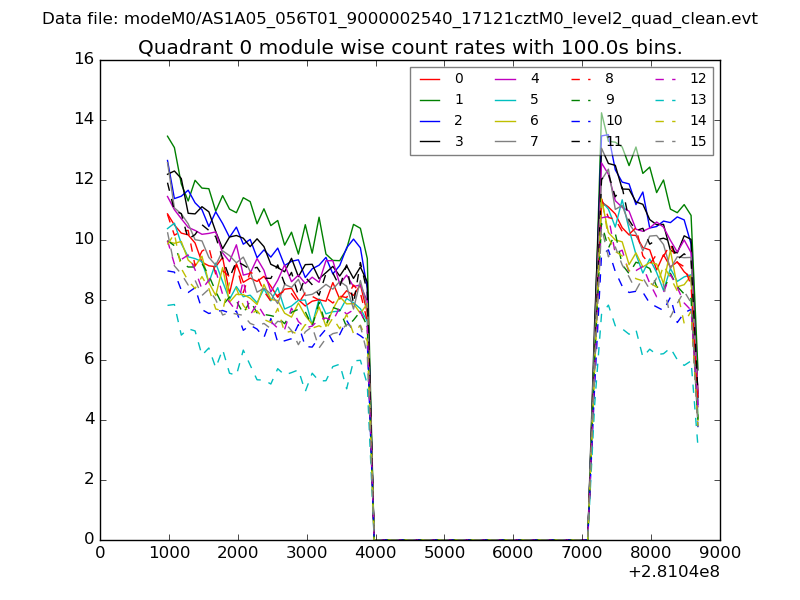 |
 |
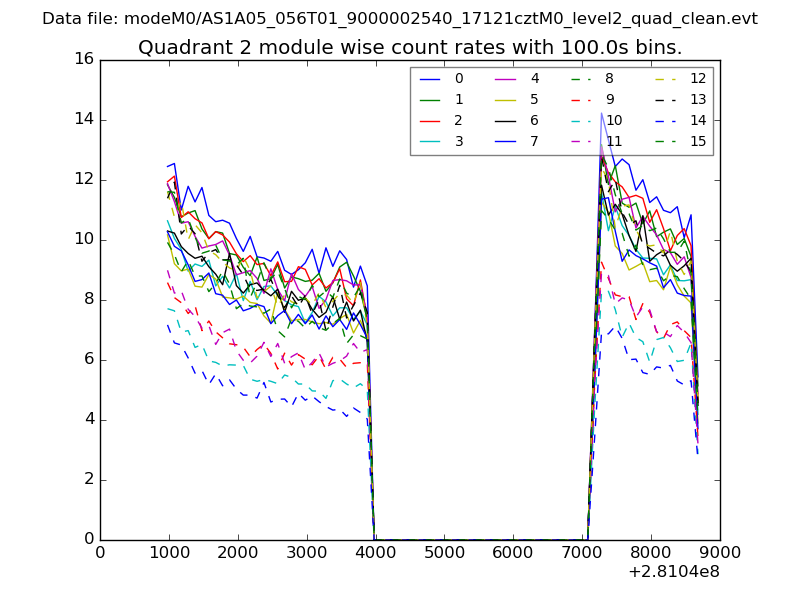
| Module-wise count rates for Quadrant B Data is divided into 100 sec bins |
 |
 |
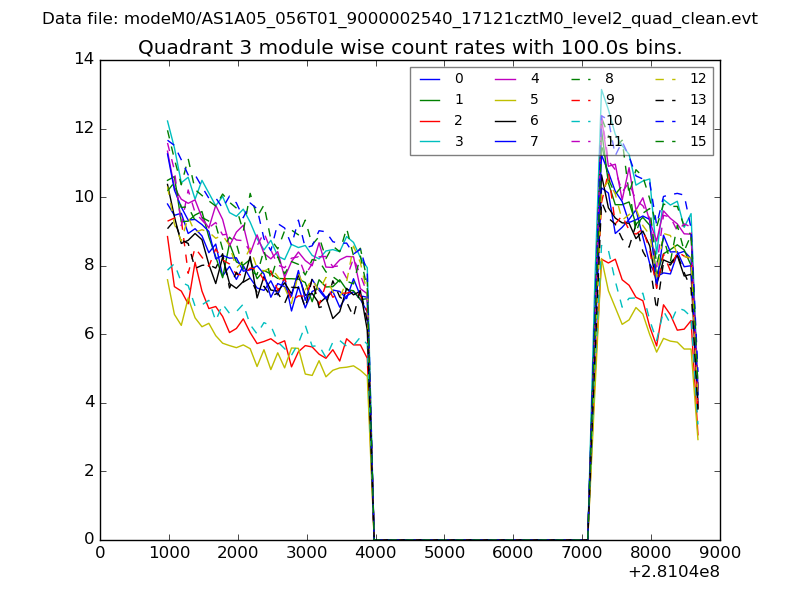
| Module-wise count rates for Quadrant C Data is divided into 100 sec bins |
 |
 |
| Module-wise count rates for Quadrant D Data is divided into 100 sec bins |
 |
 |
| Parameter | Plot |
|---|---|
| CZT HV Monitor | 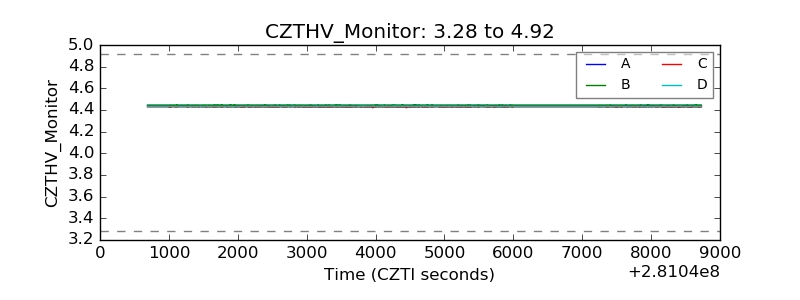 |
| D_VDD | 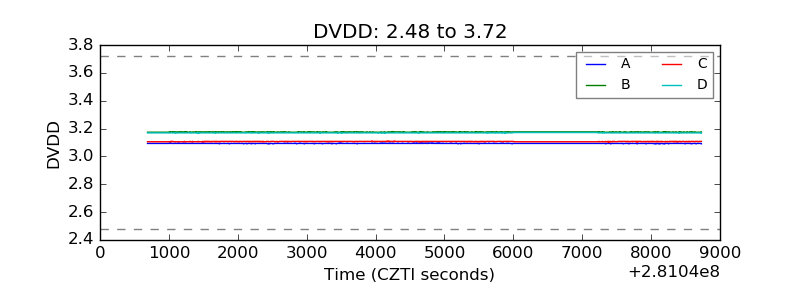 |
| Temperature 1 | 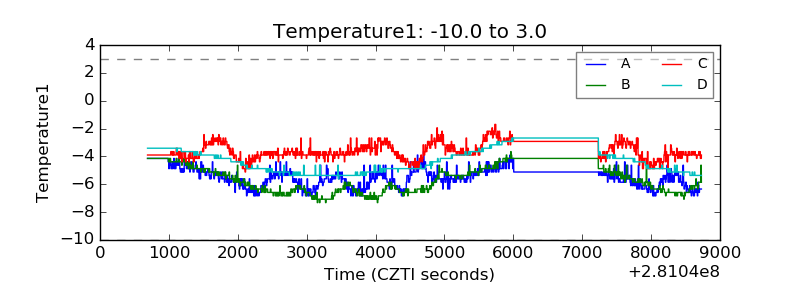 |
| Veto HV Monitor | 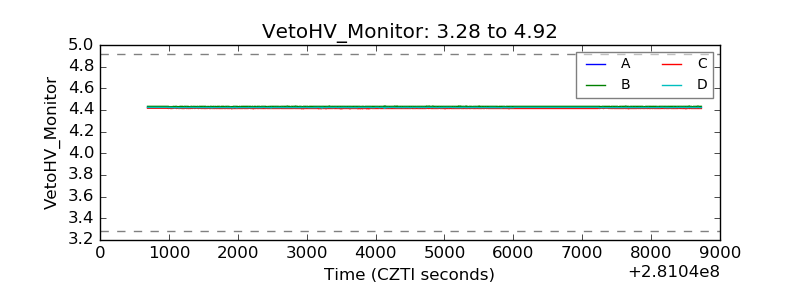 |
| Veto LLD | 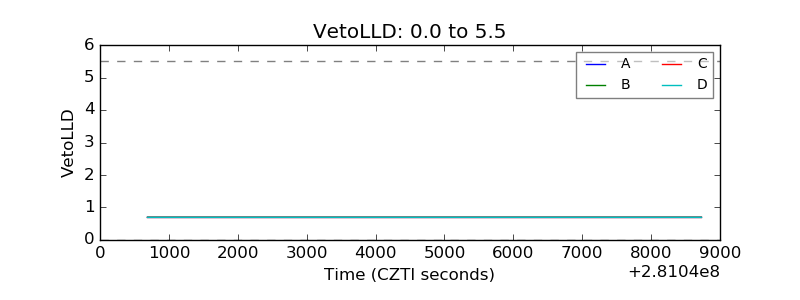 |
| Alpha Counter | 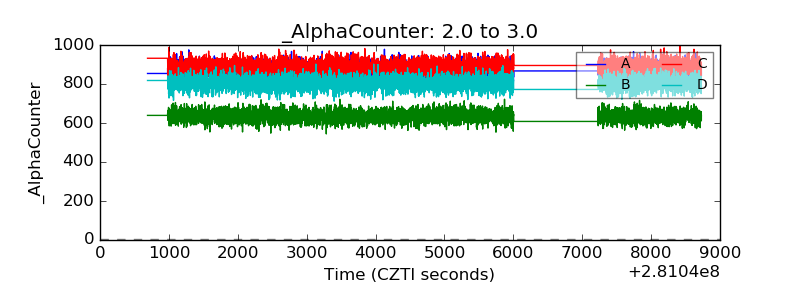 |
| _CPM_Rate | 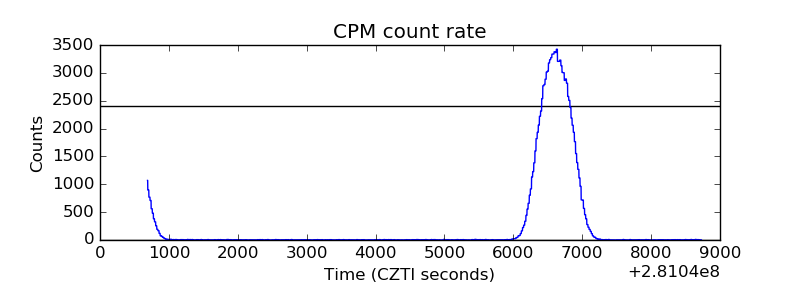 |
| CZT Counter | 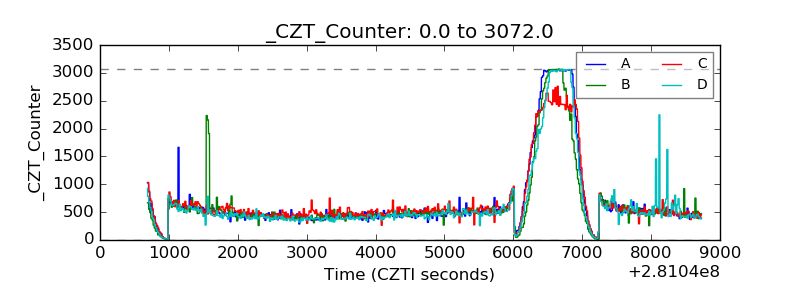 |
| +2.5 Volts monitor |  |
| +5 Volts monitor |  |
| _ROLL_ROT |  |
| _Roll_DEC | 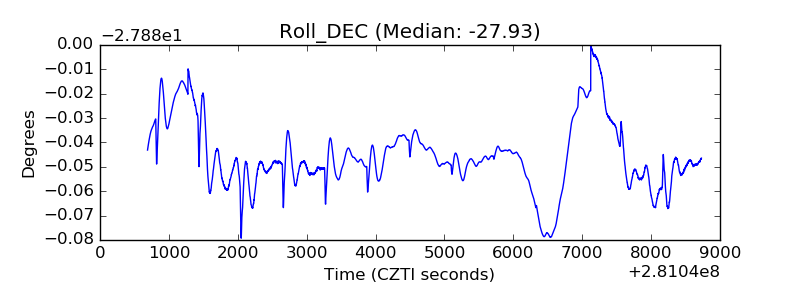 |
| _Roll_RA | 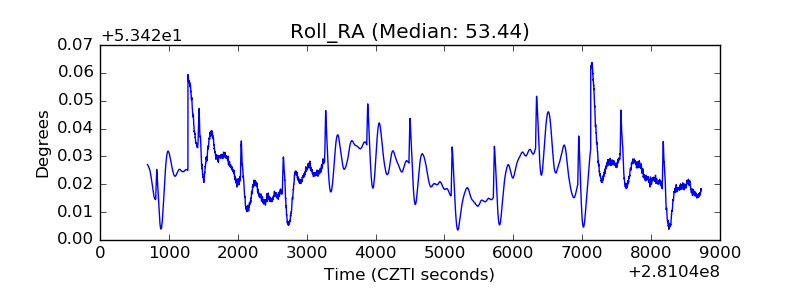 |
| Veto Counter |  |