| Param | Original file | Final file |
|---|---|---|
| Filename | modeM0/AS1A05_056T01_9000002540_17131cztM0_level2.evt | modeM0/AS1A05_056T01_9000002540_17131cztM0_level2_quad_clean.evt |
| Size (bytes) | 816,220,800 | 141,900,480 |
| Size | 778.4 MB | 135.3 MB |
| Events in quadrant A | 5,439,575 | 887,165 |
| Events in quadrant B | 5,563,207 | 894,323 |
| Events in quadrant C | 7,011,191 | 846,376 |
| Events in quadrant D | 5,902,087 | 849,475 |
| Mode M0 | |||
|---|---|---|---|
| Quadrant | BADHDUFLAG | Total packets | Discarded packets |
| A | 0 | 24117 | 2 |
| B | 0 | 24171 | 2 |
| C | 0 | 28797 | 2 |
| D | 0 | 25797 | 2 |
| Mode M9 | |||
|---|---|---|---|
| Quadrant | BADHDUFLAG | Total packets | Discarded packets |
| A | 0 | 12 | 0 |
| B | 0 | 12 | 0 |
| C | 0 | 12 | 0 |
| D | 0 | 12 | 0 |
| Mode SS | |||
|---|---|---|---|
| Quadrant | BADHDUFLAG | Total packets | Discarded packets |
| A | 0 | 242 | 0 |
| B | 0 | 242 | 0 |
| C | 0 | 242 | 0 |
| D | 0 | 242 | 0 |
| Quadrant | Total seconds | Saturated seconds | Saturation percentage |
|---|---|---|---|
| A | 11855 | 151 | 1.273724% |
| B | 11856 | 150 | 1.265182% |
| C | 11856 | 245 | 2.066464% |
| D | 11856 | 152 | 1.282051% |
Noise dominated data is calculated using 1-second bins in cleaned event files. If a bin has >2000 counts, and if more than 50% of those come from <1% of pixels, then it is considered to be noise-dominated and hence unusable.
| Quadrant | # 1 sec bins | Bins with >0 counts | Bins with >2000 counts | High rate bins dominated by noise | Noise dominated (total time) | Noise dominated (detector-on time) | Marked lightcurve |
|---|---|---|---|---|---|---|---|
| A | 13070 | 11856 | 0 | 0 | 0.00% | 0.00% | 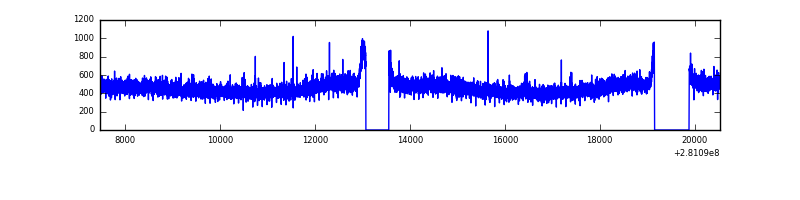 |
| B | 13071 | 11857 | 0 | 0 | 0.00% | 0.00% | 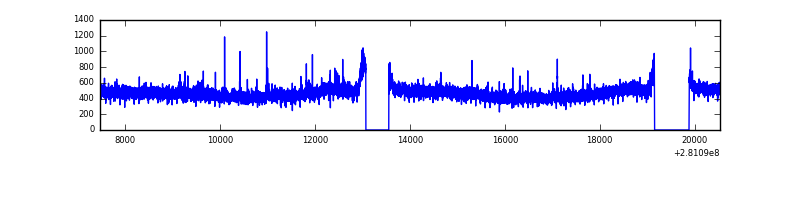 |
| C | 13071 | 11857 | 0 | 0 | 0.00% | 0.00% | 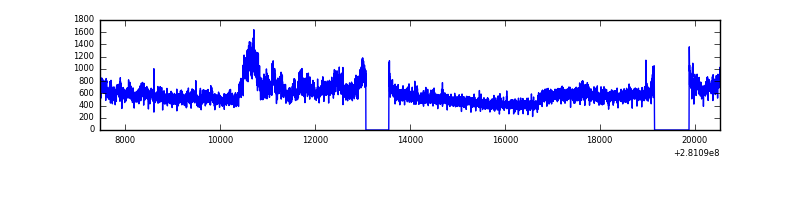 |
| D | 13071 | 11857 | 23 | 23 | 0.18% | 0.19% | 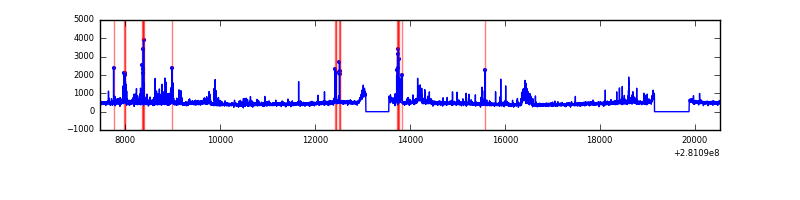 |
Top three noisy pixels from each quadrant. If the there are fewer than three noisy pixels in the level2.evt file, extra rows are filled as -1
| Pixel properties | Quadrant properties | ||||||
|---|---|---|---|---|---|---|---|
| Quadrant | DetID | PixID | Counts | Sigma | Mean | Median | Sigma |
| A | 12 | 189 | 23936 | 79.53 | 1409 | 1378 | 283.6 |
| A | 0 | 226 | 12211 | 38.19 | 1409 | 1378 | 283.6 |
| A | 3 | 137 | 10834 | 33.34 | 1409 | 1378 | 283.6 |
| B | 12 | 111 | 34023 | 119.64 | 1408 | 1371 | 272.9 |
| B | 0 | 229 | 30544 | 106.9 | 1408 | 1371 | 272.9 |
| B | 11 | 111 | 29738 | 103.94 | 1408 | 1371 | 272.9 |
| C | 3 | 233 | 1531136 | 4849.82 | 1349 | 1361 | 315.4 |
| C | 14 | 238 | 206720 | 651.05 | 1349 | 1361 | 315.4 |
| C | 13 | 61 | 9638 | 26.24 | 1349 | 1361 | 315.4 |
| D | 5 | 222 | 568676 | 1686.76 | 1371 | 1329 | 336.4 |
| D | 13 | 249 | 151569 | 446.67 | 1371 | 1329 | 336.4 |
| D | 2 | 234 | 44291 | 127.73 | 1371 | 1329 | 336.4 |
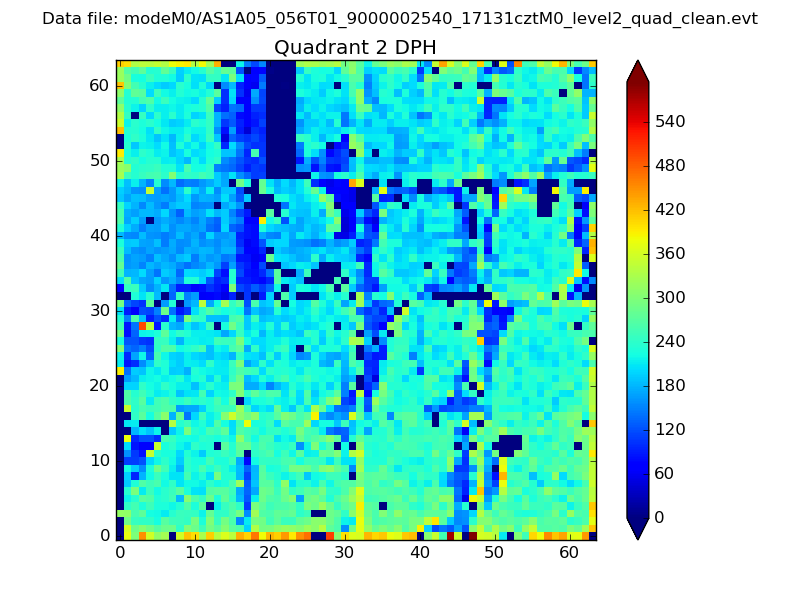
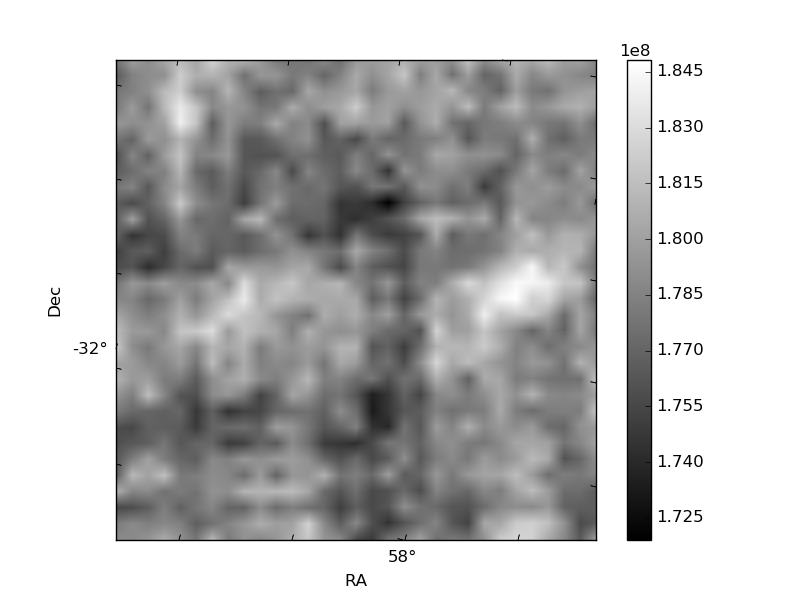
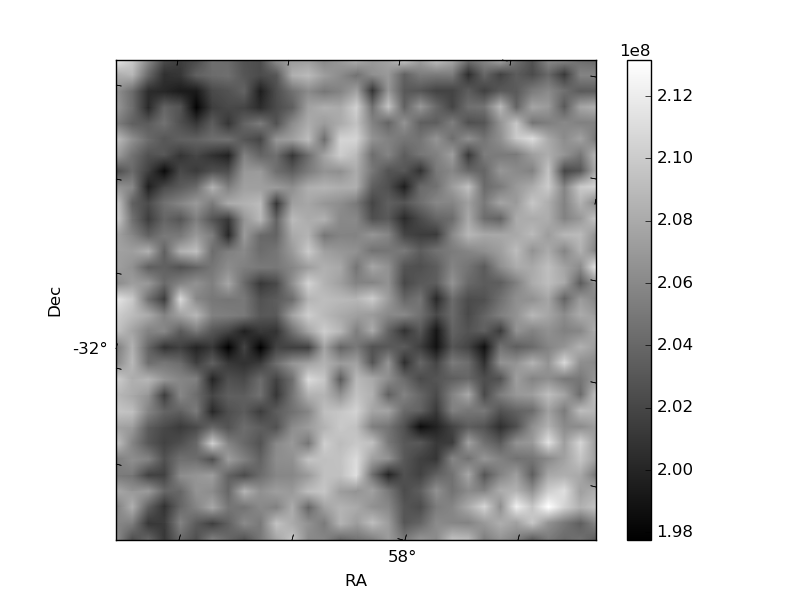
Histogram calculated using DETX and DETY for each event in the final _common_clean file
| Quadrant A | 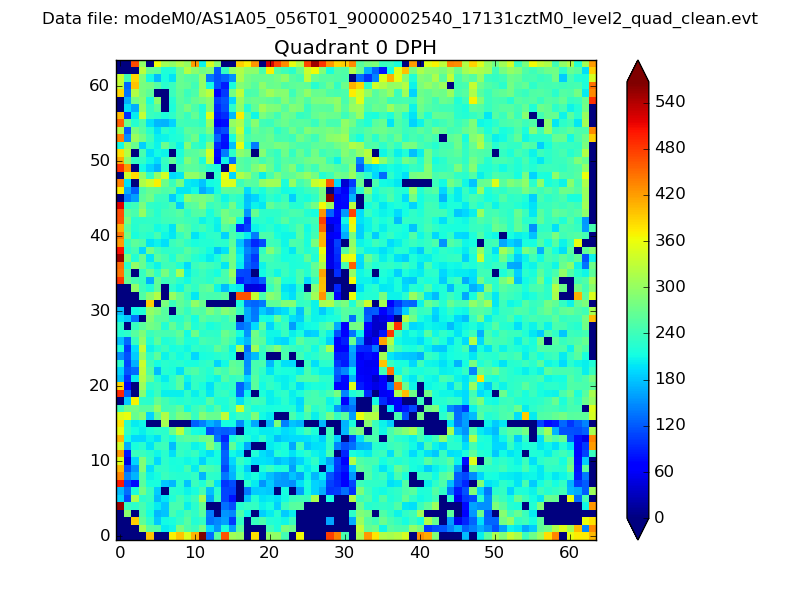 |
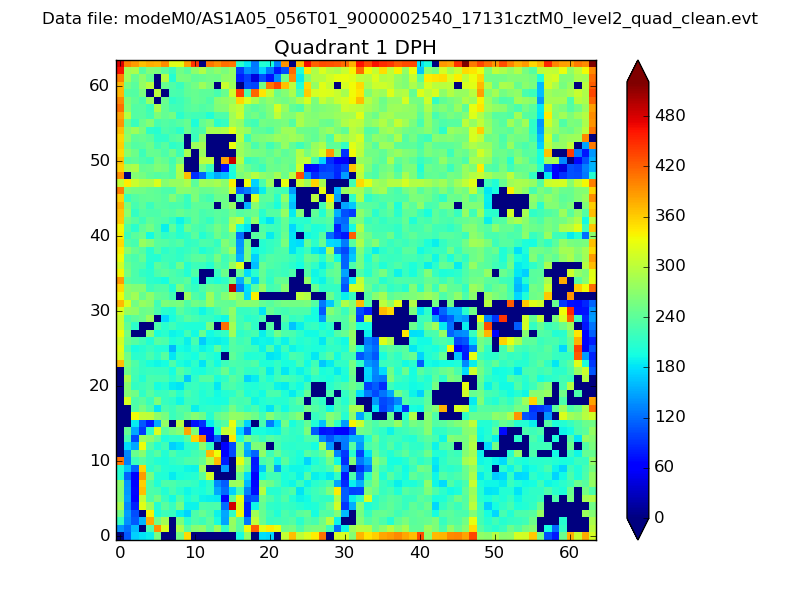 |
Quadrant B |
|---|---|---|---|
| Quadrant D | 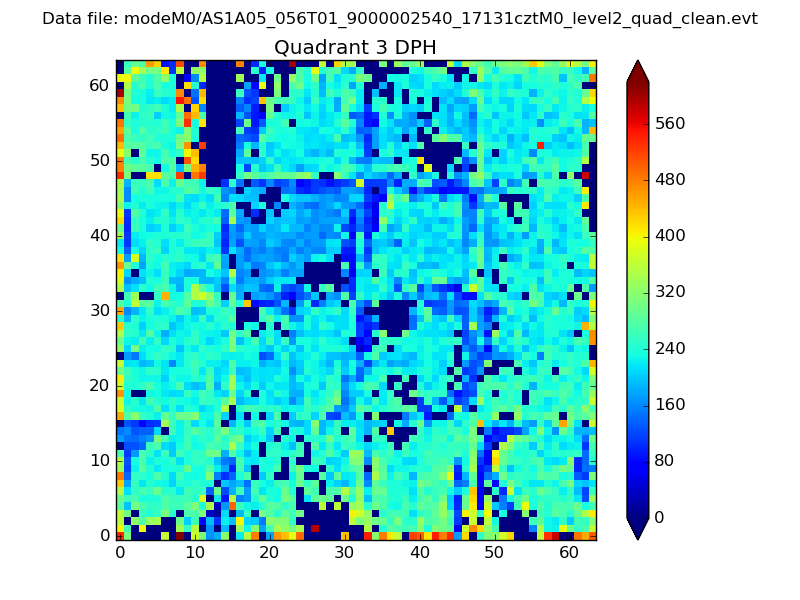 |
 |
Quadrant C |
| Plot type | Count rate plots | Images |
|---|---|---|
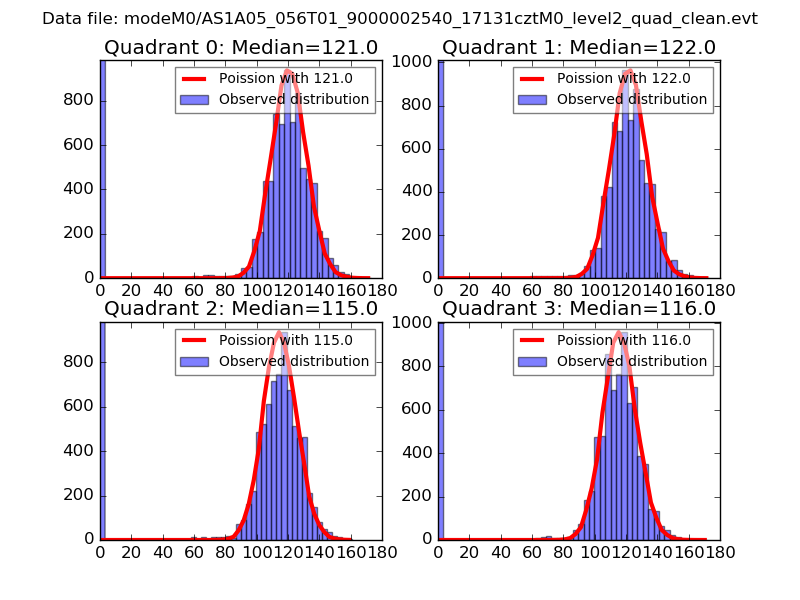
| Comparison with Poisson distribution Blue bars denote a histogram of data divided into 1 sec bins. Red curve is a Poisson curve with rate = median count rate of data. |
 |
 |
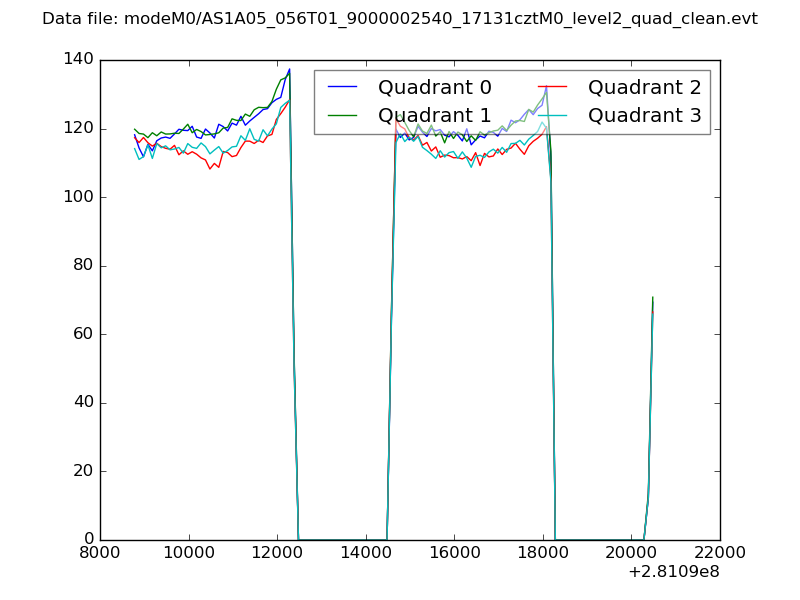
| Quadrant-wise count rates Data is divided into 100 sec bins |
 |
|
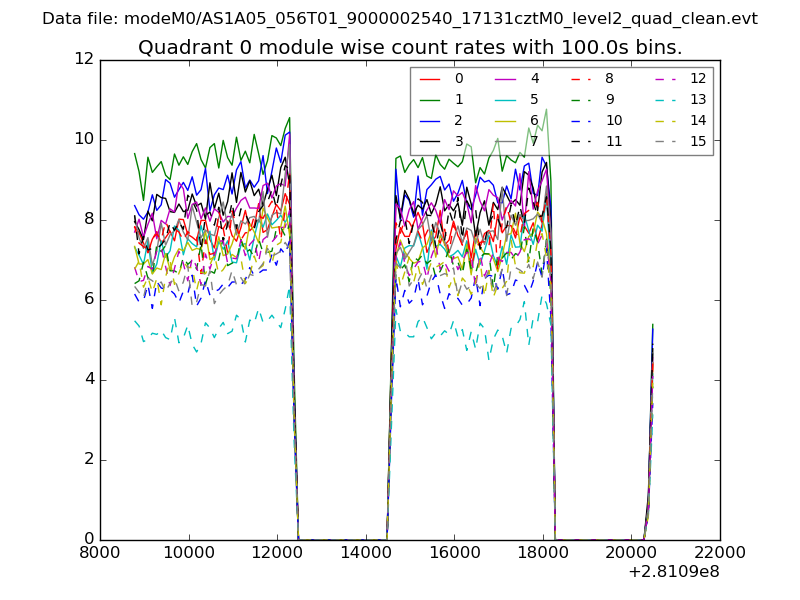
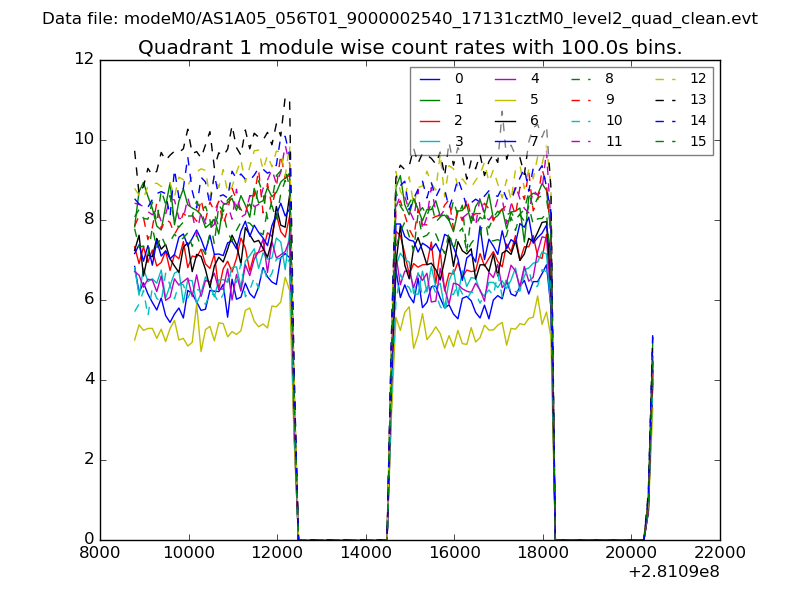
| Module-wise count rates for Quadrant A Data is divided into 100 sec bins |
 |
 |
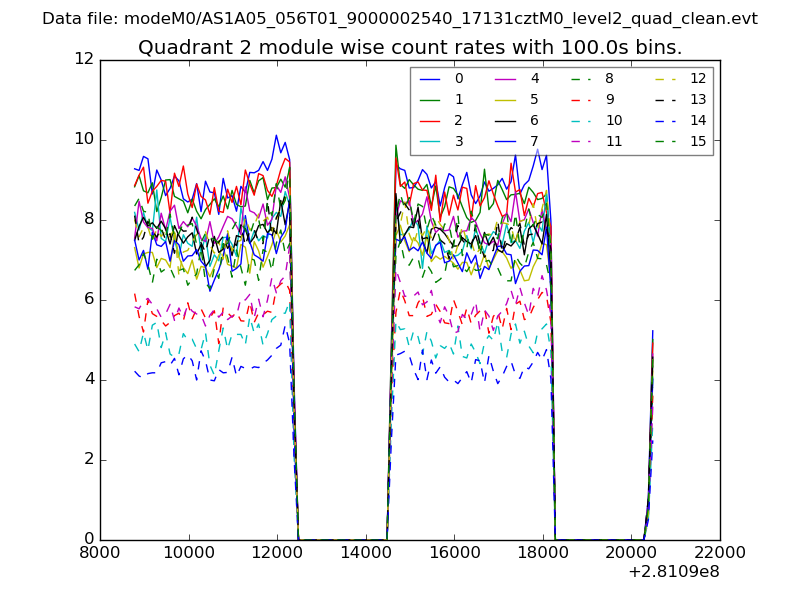
| Module-wise count rates for Quadrant B Data is divided into 100 sec bins |
 |
 |
| Module-wise count rates for Quadrant C Data is divided into 100 sec bins |
 |
 |
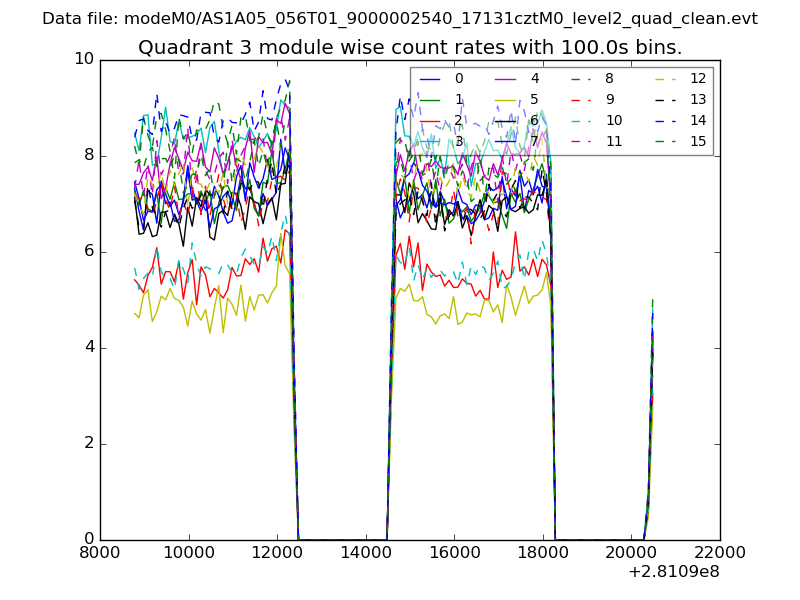
| Module-wise count rates for Quadrant D Data is divided into 100 sec bins |
 |
 |
| Parameter | Plot |
|---|---|
| CZT HV Monitor | 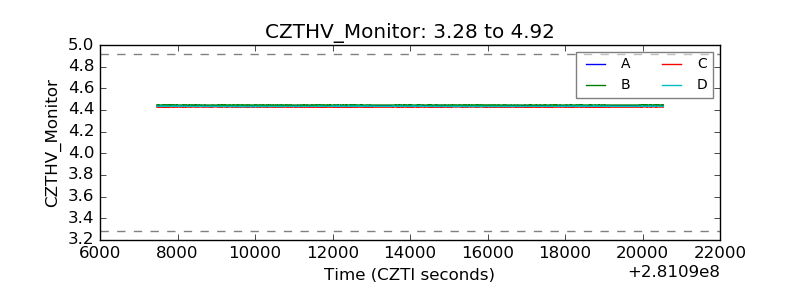 |
| D_VDD | 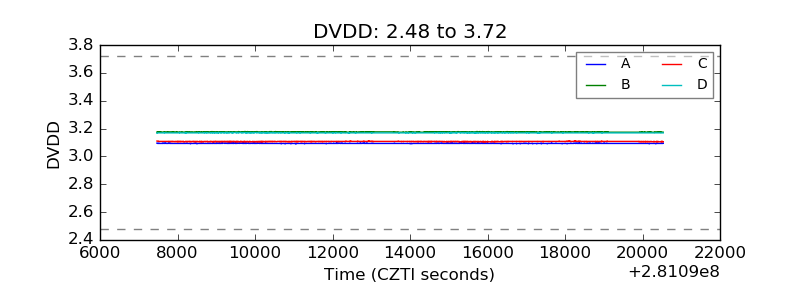 |
| Temperature 1 | 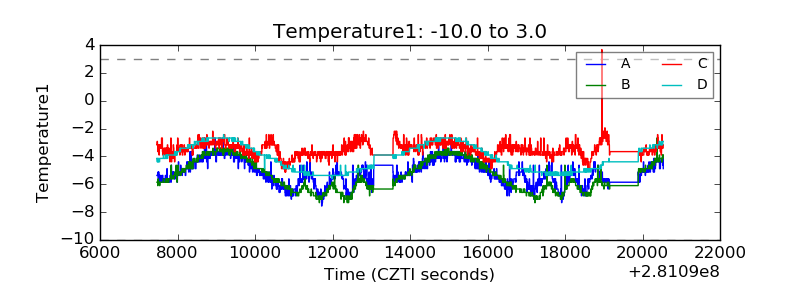 |
| Veto HV Monitor | 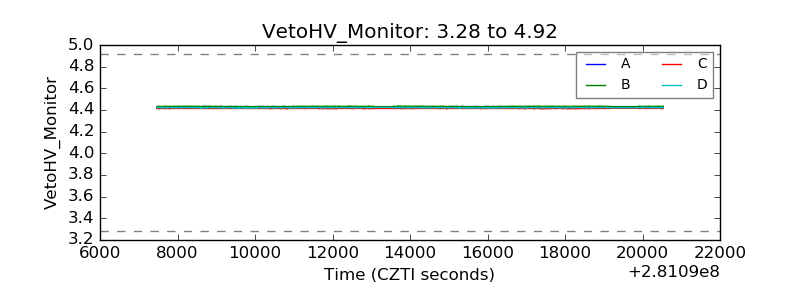 |
| Veto LLD | 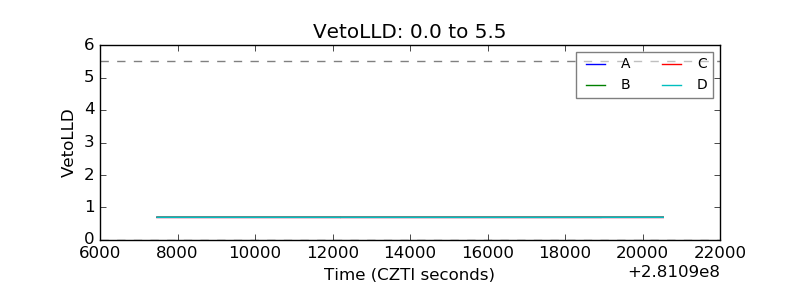 |
| Alpha Counter |  |
| _CPM_Rate | 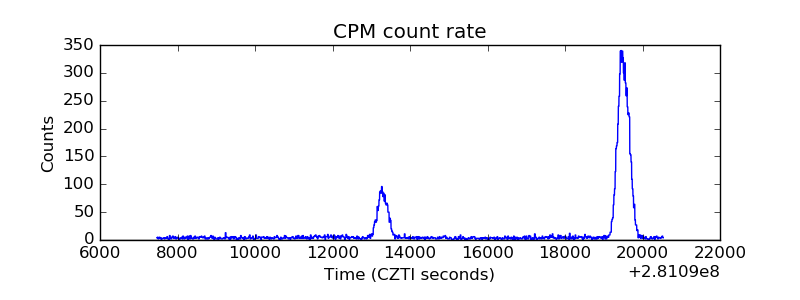 |
| CZT Counter | 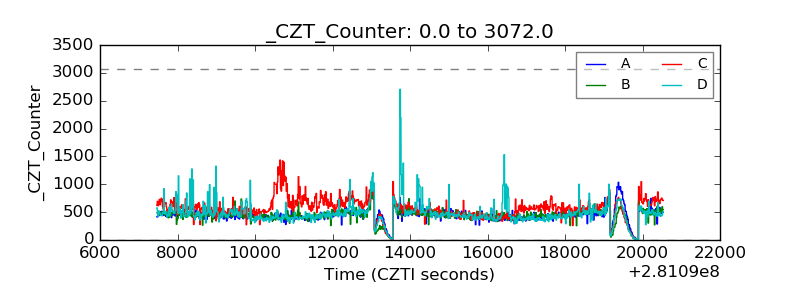 |
| +2.5 Volts monitor |  |
| +5 Volts monitor |  |
| _ROLL_ROT | 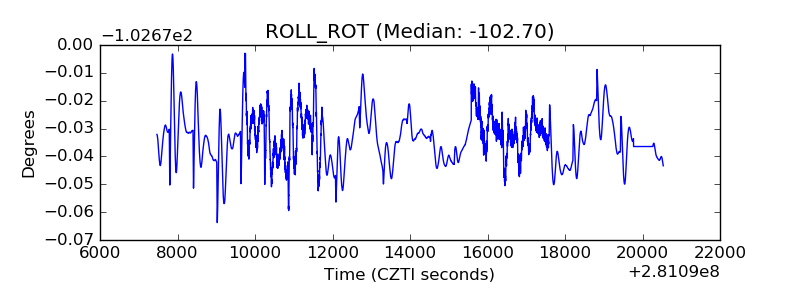 |
| _Roll_DEC | 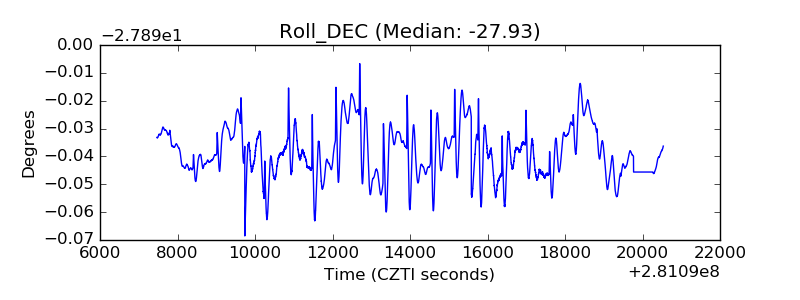 |
| _Roll_RA |  |
| Veto Counter | 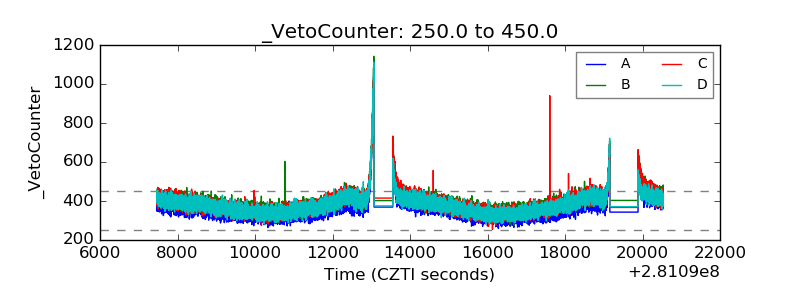 |