| Param | Original file | Final file |
|---|---|---|
| Filename | modeM0/AS1A05_056T01_9000002540_17132cztM0_level2.evt | modeM0/AS1A05_056T01_9000002540_17132cztM0_level2_quad_clean.evt |
| Size (bytes) | 527,901,120 | 93,499,200 |
| Size | 503.4 MB | 89.2 MB |
| Events in quadrant A | 3,384,430 | 596,633 |
| Events in quadrant B | 3,469,971 | 603,782 |
| Events in quadrant C | 5,152,383 | 563,879 |
| Events in quadrant D | 3,494,312 | 567,737 |
| Mode M0 | |||
|---|---|---|---|
| Quadrant | BADHDUFLAG | Total packets | Discarded packets |
| A | 0 | 14733 | 2 |
| B | 0 | 14820 | 2 |
| C | 0 | 20619 | 2 |
| D | 0 | 15361 | 2 |
| Mode M9 | |||
|---|---|---|---|
| Quadrant | BADHDUFLAG | Total packets | Discarded packets |
| A | 0 | 15 | 0 |
| B | 0 | 15 | 0 |
| C | 0 | 15 | 0 |
| D | 0 | 15 | 0 |
| Mode SS | |||
|---|---|---|---|
| Quadrant | BADHDUFLAG | Total packets | Discarded packets |
| A | 0 | 150 | 0 |
| B | 0 | 150 | 0 |
| C | 0 | 150 | 0 |
| D | 0 | 150 | 0 |
| Quadrant | Total seconds | Saturated seconds | Saturation percentage |
|---|---|---|---|
| A | 7162 | 71 | 0.991343% |
| B | 7162 | 74 | 1.033231% |
| C | 7162 | 169 | 2.359676% |
| D | 7162 | 68 | 0.949455% |
Noise dominated data is calculated using 1-second bins in cleaned event files. If a bin has >2000 counts, and if more than 50% of those come from <1% of pixels, then it is considered to be noise-dominated and hence unusable.
| Quadrant | # 1 sec bins | Bins with >0 counts | Bins with >2000 counts | High rate bins dominated by noise | Noise dominated (total time) | Noise dominated (detector-on time) | Marked lightcurve |
|---|---|---|---|---|---|---|---|
| A | 8777 | 7164 | 0 | 0 | 0.00% | 0.00% | 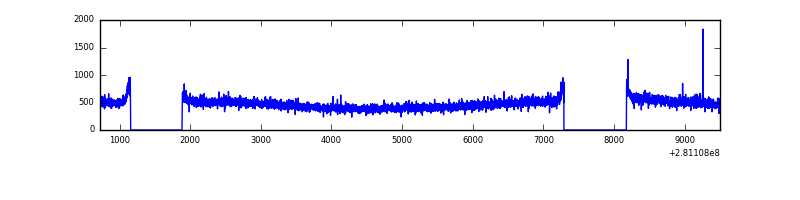 |
| B | 8777 | 7164 | 0 | 0 | 0.00% | 0.00% | 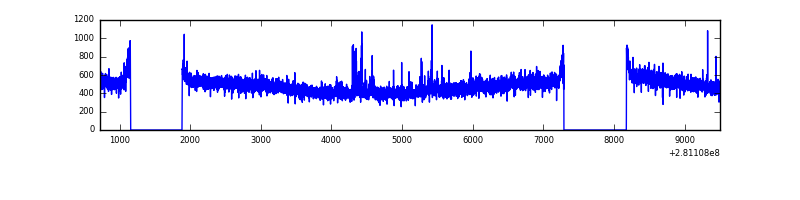 |
| C | 8777 | 7164 | 2 | 2 | 0.02% | 0.03% | 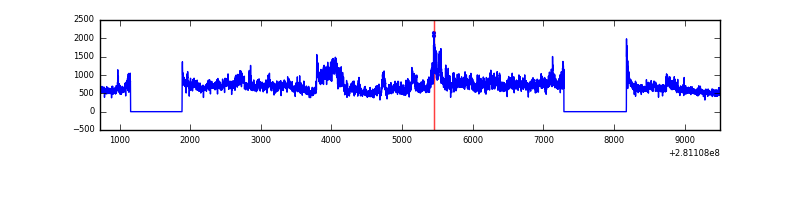 |
| D | 8777 | 7164 | 23 | 23 | 0.26% | 0.32% | 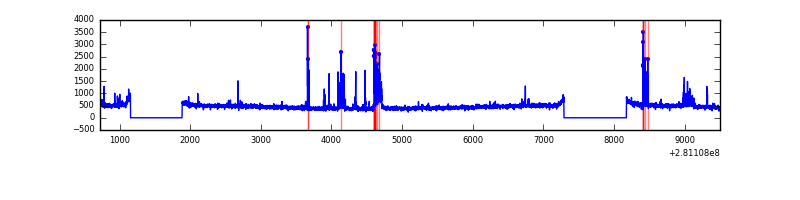 |
Top three noisy pixels from each quadrant. If the there are fewer than three noisy pixels in the level2.evt file, extra rows are filled as -1
| Pixel properties | Quadrant properties | ||||||
|---|---|---|---|---|---|---|---|
| Quadrant | DetID | PixID | Counts | Sigma | Mean | Median | Sigma |
| A | 12 | 189 | 18401 | 98.78 | 876 | 857 | 177.6 |
| A | 0 | 226 | 7483 | 37.31 | 876 | 857 | 177.6 |
| A | 3 | 137 | 6781 | 33.35 | 876 | 857 | 177.6 |
| B | 0 | 229 | 56787 | 327.34 | 873 | 852 | 170.9 |
| B | 12 | 111 | 21068 | 118.31 | 873 | 852 | 170.9 |
| B | 11 | 111 | 18374 | 102.54 | 873 | 852 | 170.9 |
| C | 3 | 233 | 1790353 | 9133.15 | 829 | 831 | 195.9 |
| C | 14 | 238 | 126369 | 640.7 | 829 | 831 | 195.9 |
| C | 13 | 61 | 5825 | 25.49 | 829 | 831 | 195.9 |
| D | 5 | 222 | 262108 | 1268.44 | 846 | 821 | 206.0 |
| D | 2 | 234 | 27309 | 128.59 | 846 | 821 | 206.0 |
| D | 13 | 238 | 15439 | 70.96 | 846 | 821 | 206.0 |
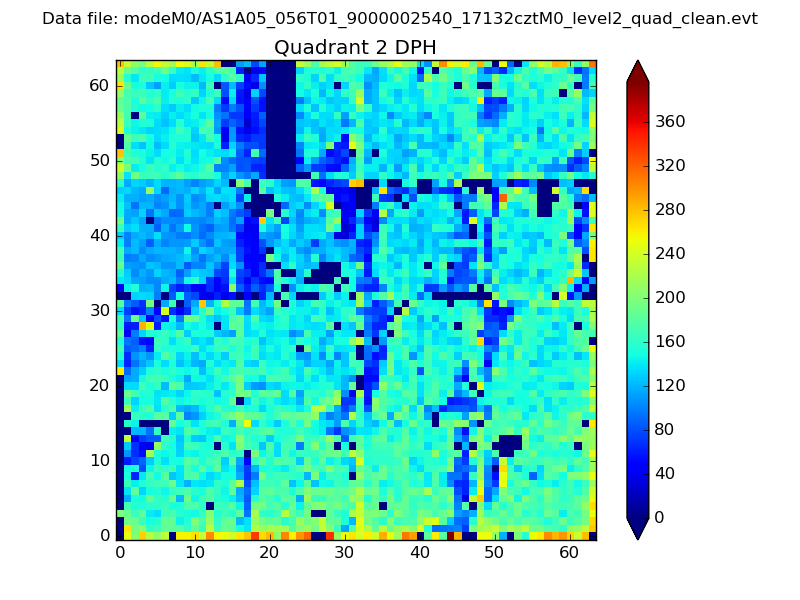
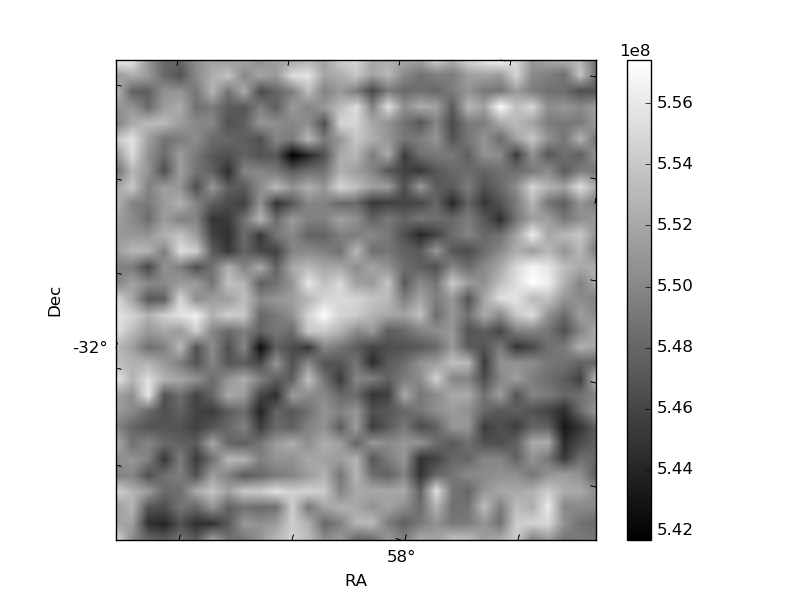
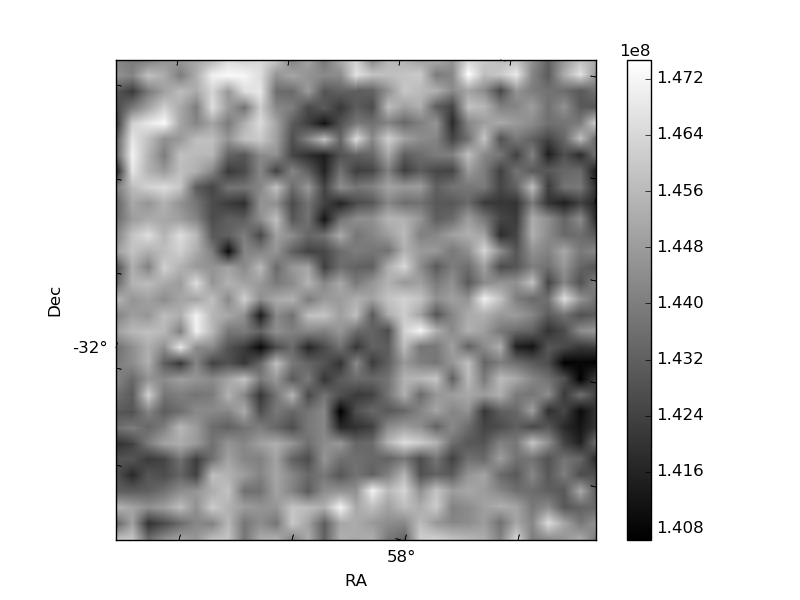
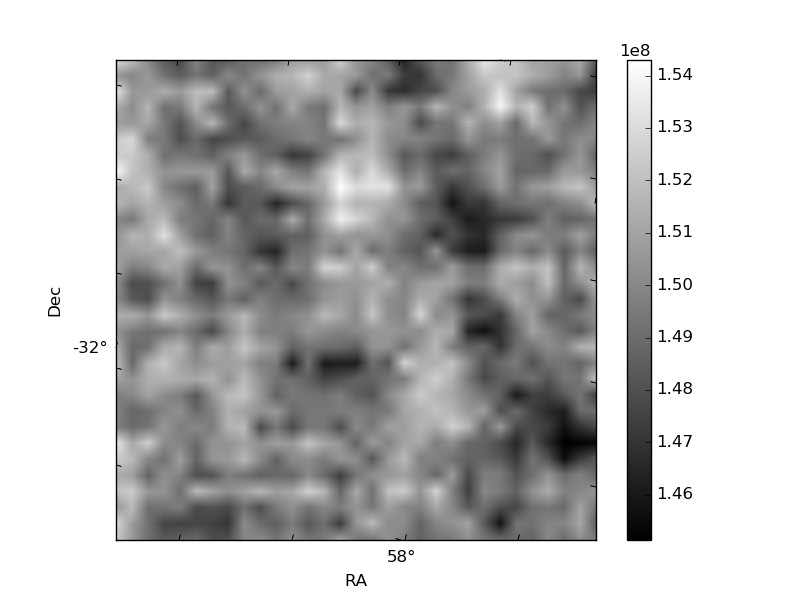
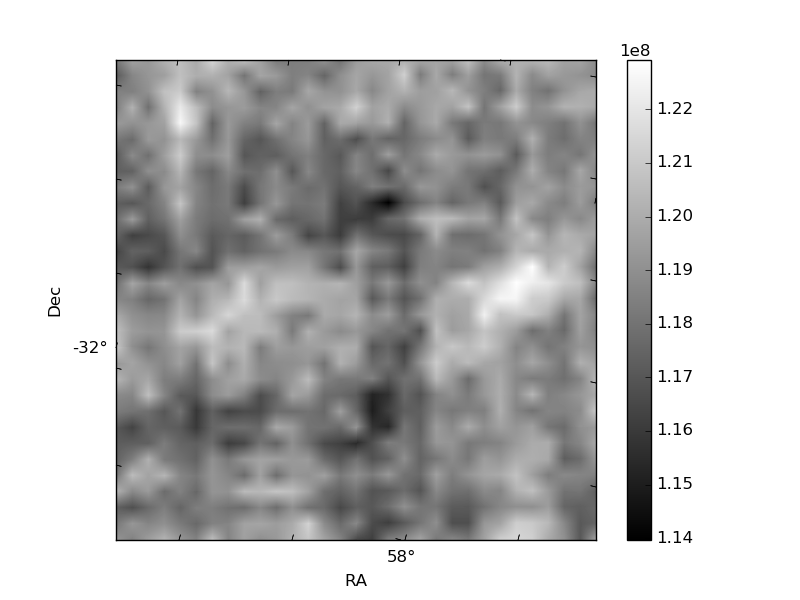
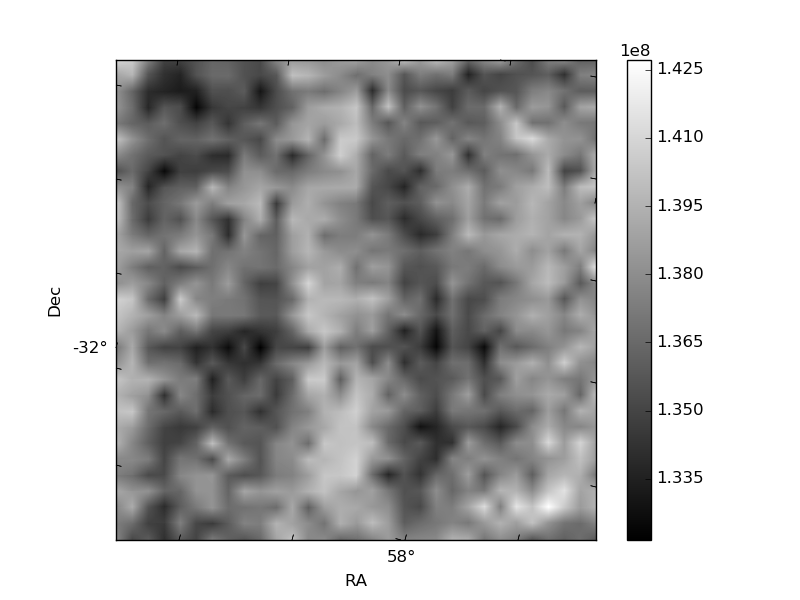
Histogram calculated using DETX and DETY for each event in the final _common_clean file
| Quadrant A | 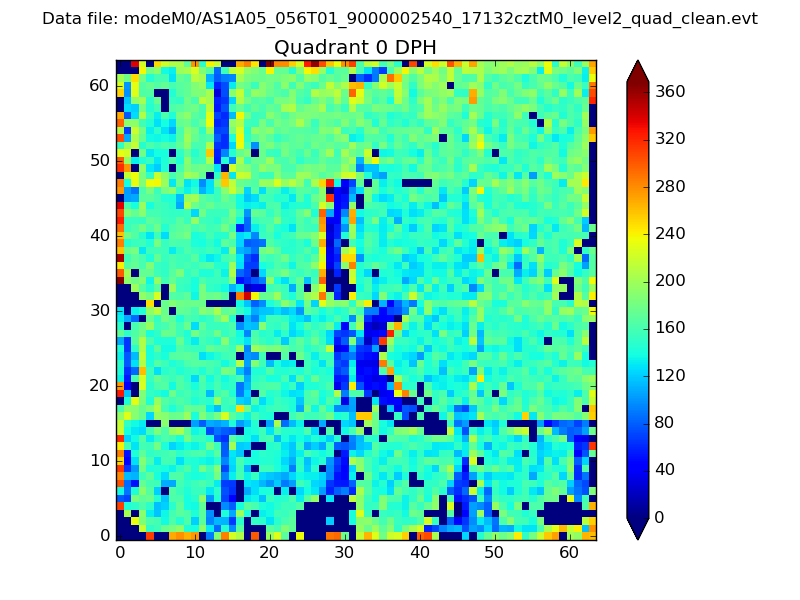 |
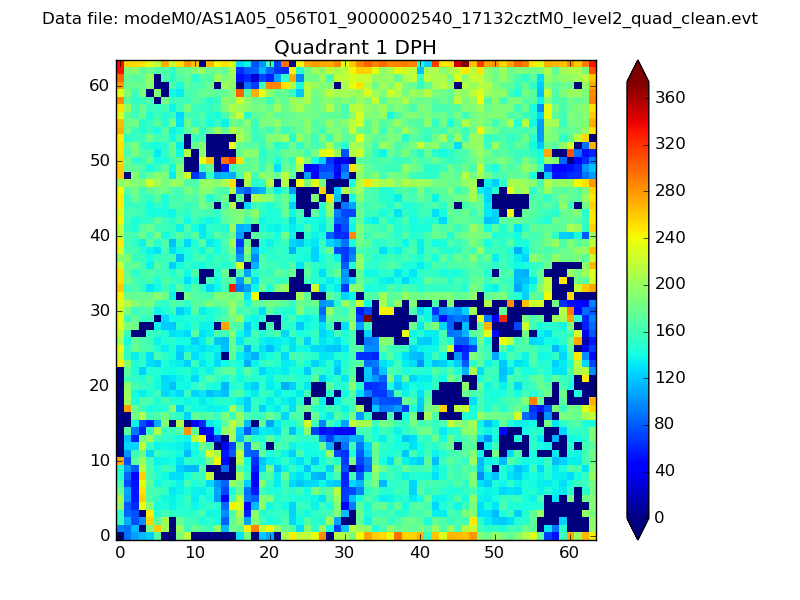 |
Quadrant B |
|---|---|---|---|
| Quadrant D | 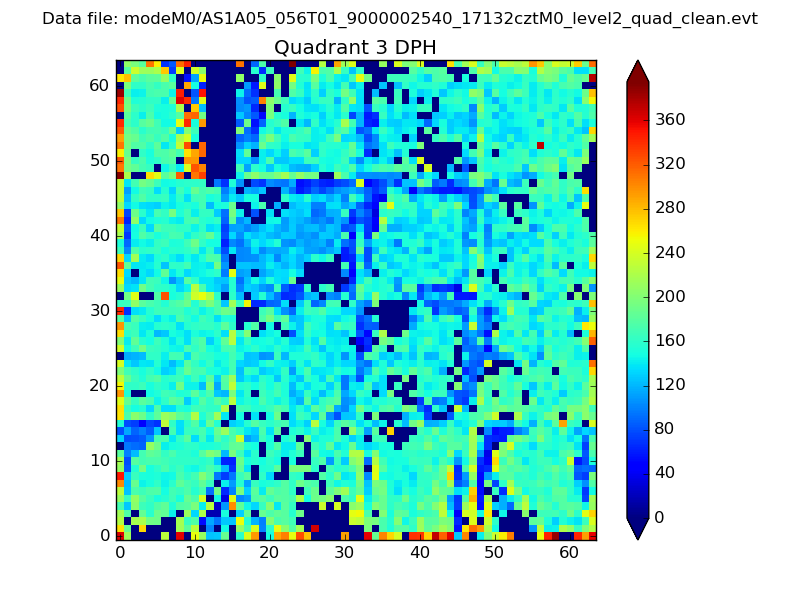 |
 |
Quadrant C |
| Plot type | Count rate plots | Images |
|---|---|---|
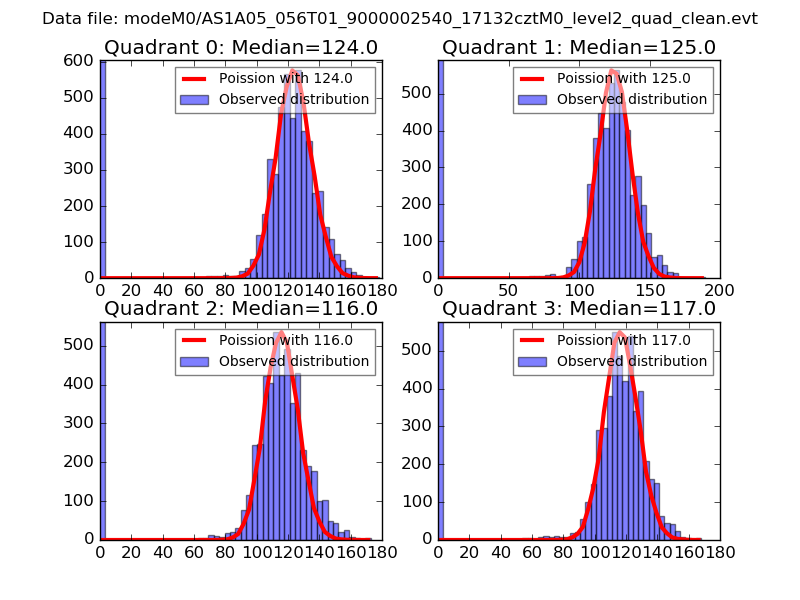
| Comparison with Poisson distribution Blue bars denote a histogram of data divided into 1 sec bins. Red curve is a Poisson curve with rate = median count rate of data. |
 |
 |
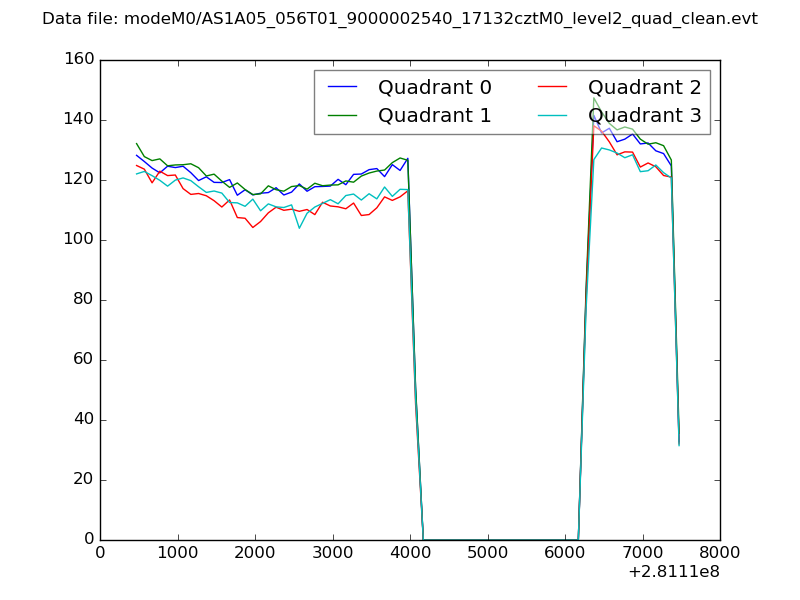
| Quadrant-wise count rates Data is divided into 100 sec bins |
 |
|
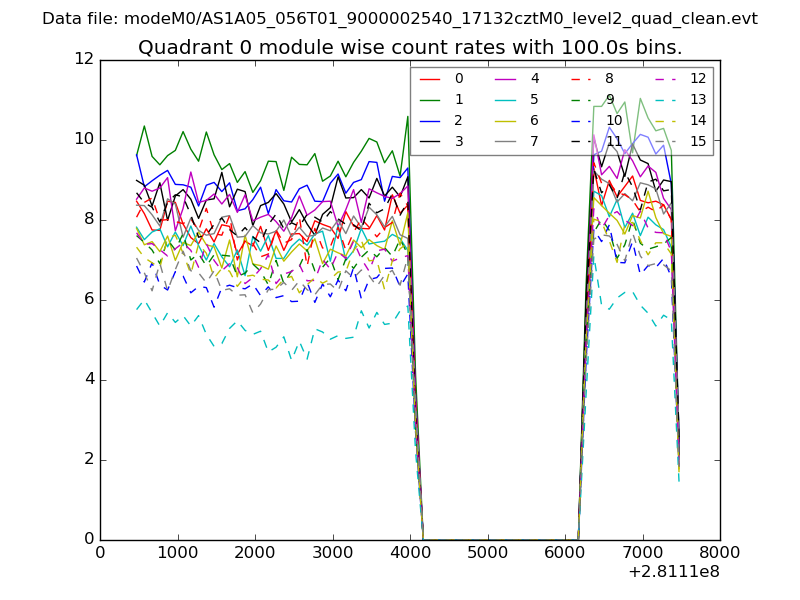
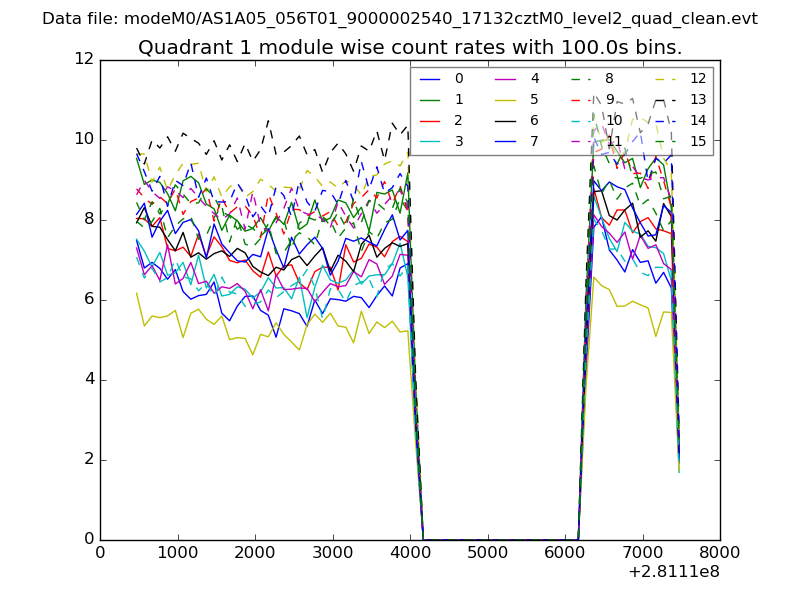
| Module-wise count rates for Quadrant A Data is divided into 100 sec bins |
 |
 |
| Module-wise count rates for Quadrant B Data is divided into 100 sec bins |
 |
 |
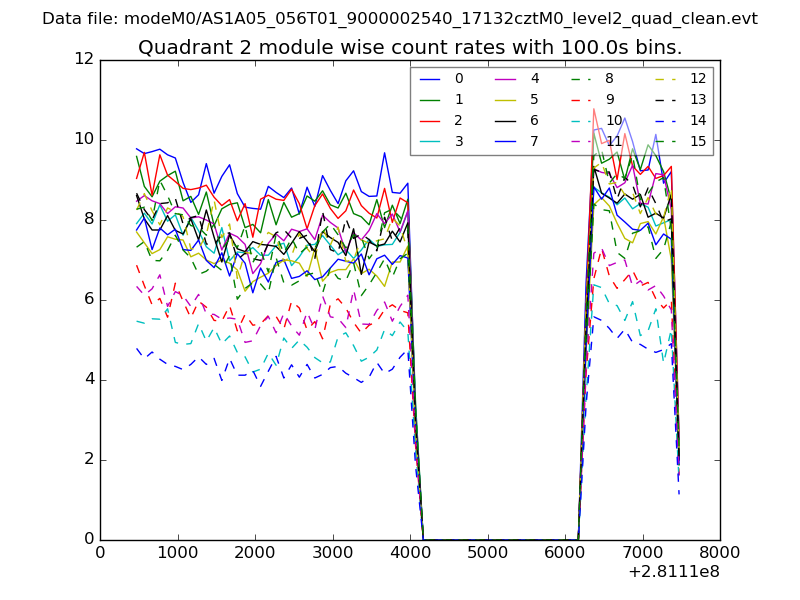
| Module-wise count rates for Quadrant C Data is divided into 100 sec bins |
 |
 |
| Module-wise count rates for Quadrant D Data is divided into 100 sec bins |
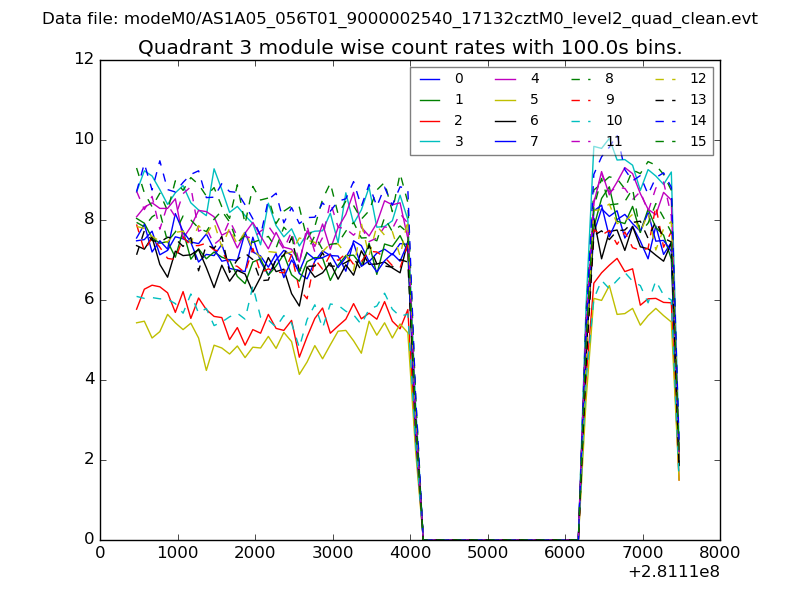 |
 |
| Parameter | Plot |
|---|---|
| CZT HV Monitor | 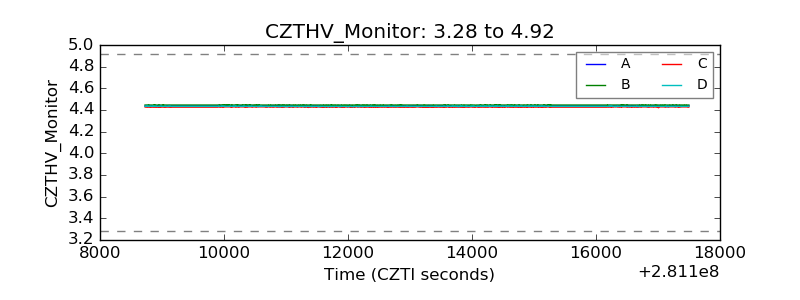 |
| D_VDD | 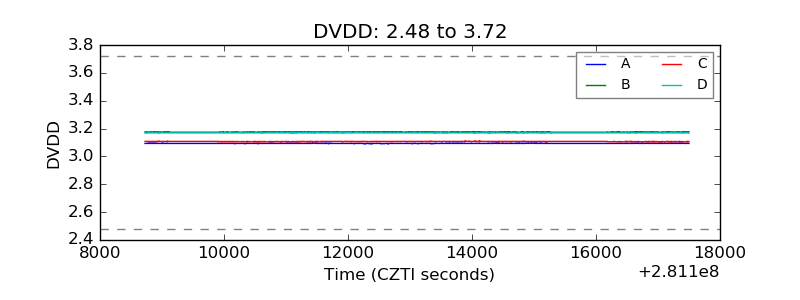 |
| Temperature 1 | 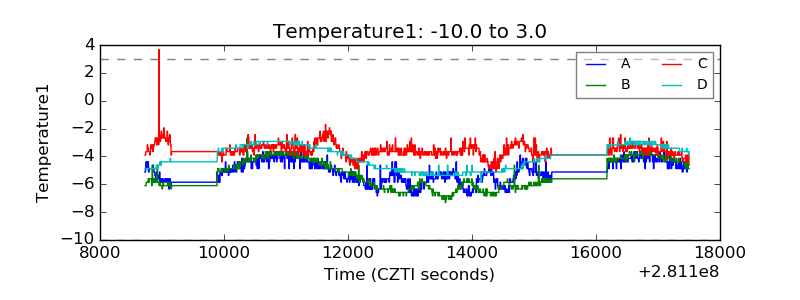 |
| Veto HV Monitor |  |
| Veto LLD | 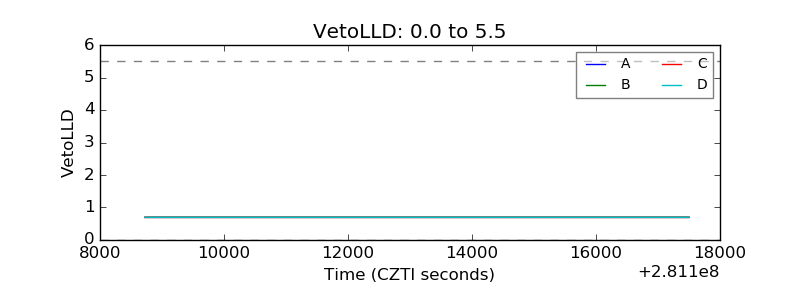 |
| Alpha Counter | 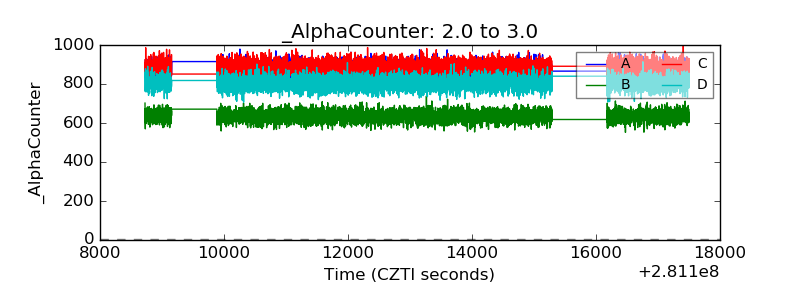 |
| _CPM_Rate | 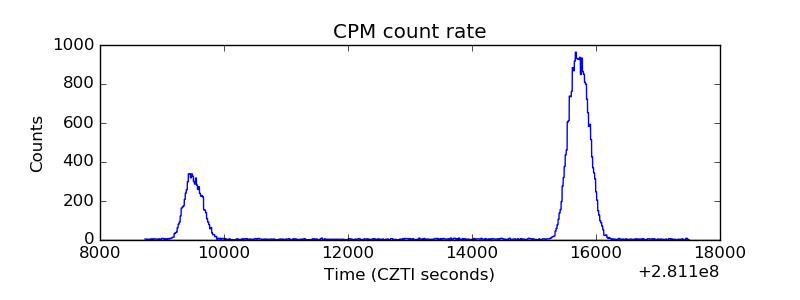 |
| CZT Counter | 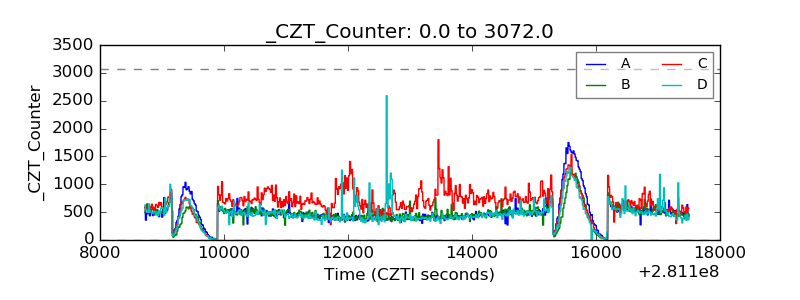 |
| +2.5 Volts monitor |  |
| +5 Volts monitor | 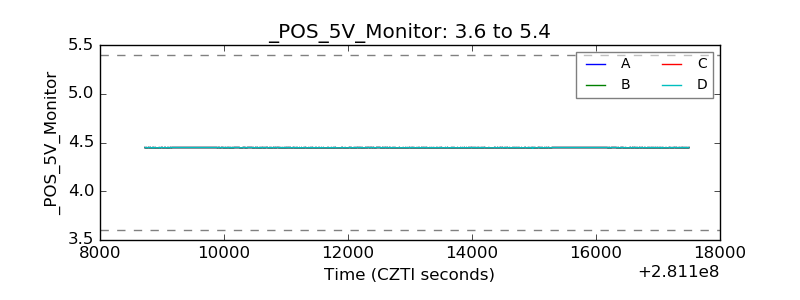 |
| _ROLL_ROT | 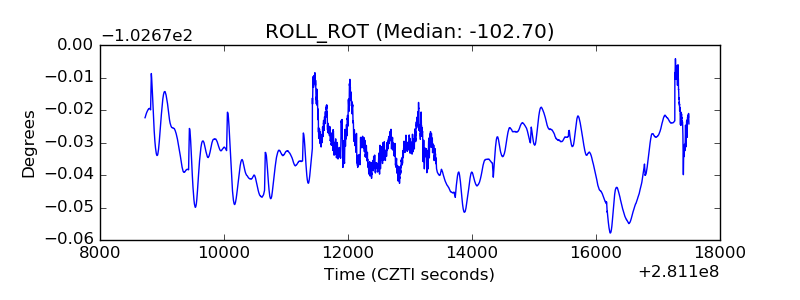 |
| _Roll_DEC | 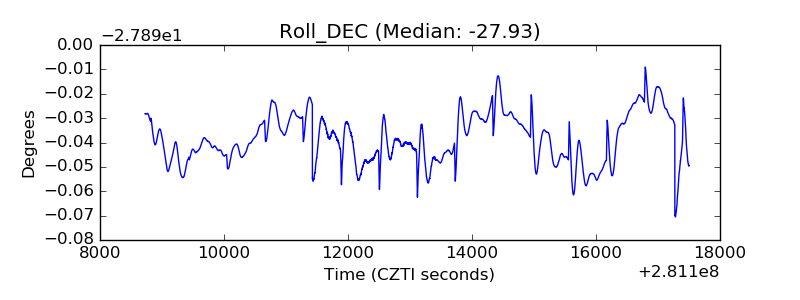 |
| _Roll_RA | 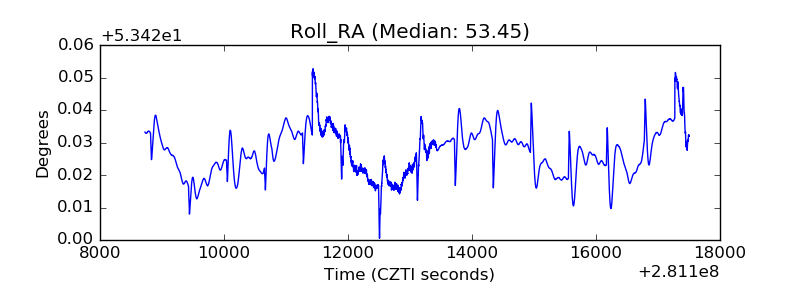 |
| Veto Counter | 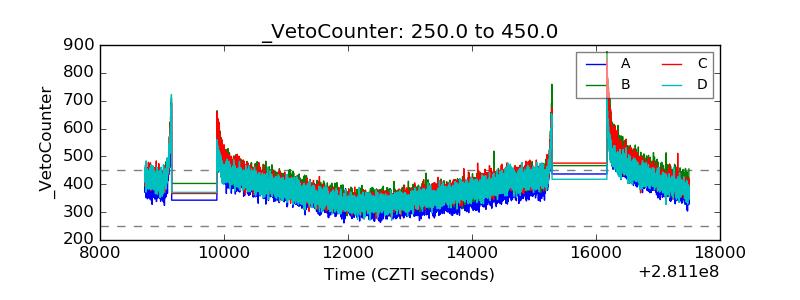 |