| Param | Original file | Final file |
|---|---|---|
| Filename | modeM0/AS1A05_056T01_9000002540_17133cztM0_level2.evt | modeM0/AS1A05_056T01_9000002540_17133cztM0_level2_quad_clean.evt |
| Size (bytes) | 478,964,160 | 98,861,760 |
| Size | 456.8 MB | 94.3 MB |
| Events in quadrant A | 3,064,857 | 652,914 |
| Events in quadrant B | 3,099,011 | 662,946 |
| Events in quadrant C | 4,959,702 | 608,232 |
| Events in quadrant D | 2,939,750 | 615,628 |
| Mode M0 | |||
|---|---|---|---|
| Quadrant | BADHDUFLAG | Total packets | Discarded packets |
| A | 0 | 13409 | 1 |
| B | 0 | 13465 | 1 |
| C | 0 | 19516 | 1 |
| D | 0 | 13406 | 1 |
| Mode M9 | |||
|---|---|---|---|
| Quadrant | BADHDUFLAG | Total packets | Discarded packets |
| A | 0 | 10 | 0 |
| B | 0 | 10 | 0 |
| C | 0 | 10 | 0 |
| D | 0 | 10 | 0 |
| Mode SS | |||
|---|---|---|---|
| Quadrant | BADHDUFLAG | Total packets | Discarded packets |
| A | 0 | 134 | 0 |
| B | 0 | 134 | 0 |
| C | 0 | 134 | 0 |
| D | 0 | 134 | 0 |
| Quadrant | Total seconds | Saturated seconds | Saturation percentage |
|---|---|---|---|
| A | 6506 | 36 | 0.553335% |
| B | 6507 | 54 | 0.829876% |
| C | 6507 | 137 | 2.105425% |
| D | 6507 | 20 | 0.307361% |
Noise dominated data is calculated using 1-second bins in cleaned event files. If a bin has >2000 counts, and if more than 50% of those come from <1% of pixels, then it is considered to be noise-dominated and hence unusable.
| Quadrant | # 1 sec bins | Bins with >0 counts | Bins with >2000 counts | High rate bins dominated by noise | Noise dominated (total time) | Noise dominated (detector-on time) | Marked lightcurve |
|---|---|---|---|---|---|---|---|
| A | 7546 | 6507 | 0 | 0 | 0.00% | 0.00% | 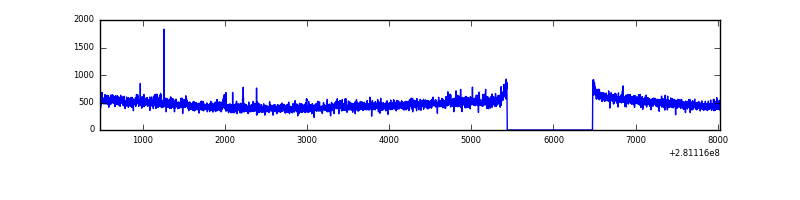 |
| B | 7547 | 6508 | 0 | 0 | 0.00% | 0.00% | 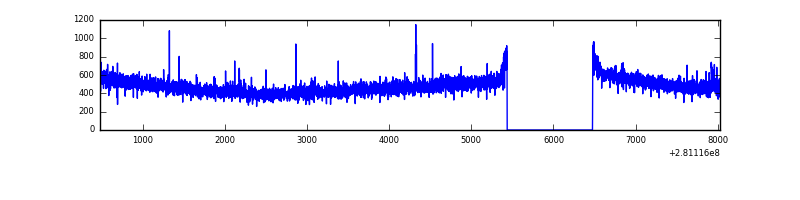 |
| C | 7547 | 6507 | 1 | 1 | 0.01% | 0.02% | 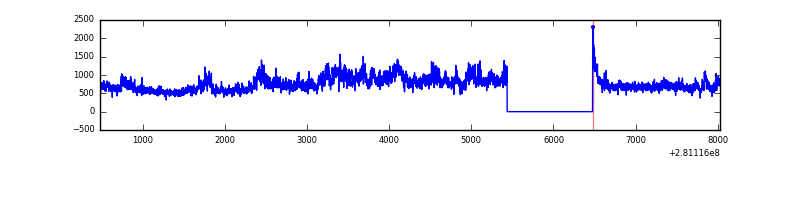 |
| D | 7547 | 6508 | 1 | 1 | 0.01% | 0.02% | 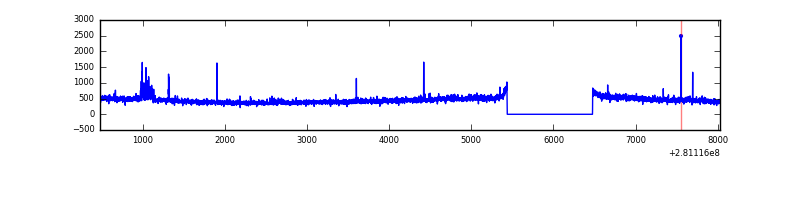 |
Top three noisy pixels from each quadrant. If the there are fewer than three noisy pixels in the level2.evt file, extra rows are filled as -1
| Pixel properties | Quadrant properties | ||||||
|---|---|---|---|---|---|---|---|
| Quadrant | DetID | PixID | Counts | Sigma | Mean | Median | Sigma |
| A | 12 | 189 | 39312 | 240.83 | 788 | 773 | 160.0 |
| A | 0 | 226 | 6892 | 38.24 | 788 | 773 | 160.0 |
| A | 3 | 137 | 6003 | 32.68 | 788 | 773 | 160.0 |
| B | 0 | 229 | 21979 | 137.22 | 787 | 766 | 154.6 |
| B | 12 | 111 | 18390 | 114.0 | 787 | 766 | 154.6 |
| B | 11 | 111 | 16099 | 99.18 | 787 | 766 | 154.6 |
| C | 3 | 233 | 1956989 | 11253.61 | 740 | 746 | 173.8 |
| C | 14 | 238 | 114831 | 656.29 | 740 | 746 | 173.8 |
| C | 13 | 61 | 5115 | 25.13 | 740 | 746 | 173.8 |
| D | 5 | 222 | 88759 | 481.5 | 752 | 729 | 182.8 |
| D | 2 | 234 | 24545 | 130.27 | 752 | 729 | 182.8 |
| D | 1 | 52 | 11686 | 59.93 | 752 | 729 | 182.8 |
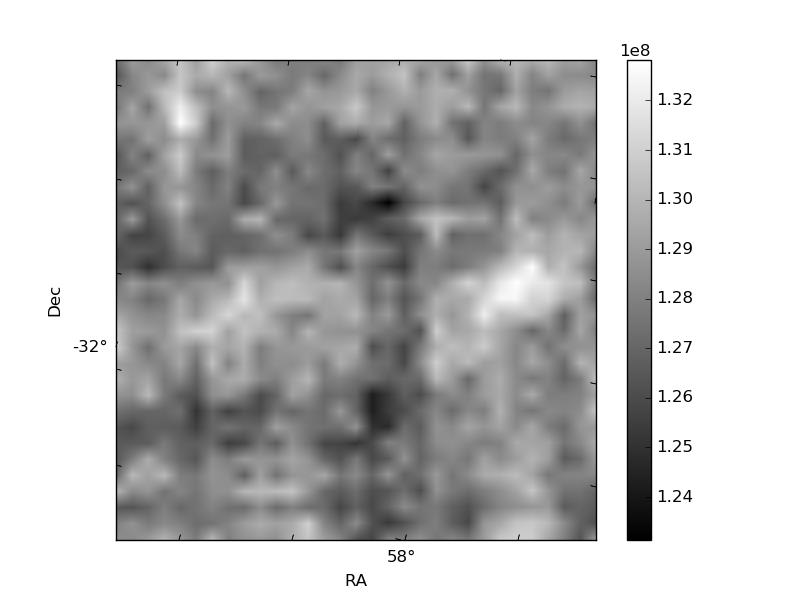
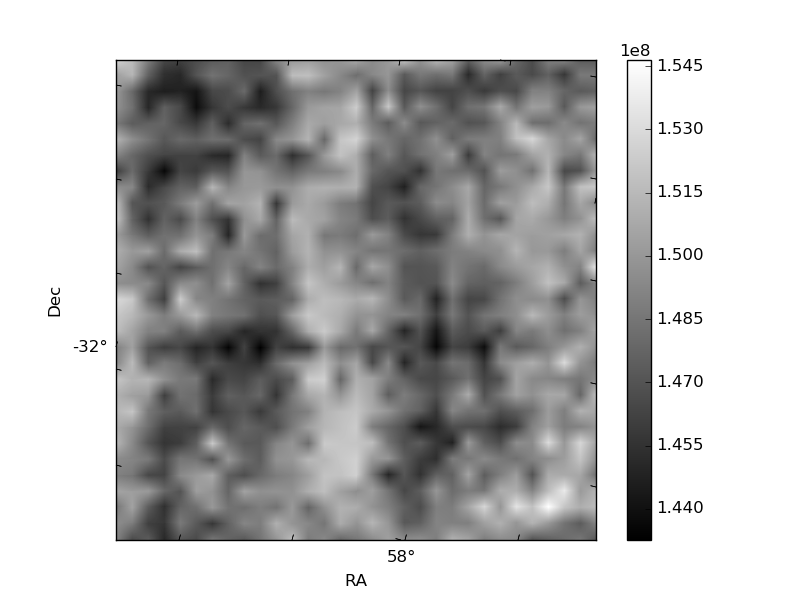
Histogram calculated using DETX and DETY for each event in the final _common_clean file
| Quadrant A |  |
 |
Quadrant B |
|---|---|---|---|
| Quadrant D |  |
 |
Quadrant C |
| Plot type | Count rate plots | Images |
|---|---|---|
| Comparison with Poisson distribution Blue bars denote a histogram of data divided into 1 sec bins. Red curve is a Poisson curve with rate = median count rate of data. |
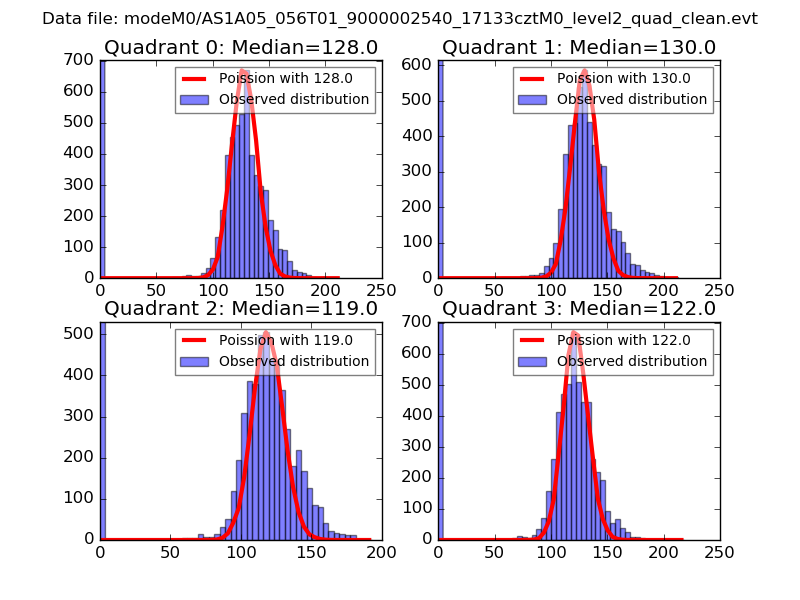 |
 |
| Quadrant-wise count rates Data is divided into 100 sec bins |
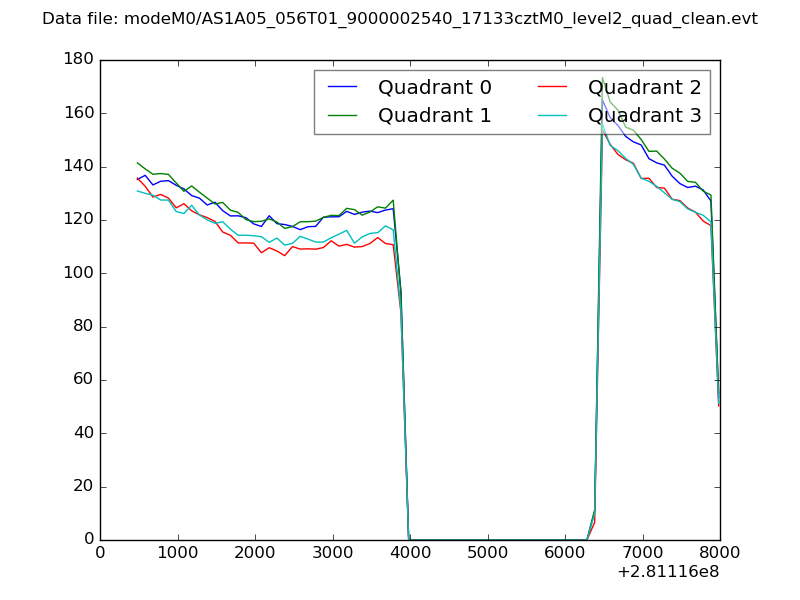 |
|
| Module-wise count rates for Quadrant A Data is divided into 100 sec bins |
 |
 |
| Module-wise count rates for Quadrant B Data is divided into 100 sec bins |
 |
 |
| Module-wise count rates for Quadrant C Data is divided into 100 sec bins |
 |
 |
| Module-wise count rates for Quadrant D Data is divided into 100 sec bins |
 |
 |
| Parameter | Plot |
|---|---|
| CZT HV Monitor |  |
| D_VDD | 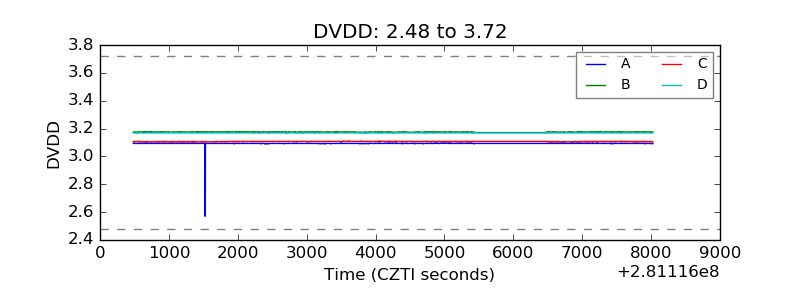 |
| Temperature 1 |  |
| Veto HV Monitor |  |
| Veto LLD |  |
| Alpha Counter | 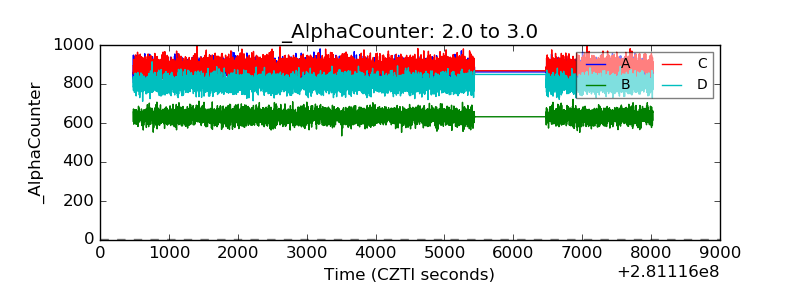 |
| _CPM_Rate | 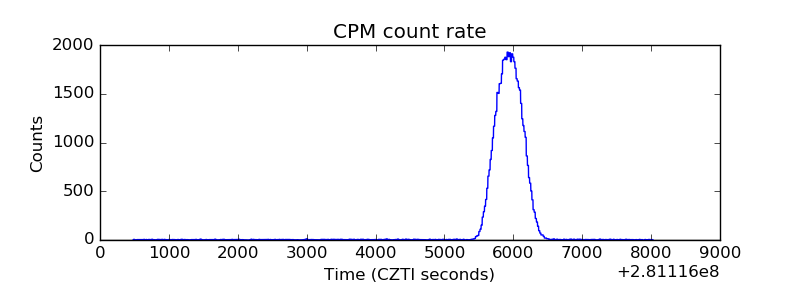 |
| CZT Counter |  |
| +2.5 Volts monitor |  |
| +5 Volts monitor |  |
| _ROLL_ROT |  |
| _Roll_DEC |  |
| _Roll_RA |  |
| Veto Counter |  |