| Param | Original file | Final file |
|---|---|---|
| Filename | modeM0/AS1A05_056T01_9000002540_17135cztM0_level2.evt | modeM0/AS1A05_056T01_9000002540_17135cztM0_level2_quad_clean.evt |
| Size (bytes) | 522,976,320 | 101,373,120 |
| Size | 498.7 MB | 96.7 MB |
| Events in quadrant A | 3,191,880 | 671,409 |
| Events in quadrant B | 3,267,107 | 688,070 |
| Events in quadrant C | 5,897,431 | 621,659 |
| Events in quadrant D | 3,033,354 | 627,422 |
| Mode M0 | |||
|---|---|---|---|
| Quadrant | BADHDUFLAG | Total packets | Discarded packets |
| A | 0 | 13827 | 2 |
| B | 0 | 13989 | 2 |
| C | 0 | 22533 | 2 |
| D | 0 | 13660 | 2 |
| Mode M9 | |||
|---|---|---|---|
| Quadrant | BADHDUFLAG | Total packets | Discarded packets |
| A | 0 | 12 | 0 |
| B | 0 | 13 | 0 |
| C | 0 | 13 | 0 |
| D | 0 | 13 | 0 |
| Mode SS | |||
|---|---|---|---|
| Quadrant | BADHDUFLAG | Total packets | Discarded packets |
| A | 0 | 134 | 0 |
| B | 0 | 134 | 0 |
| C | 0 | 134 | 0 |
| D | 0 | 134 | 0 |
| Quadrant | Total seconds | Saturated seconds | Saturation percentage |
|---|---|---|---|
| A | 6620 | 30 | 0.453172% |
| B | 6620 | 36 | 0.543807% |
| C | 6620 | 259 | 3.912387% |
| D | 6620 | 12 | 0.181269% |
Noise dominated data is calculated using 1-second bins in cleaned event files. If a bin has >2000 counts, and if more than 50% of those come from <1% of pixels, then it is considered to be noise-dominated and hence unusable.
| Quadrant | # 1 sec bins | Bins with >0 counts | Bins with >2000 counts | High rate bins dominated by noise | Noise dominated (total time) | Noise dominated (detector-on time) | Marked lightcurve |
|---|---|---|---|---|---|---|---|
| A | 7810 | 6621 | 0 | 0 | 0.00% | 0.00% | 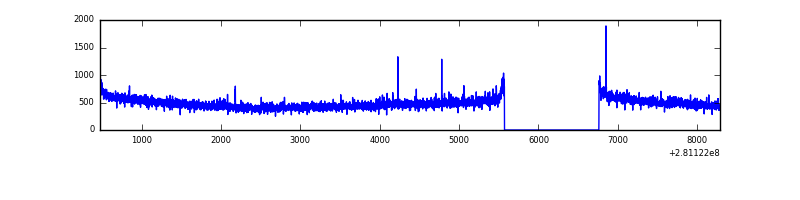 |
| B | 7810 | 6621 | 1 | 1 | 0.01% | 0.02% | 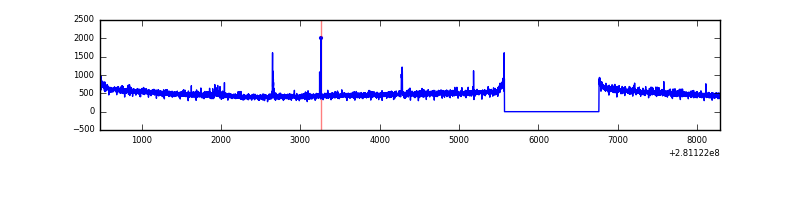 |
| C | 7810 | 6621 | 40 | 40 | 0.51% | 0.60% | 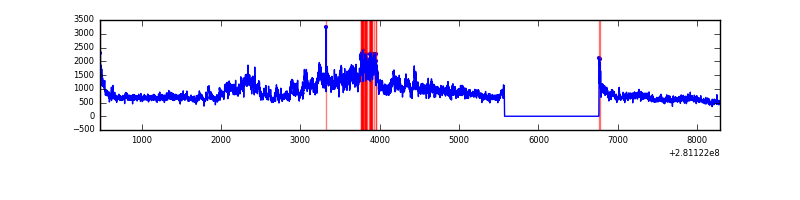 |
| D | 7810 | 6621 | 2 | 2 | 0.03% | 0.03% | 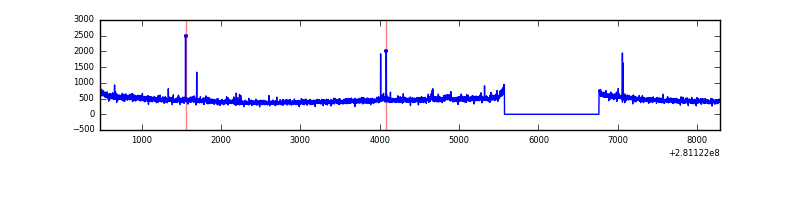 |
Top three noisy pixels from each quadrant. If the there are fewer than three noisy pixels in the level2.evt file, extra rows are filled as -1
| Pixel properties | Quadrant properties | ||||||
|---|---|---|---|---|---|---|---|
| Quadrant | DetID | PixID | Counts | Sigma | Mean | Median | Sigma |
| A | 12 | 189 | 32246 | 189.14 | 823 | 806 | 166.2 |
| A | 0 | 226 | 7189 | 38.4 | 823 | 806 | 166.2 |
| A | 3 | 137 | 6158 | 32.2 | 823 | 806 | 166.2 |
| B | 0 | 229 | 23049 | 139.84 | 826 | 806 | 159.1 |
| B | 12 | 111 | 18918 | 113.87 | 826 | 806 | 159.1 |
| B | 11 | 111 | 16275 | 97.25 | 826 | 806 | 159.1 |
| C | 3 | 233 | 2721854 | 15177.18 | 771 | 776 | 179.3 |
| C | 14 | 238 | 120008 | 665.03 | 771 | 776 | 179.3 |
| C | 5 | 112 | 44899 | 246.1 | 771 | 776 | 179.3 |
| D | 5 | 222 | 69908 | 364.31 | 785 | 764 | 189.8 |
| D | 2 | 234 | 23876 | 121.77 | 785 | 764 | 189.8 |
| D | 14 | 226 | 7795 | 37.05 | 785 | 764 | 189.8 |
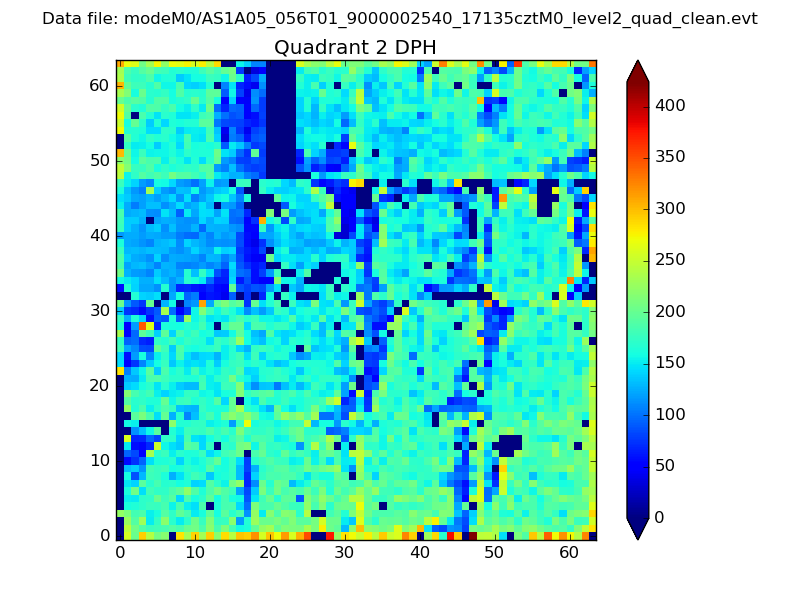
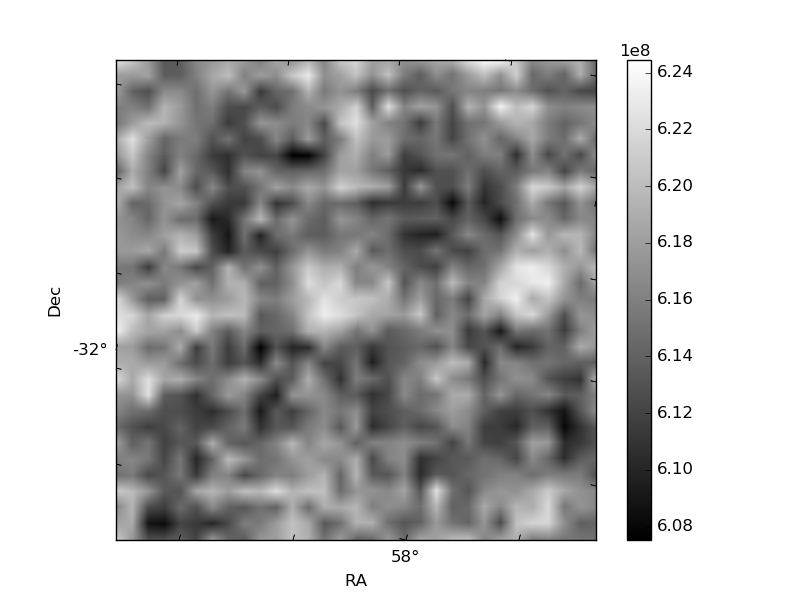
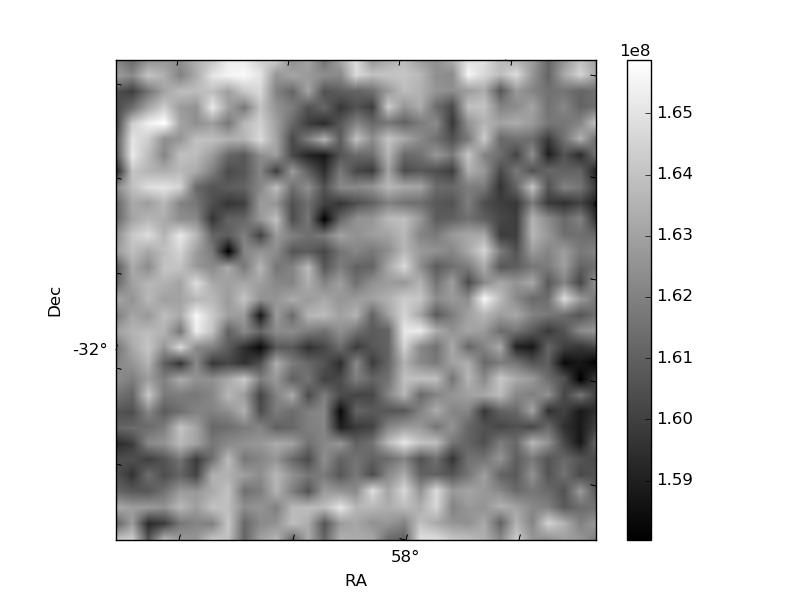
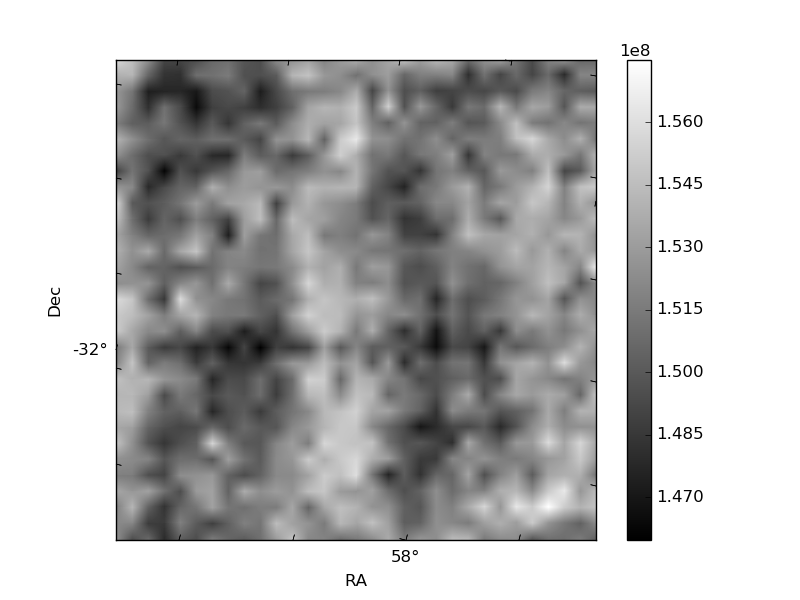
Histogram calculated using DETX and DETY for each event in the final _common_clean file
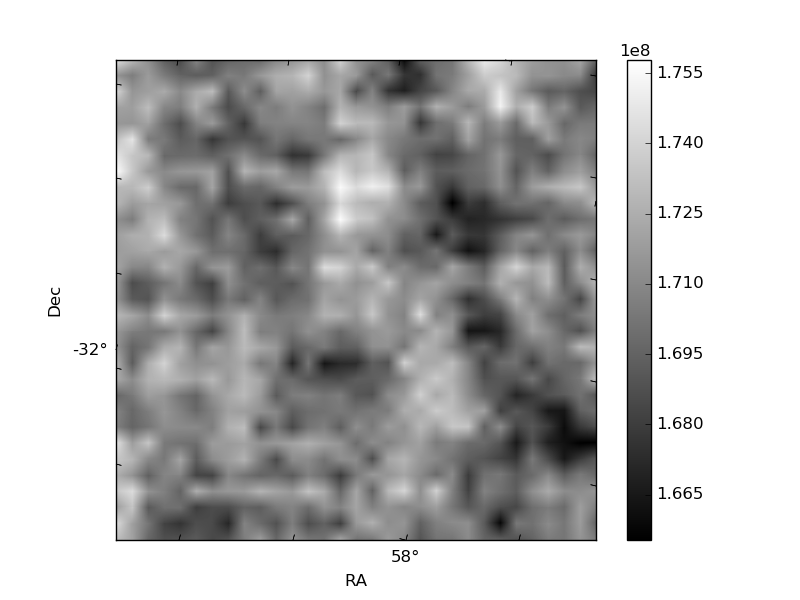
| Quadrant A | 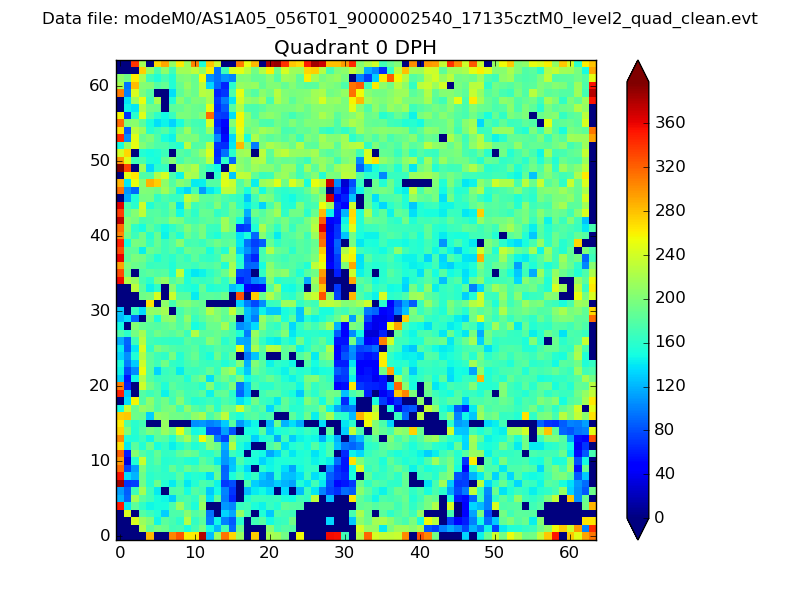 |
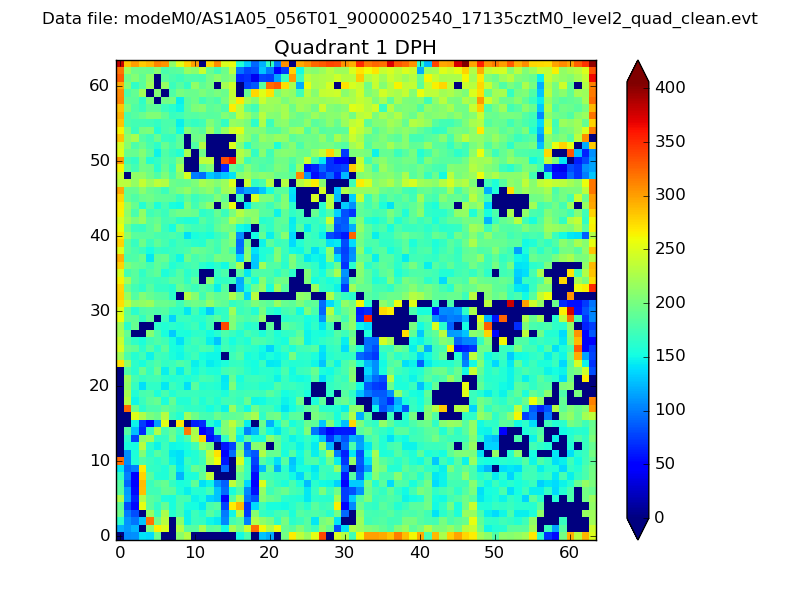 |
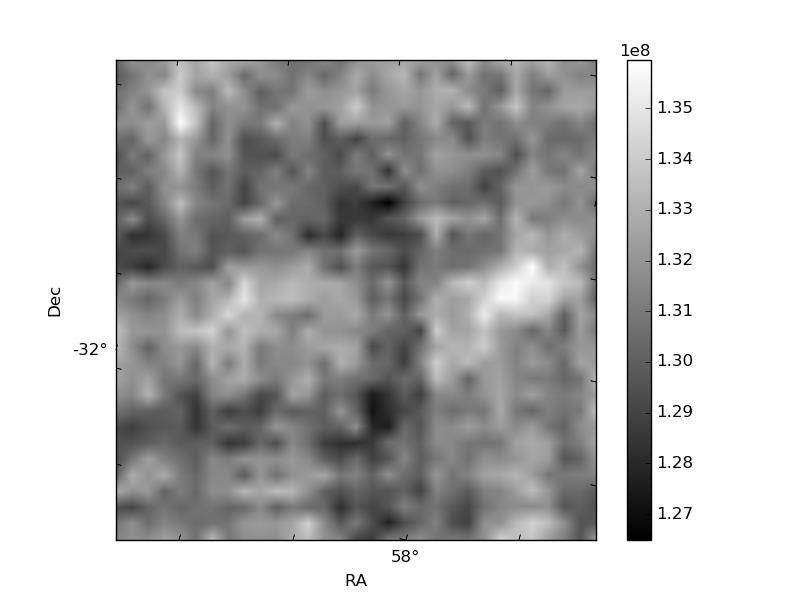
Quadrant B |
|---|---|---|---|
| Quadrant D | 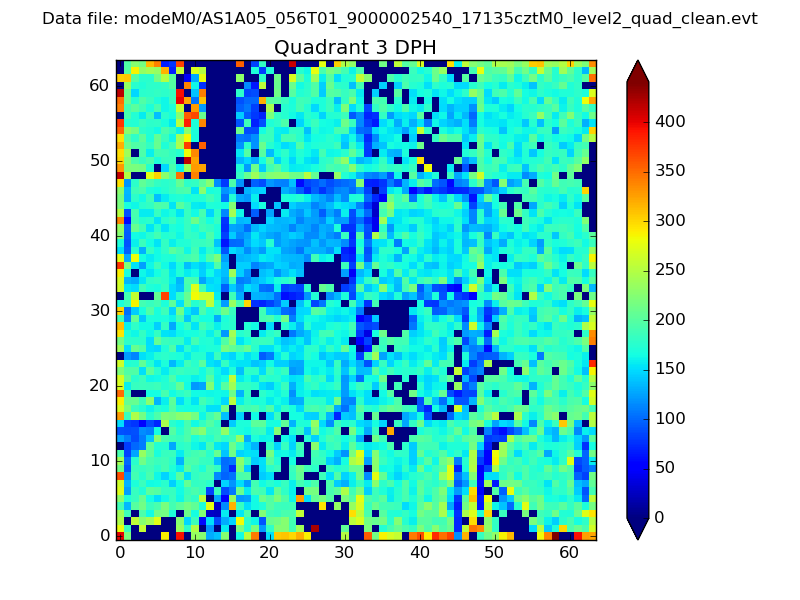 |
 |
Quadrant C |
| Plot type | Count rate plots | Images |
|---|---|---|
| Comparison with Poisson distribution Blue bars denote a histogram of data divided into 1 sec bins. Red curve is a Poisson curve with rate = median count rate of data. |
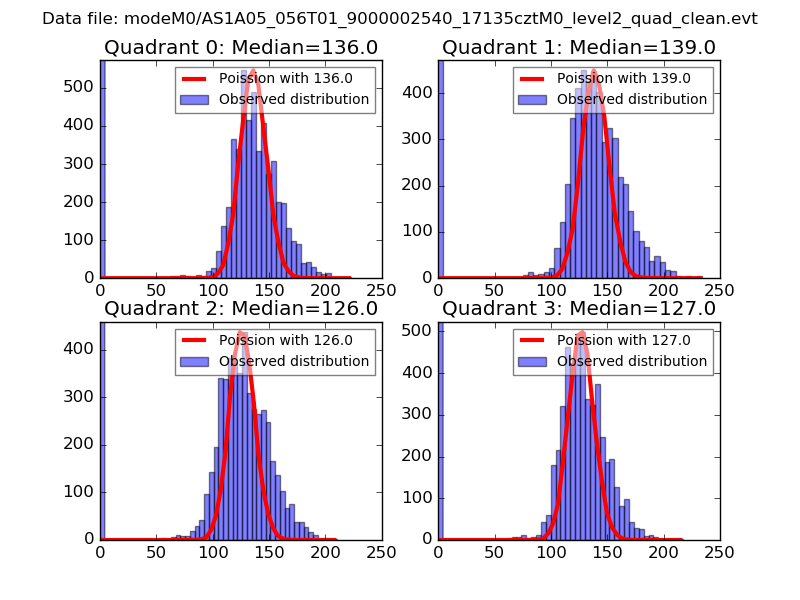 |
 |
| Quadrant-wise count rates Data is divided into 100 sec bins |
 |
|
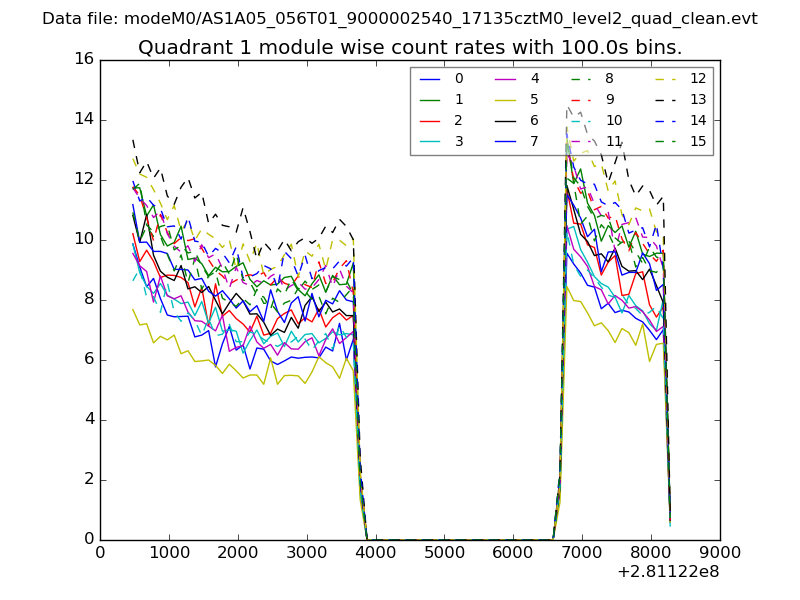
| Module-wise count rates for Quadrant A Data is divided into 100 sec bins |
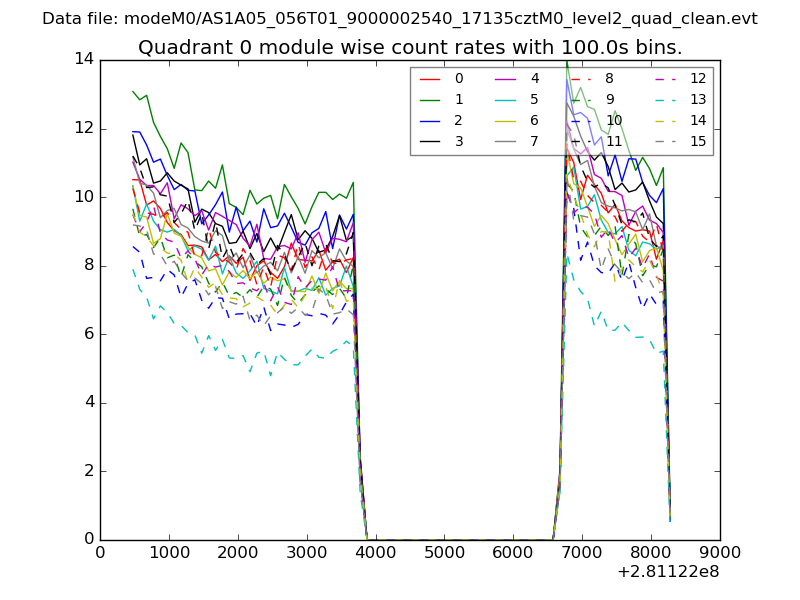 |
 |
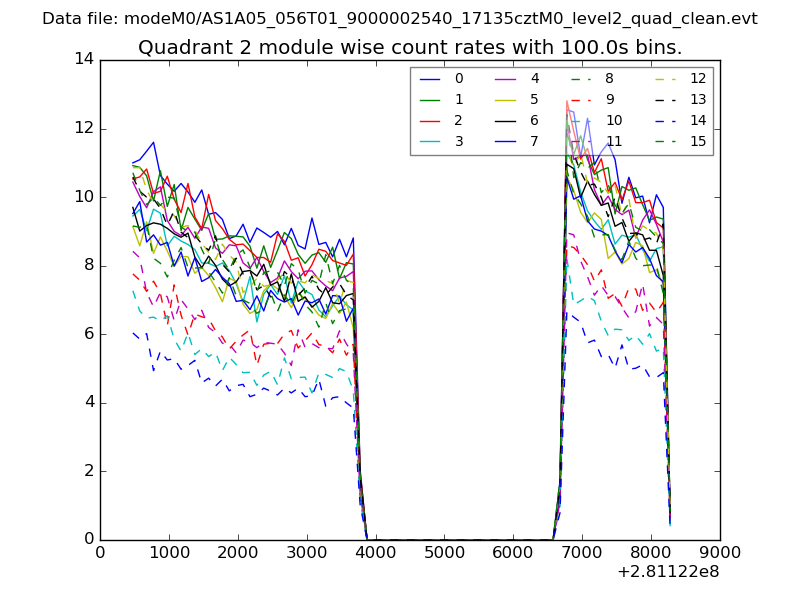
| Module-wise count rates for Quadrant B Data is divided into 100 sec bins |
 |
 |
| Module-wise count rates for Quadrant C Data is divided into 100 sec bins |
 |
 |
| Module-wise count rates for Quadrant D Data is divided into 100 sec bins |
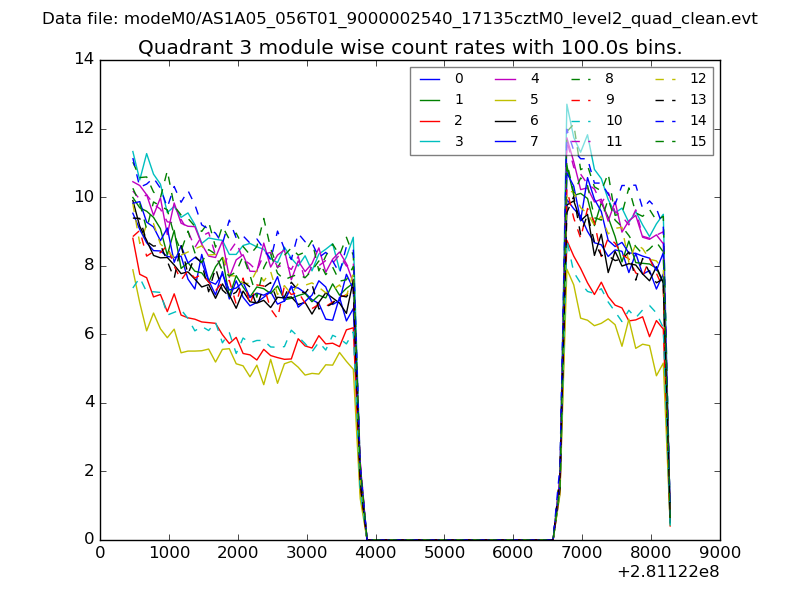 |
 |
| Parameter | Plot |
|---|---|
| CZT HV Monitor | 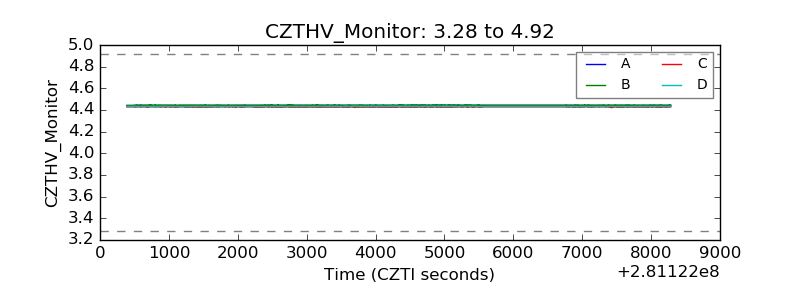 |
| D_VDD | 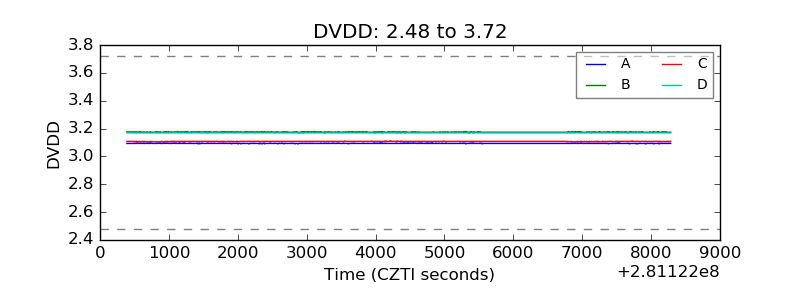 |
| Temperature 1 | 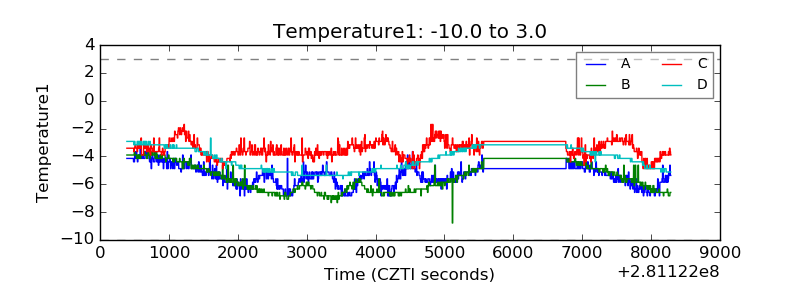 |
| Veto HV Monitor | 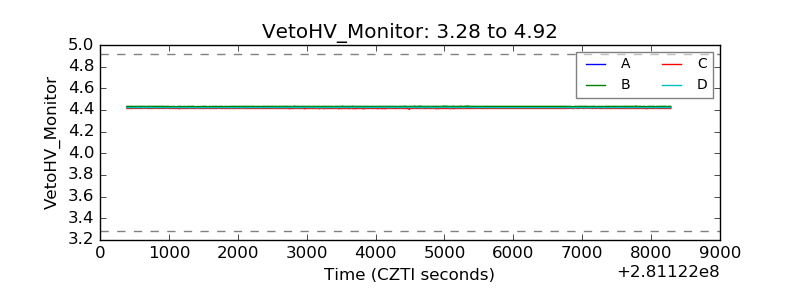 |
| Veto LLD |  |
| Alpha Counter |  |
| _CPM_Rate | 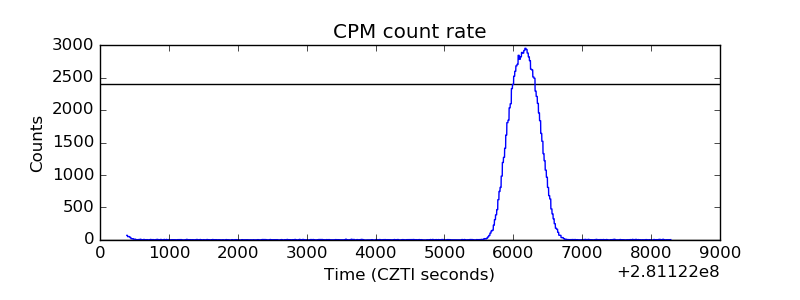 |
| CZT Counter | 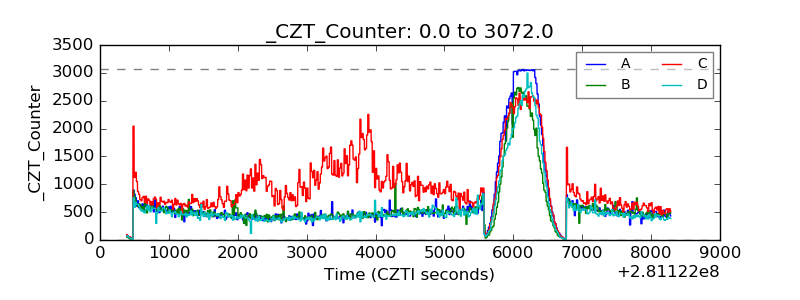 |
| +2.5 Volts monitor | 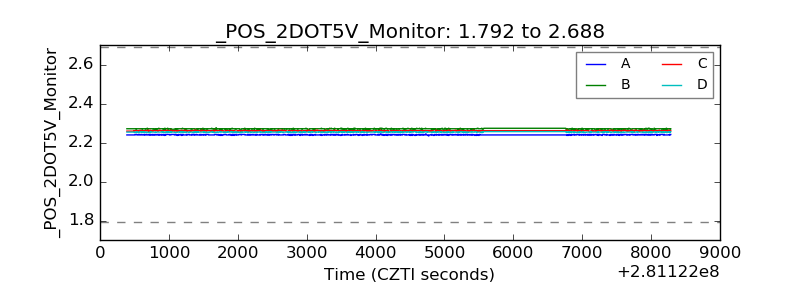 |
| +5 Volts monitor |  |
| _ROLL_ROT | 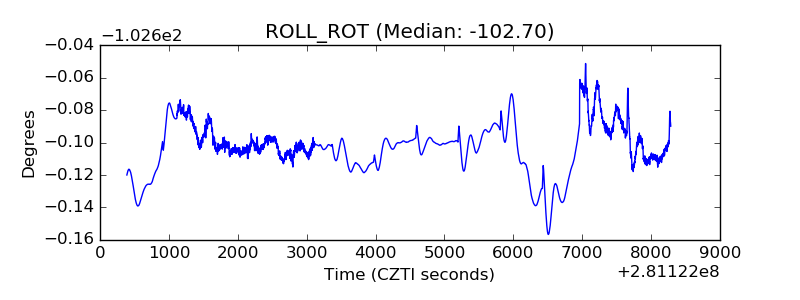 |
| _Roll_DEC | 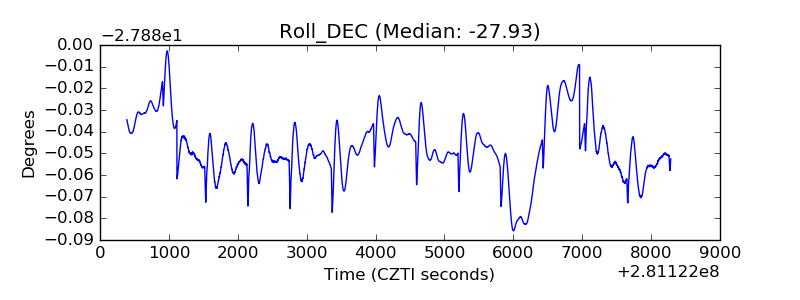 |
| _Roll_RA | 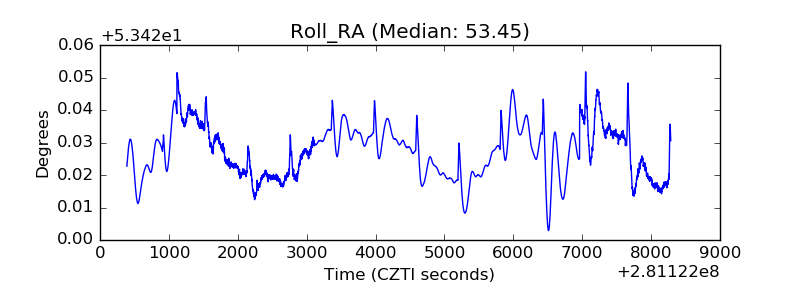 |
| Veto Counter | 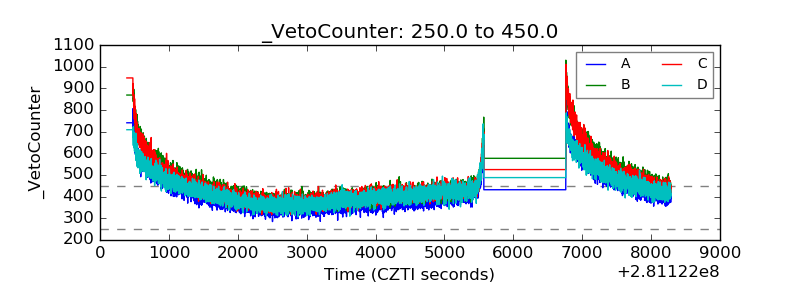 |