| Param | Original file | Final file |
|---|---|---|
| Filename | modeM0/AS1A05_056T01_9000002540_17137cztM0_level2.evt | modeM0/AS1A05_056T01_9000002540_17137cztM0_level2_quad_clean.evt |
| Size (bytes) | 586,252,800 | 95,109,120 |
| Size | 559.1 MB | 90.7 MB |
| Events in quadrant A | 3,144,085 | 624,252 |
| Events in quadrant B | 3,216,498 | 650,960 |
| Events in quadrant C | 7,234,928 | 581,694 |
| Events in quadrant D | 3,732,331 | 582,878 |
| Mode M0 | |||
|---|---|---|---|
| Quadrant | BADHDUFLAG | Total packets | Discarded packets |
| A | 0 | 13207 | 2 |
| B | 0 | 13405 | 2 |
| C | 0 | 26019 | 2 |
| D | 0 | 15235 | 2 |
| Mode M9 | |||
|---|---|---|---|
| Quadrant | BADHDUFLAG | Total packets | Discarded packets |
| A | 0 | 23 | 0 |
| B | 0 | 24 | 0 |
| C | 0 | 24 | 0 |
| D | 0 | 24 | 0 |
| Mode SS | |||
|---|---|---|---|
| Quadrant | BADHDUFLAG | Total packets | Discarded packets |
| A | 0 | 128 | 0 |
| B | 0 | 128 | 0 |
| C | 0 | 128 | 0 |
| D | 0 | 128 | 0 |
| Quadrant | Total seconds | Saturated seconds | Saturation percentage |
|---|---|---|---|
| A | 6313 | 47 | 0.744495% |
| B | 6313 | 60 | 0.950420% |
| C | 6313 | 510 | 8.078568% |
| D | 6313 | 100 | 1.584033% |
Noise dominated data is calculated using 1-second bins in cleaned event files. If a bin has >2000 counts, and if more than 50% of those come from <1% of pixels, then it is considered to be noise-dominated and hence unusable.
| Quadrant | # 1 sec bins | Bins with >0 counts | Bins with >2000 counts | High rate bins dominated by noise | Noise dominated (total time) | Noise dominated (detector-on time) | Marked lightcurve |
|---|---|---|---|---|---|---|---|
| A | 7658 | 6314 | 0 | 0 | 0.00% | 0.00% |  |
| B | 7658 | 6314 | 0 | 0 | 0.00% | 0.00% | 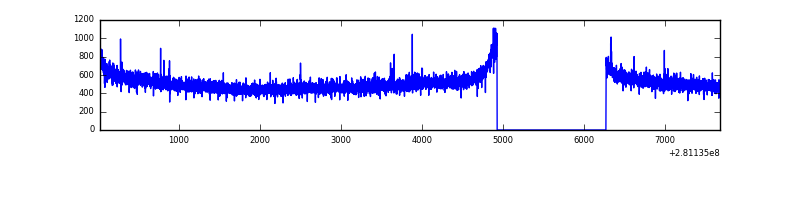 |
| C | 7658 | 6313 | 10 | 10 | 0.13% | 0.16% | 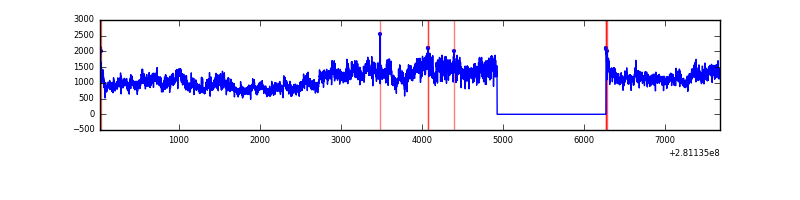 |
| D | 7658 | 6314 | 85 | 85 | 1.11% | 1.35% | 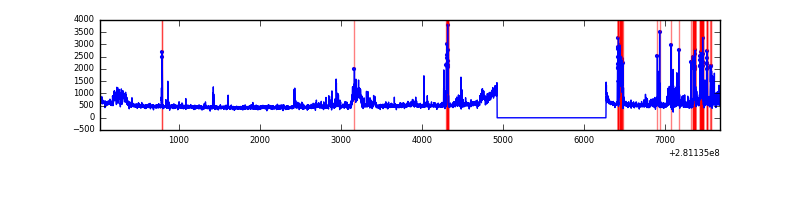 |
Top three noisy pixels from each quadrant. If the there are fewer than three noisy pixels in the level2.evt file, extra rows are filled as -1
| Pixel properties | Quadrant properties | ||||||
|---|---|---|---|---|---|---|---|
| Quadrant | DetID | PixID | Counts | Sigma | Mean | Median | Sigma |
| A | 12 | 189 | 25324 | 150.25 | 811 | 798 | 163.2 |
| A | 0 | 226 | 7113 | 38.69 | 811 | 798 | 163.2 |
| A | 3 | 137 | 5641 | 29.67 | 811 | 798 | 163.2 |
| B | 12 | 111 | 18519 | 113.78 | 822 | 802 | 155.7 |
| B | 11 | 111 | 15844 | 96.6 | 822 | 802 | 155.7 |
| B | 14 | 111 | 14140 | 85.66 | 822 | 802 | 155.7 |
| C | 3 | 233 | 4072180 | 22762.27 | 771 | 779 | 178.9 |
| C | 14 | 238 | 117162 | 650.67 | 771 | 779 | 178.9 |
| C | 7 | 247 | 29482 | 160.47 | 771 | 779 | 178.9 |
| D | 5 | 222 | 599588 | 3145.59 | 785 | 764 | 190.4 |
| D | 13 | 249 | 158927 | 830.82 | 785 | 764 | 190.4 |
| D | 2 | 234 | 19924 | 100.65 | 785 | 764 | 190.4 |
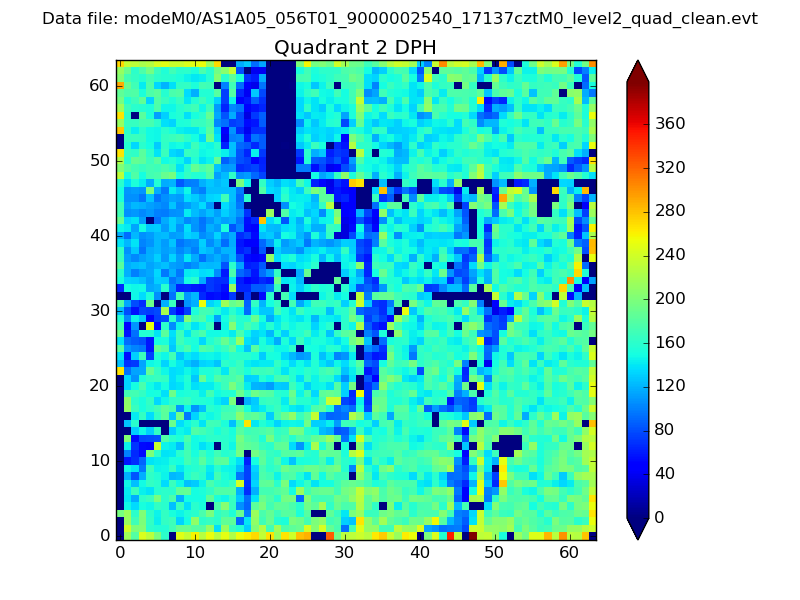
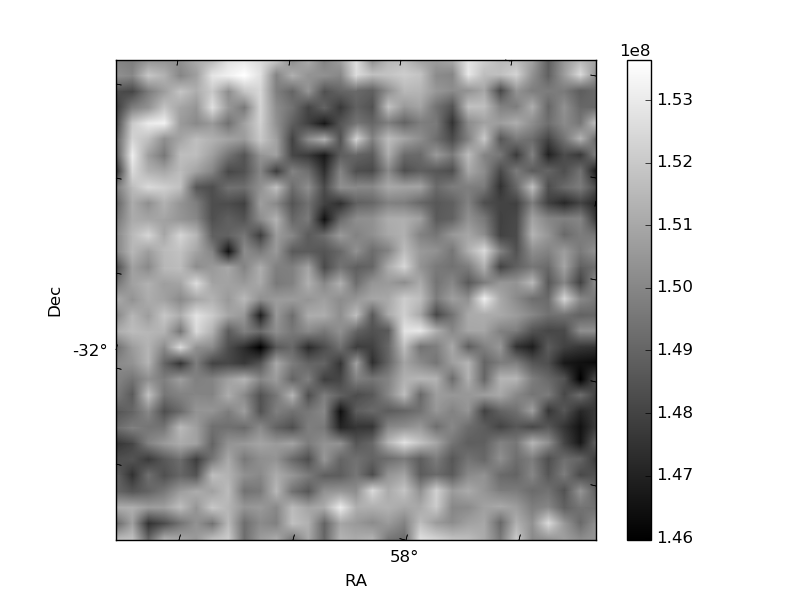
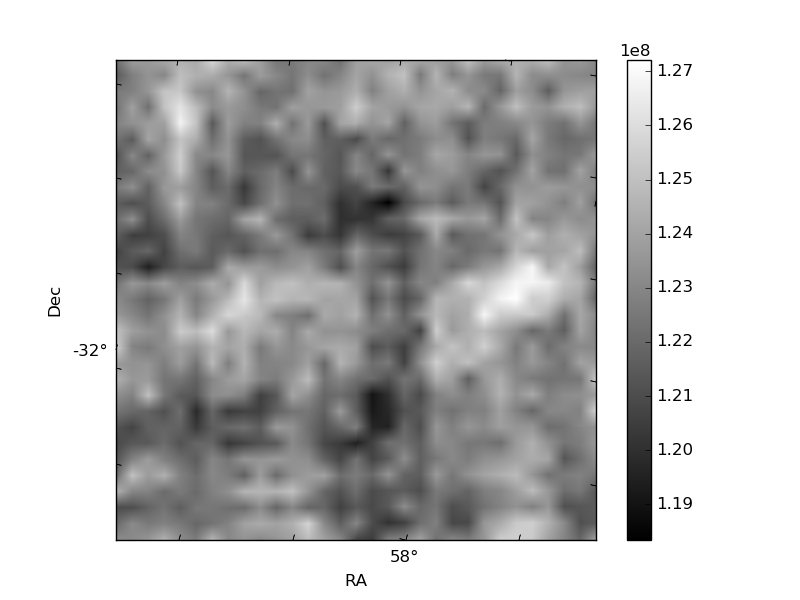
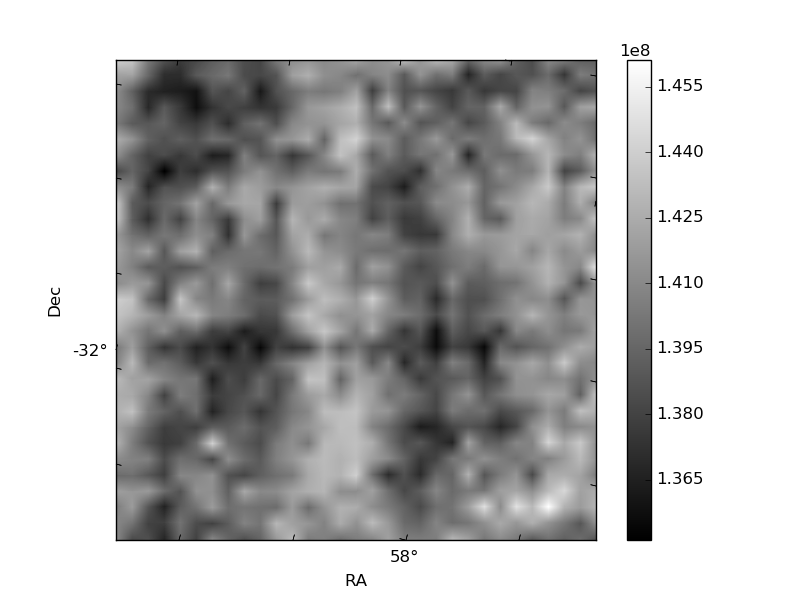
Histogram calculated using DETX and DETY for each event in the final _common_clean file
| Quadrant A | 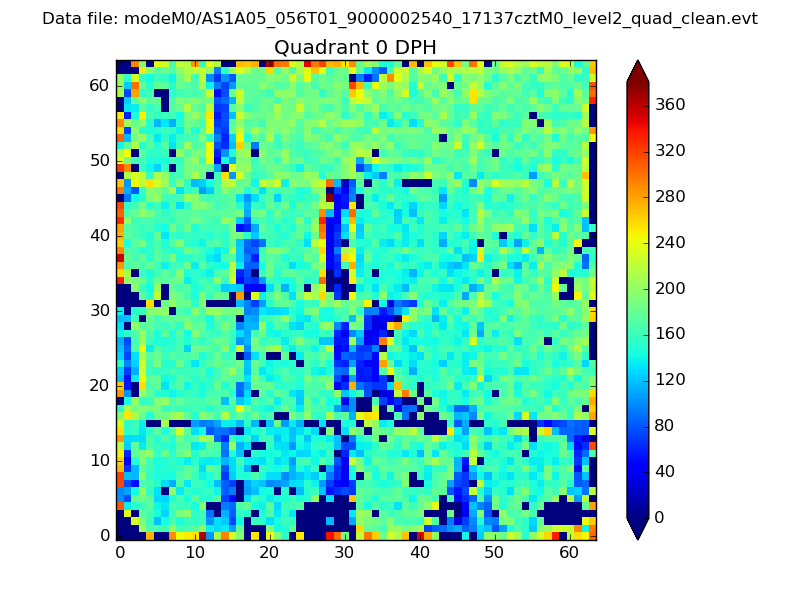 |
 |
Quadrant B |
|---|---|---|---|
| Quadrant D | 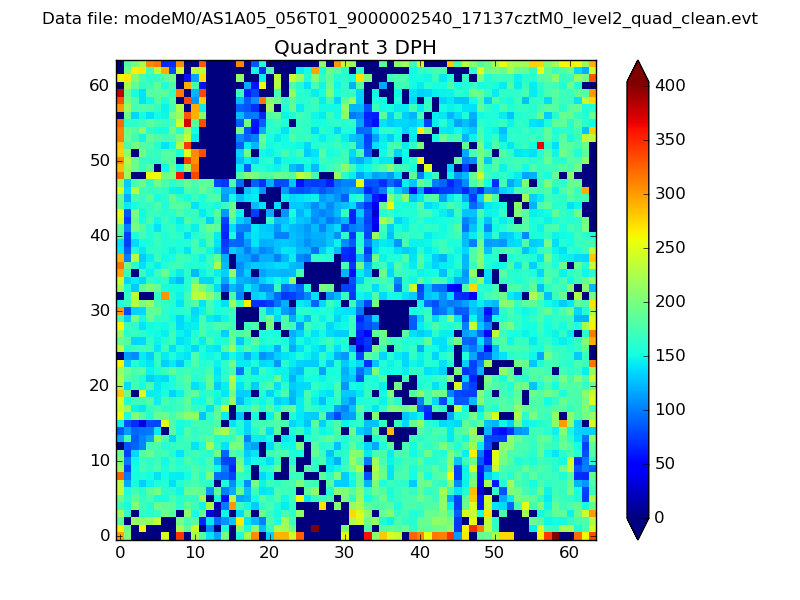 |
 |
Quadrant C |
| Plot type | Count rate plots | Images |
|---|---|---|
| Comparison with Poisson distribution Blue bars denote a histogram of data divided into 1 sec bins. Red curve is a Poisson curve with rate = median count rate of data. |
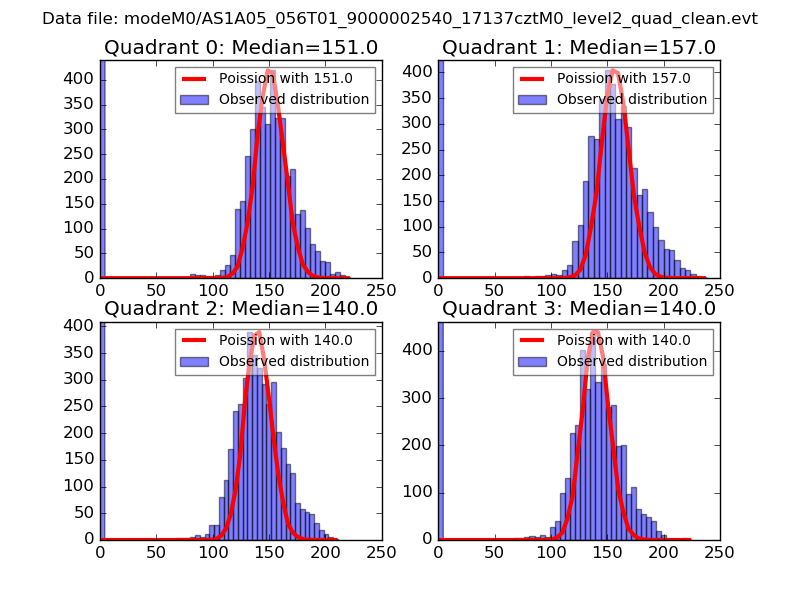 |
 |
| Quadrant-wise count rates Data is divided into 100 sec bins |
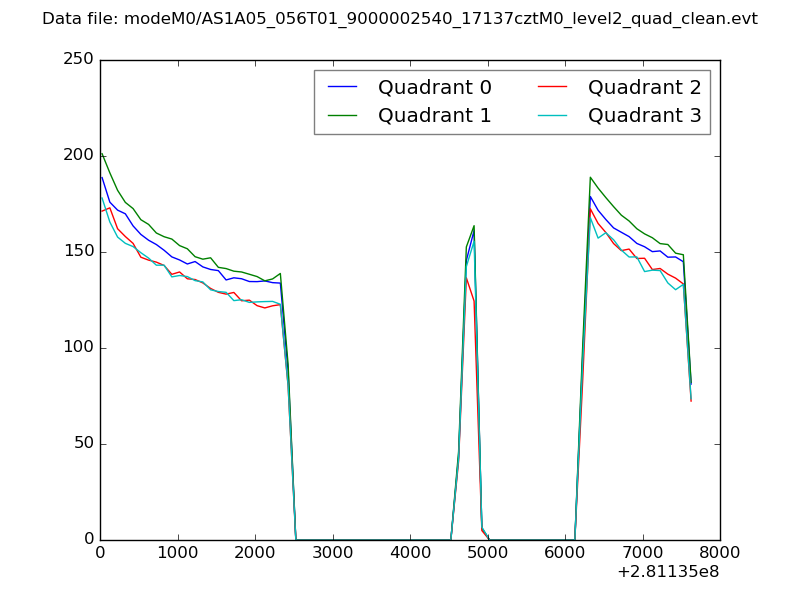 |
|
| Module-wise count rates for Quadrant A Data is divided into 100 sec bins |
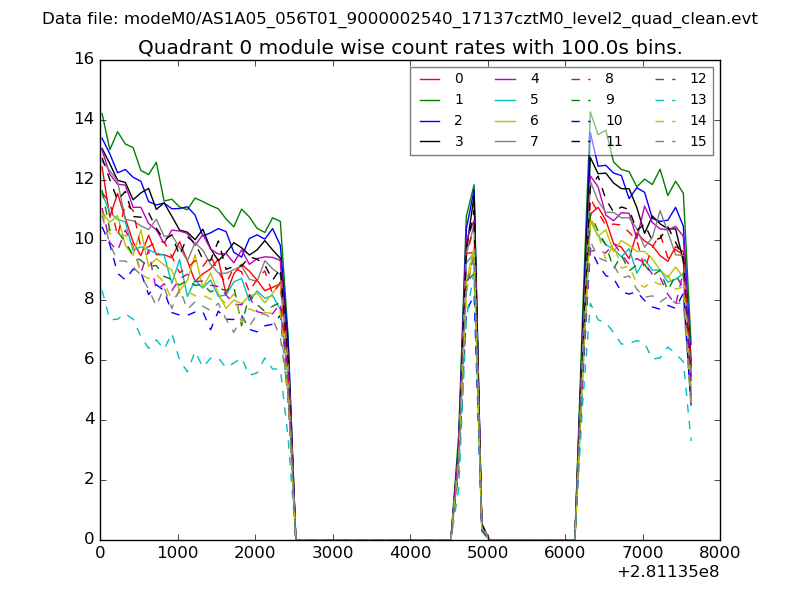 |
 |
| Module-wise count rates for Quadrant B Data is divided into 100 sec bins |
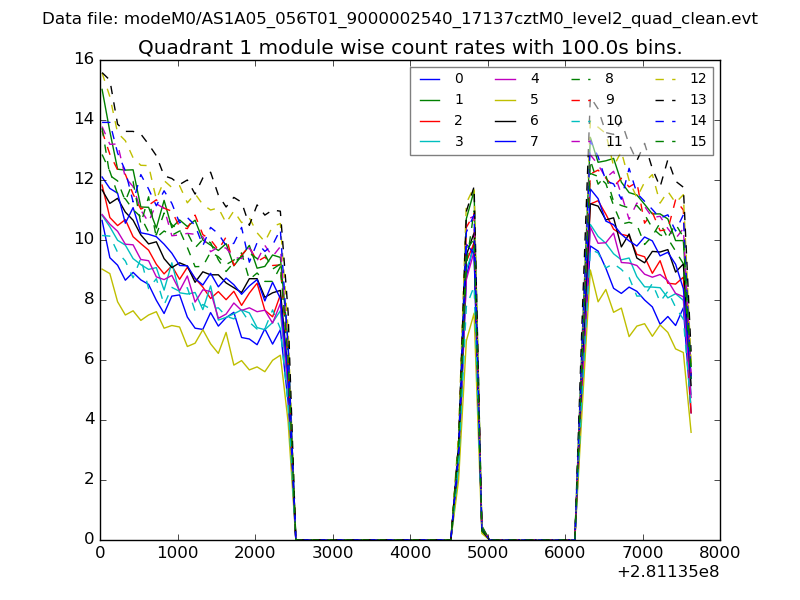 |
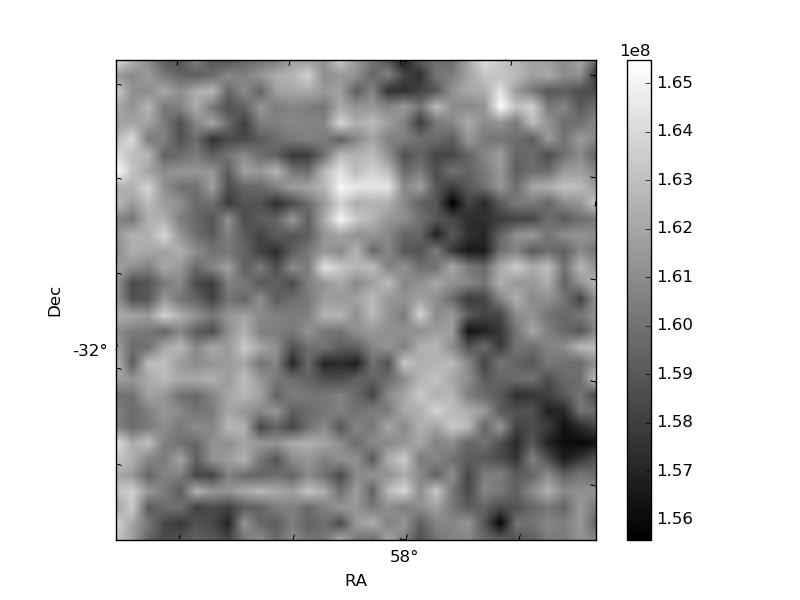 |
| Module-wise count rates for Quadrant C Data is divided into 100 sec bins |
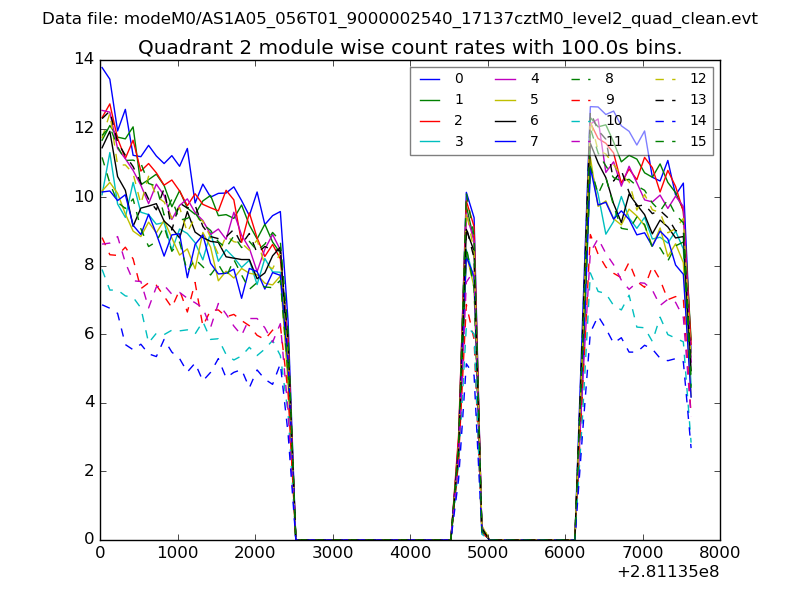 |
 |
| Module-wise count rates for Quadrant D Data is divided into 100 sec bins |
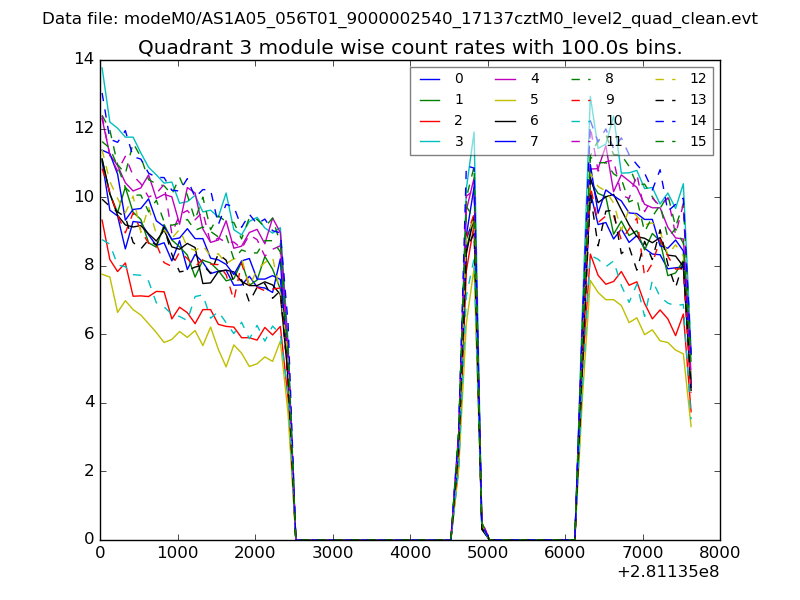 |
 |
| Parameter | Plot |
|---|---|
| CZT HV Monitor | 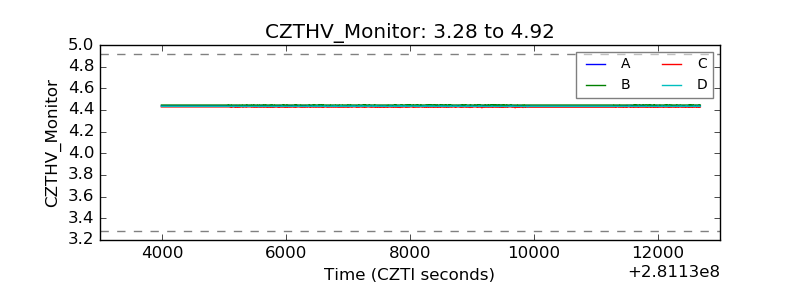 |
| D_VDD | 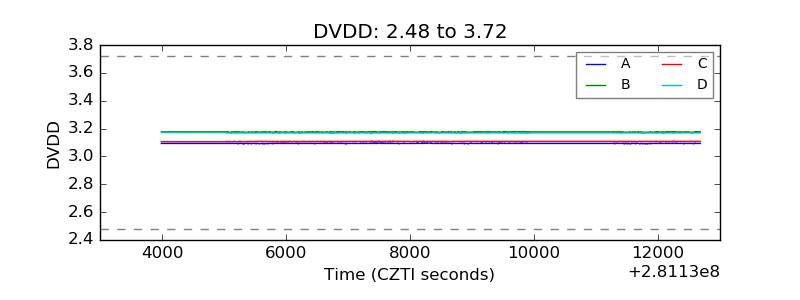 |
| Temperature 1 | 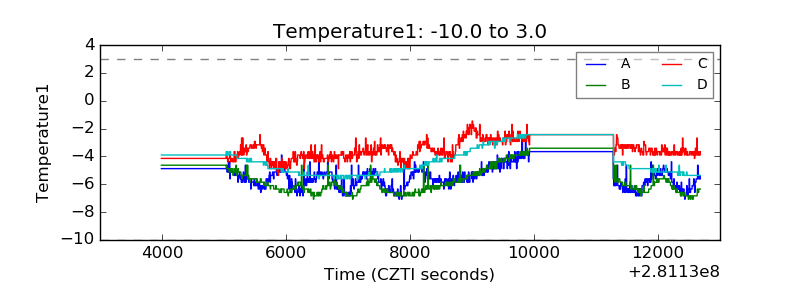 |
| Veto HV Monitor | 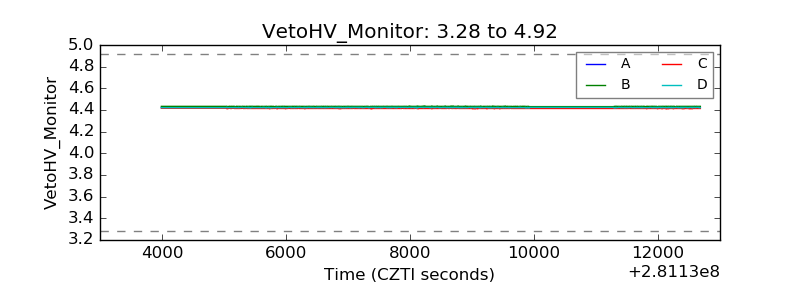 |
| Veto LLD | 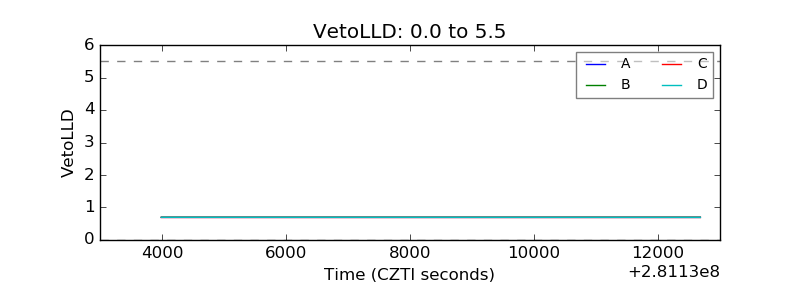 |
| Alpha Counter | 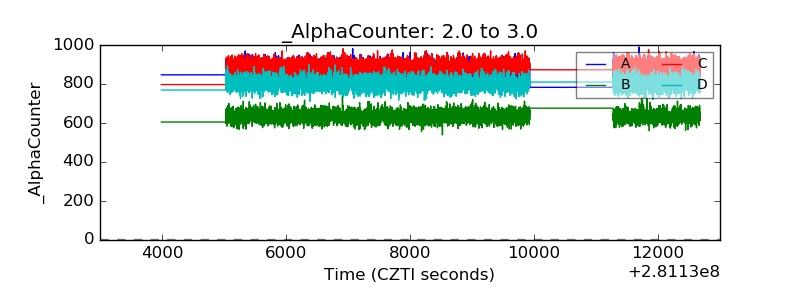 |
| _CPM_Rate | 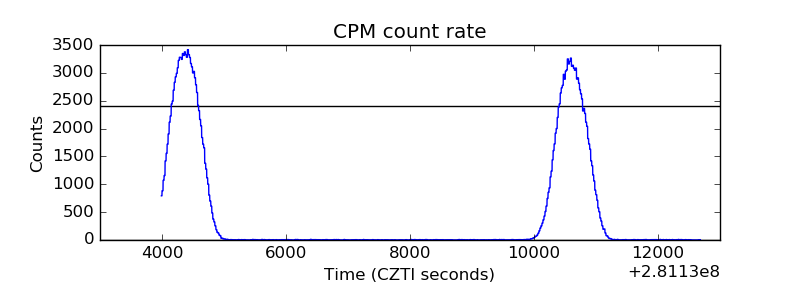 |
| CZT Counter | 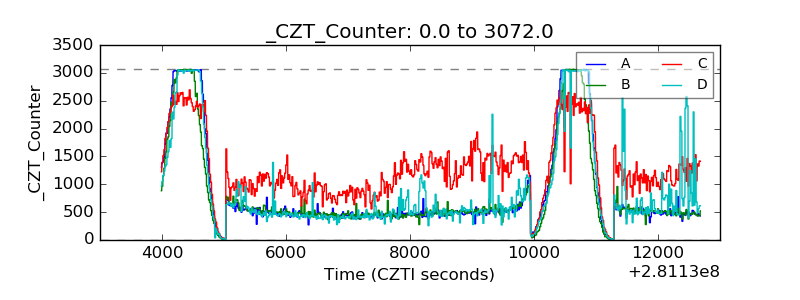 |
| +2.5 Volts monitor |  |
| +5 Volts monitor | 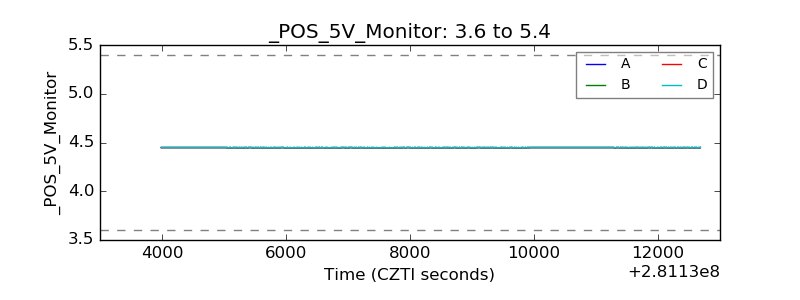 |
| _ROLL_ROT | 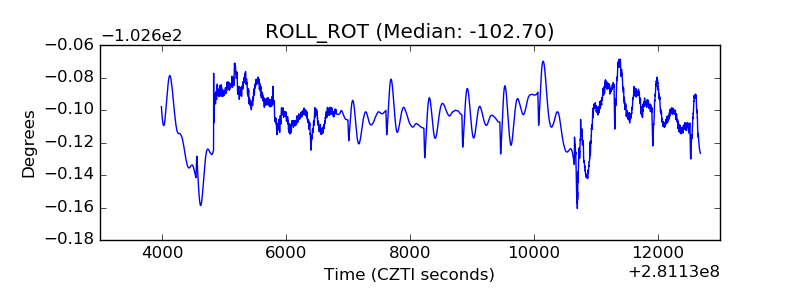 |
| _Roll_DEC | 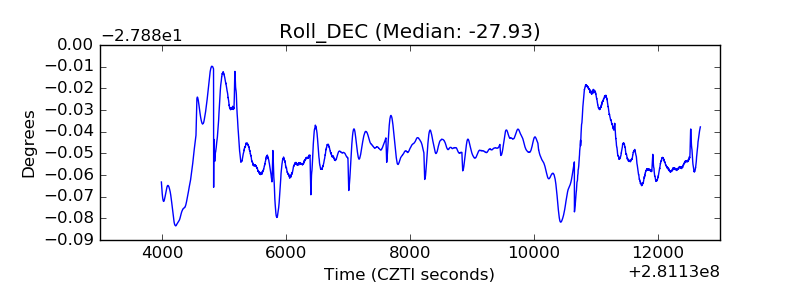 |
| _Roll_RA | 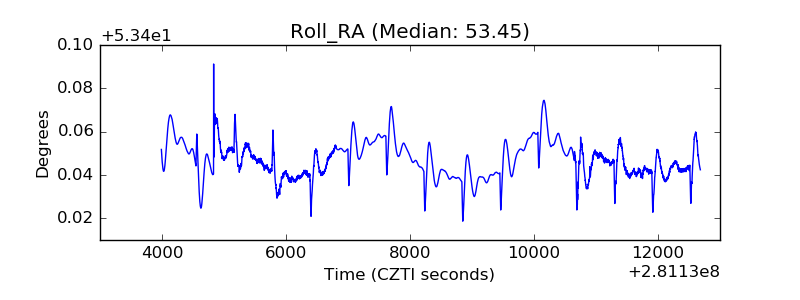 |
| Veto Counter | 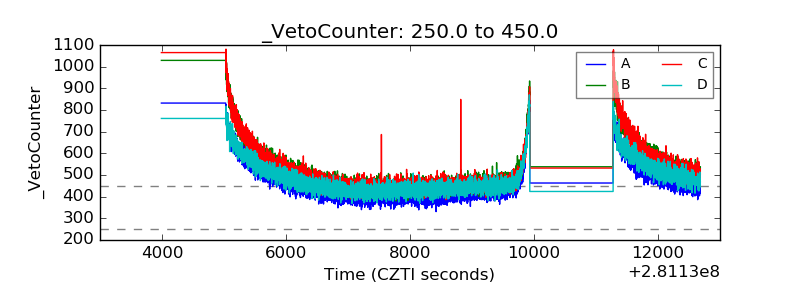 |