| Param | Original file | Final file |
|---|---|---|
| Filename | modeM0/AS1A05_056T01_9000002540_17138cztM0_level2.evt | modeM0/AS1A05_056T01_9000002540_17138cztM0_level2_quad_clean.evt |
| Size (bytes) | 577,630,080 | 61,525,440 |
| Size | 550.9 MB | 58.7 MB |
| Events in quadrant A | 2,403,327 | 396,185 |
| Events in quadrant B | 2,447,961 | 414,413 |
| Events in quadrant C | 6,911,287 | 359,005 |
| Events in quadrant D | 5,403,487 | 352,719 |
| Mode M0 | |||
|---|---|---|---|
| Quadrant | BADHDUFLAG | Total packets | Discarded packets |
| A | 0 | 10068 | 1 |
| B | 0 | 10161 | 1 |
| C | 0 | 23983 | 1 |
| D | 0 | 19276 | 1 |
| Mode M9 | |||
|---|---|---|---|
| Quadrant | BADHDUFLAG | Total packets | Discarded packets |
| A | 0 | 17 | 0 |
| B | 0 | 18 | 0 |
| C | 0 | 18 | 0 |
| D | 0 | 18 | 0 |
| Mode SS | |||
|---|---|---|---|
| Quadrant | BADHDUFLAG | Total packets | Discarded packets |
| A | 0 | 100 | 0 |
| B | 0 | 100 | 0 |
| C | 0 | 100 | 0 |
| D | 0 | 100 | 0 |
| Quadrant | Total seconds | Saturated seconds | Saturation percentage |
|---|---|---|---|
| A | 4840 | 11 | 0.227273% |
| B | 4840 | 20 | 0.413223% |
| C | 4840 | 1043 | 21.549587% |
| D | 4840 | 1082 | 22.355372% |
Noise dominated data is calculated using 1-second bins in cleaned event files. If a bin has >2000 counts, and if more than 50% of those come from <1% of pixels, then it is considered to be noise-dominated and hence unusable.
| Quadrant | # 1 sec bins | Bins with >0 counts | Bins with >2000 counts | High rate bins dominated by noise | Noise dominated (total time) | Noise dominated (detector-on time) | Marked lightcurve |
|---|---|---|---|---|---|---|---|
| A | 4840 | 4840 | 0 | 0 | 0.00% | 0.00% | 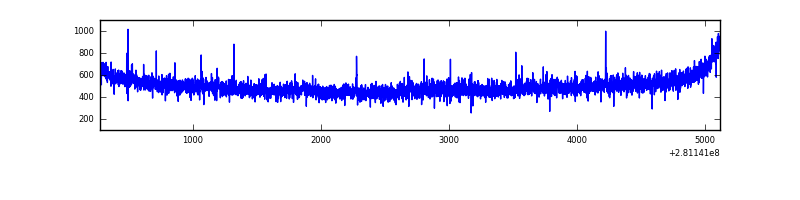 |
| B | 4840 | 4840 | 0 | 0 | 0.00% | 0.00% | 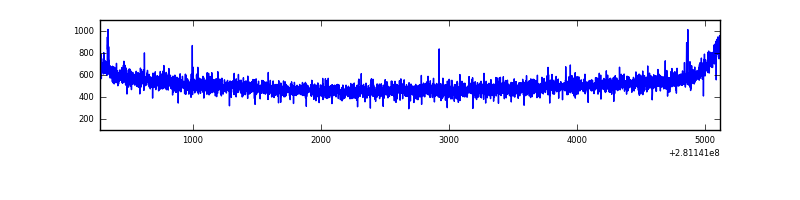 |
| C | 4840 | 4840 | 139 | 139 | 2.87% | 2.87% | 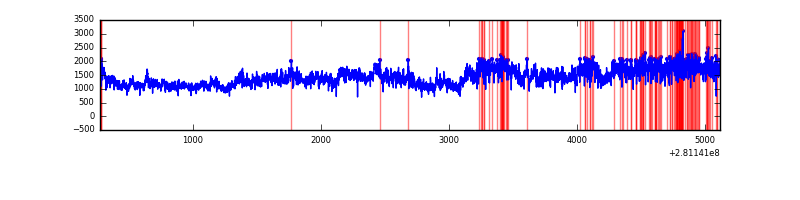 |
| D | 4840 | 4840 | 983 | 983 | 20.31% | 20.31% | 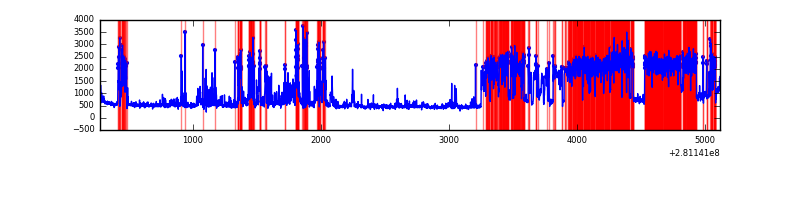 |
Top three noisy pixels from each quadrant. If the there are fewer than three noisy pixels in the level2.evt file, extra rows are filled as -1
| Pixel properties | Quadrant properties | ||||||
|---|---|---|---|---|---|---|---|
| Quadrant | DetID | PixID | Counts | Sigma | Mean | Median | Sigma |
| A | 12 | 189 | 32643 | 257.11 | 617 | 605 | 124.6 |
| A | 0 | 226 | 5227 | 37.09 | 617 | 605 | 124.6 |
| A | 3 | 137 | 4456 | 30.91 | 617 | 605 | 124.6 |
| B | 12 | 111 | 14112 | 113.33 | 626 | 610 | 119.1 |
| B | 11 | 111 | 12451 | 99.39 | 626 | 610 | 119.1 |
| B | 14 | 111 | 10808 | 85.6 | 626 | 610 | 119.1 |
| C | 3 | 233 | 4523349 | 33400.27 | 577 | 583 | 135.4 |
| C | 14 | 238 | 88082 | 646.17 | 577 | 583 | 135.4 |
| C | 7 | 247 | 38595 | 280.72 | 577 | 583 | 135.4 |
| D | 13 | 232 | 2318048 | 16601.48 | 573 | 557 | 139.6 |
| D | 5 | 222 | 585952 | 4193.51 | 573 | 557 | 139.6 |
| D | 13 | 249 | 180531 | 1289.25 | 573 | 557 | 139.6 |
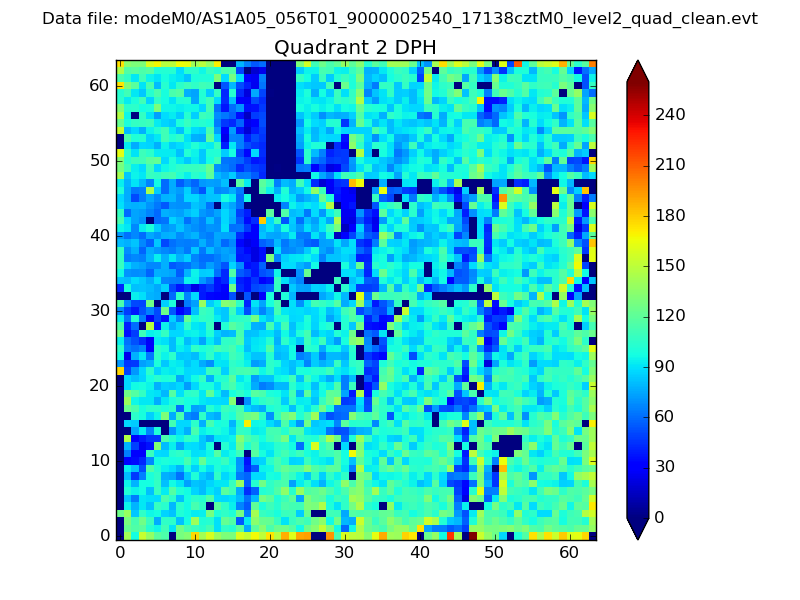
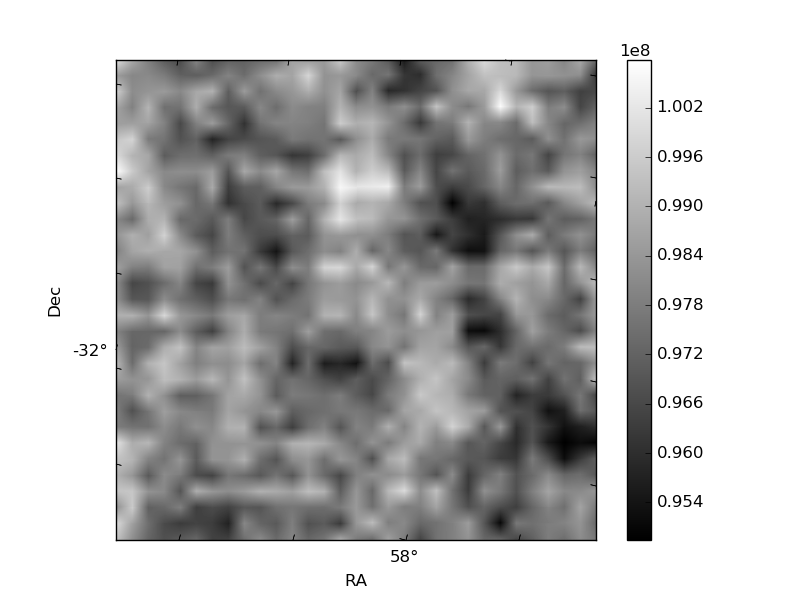
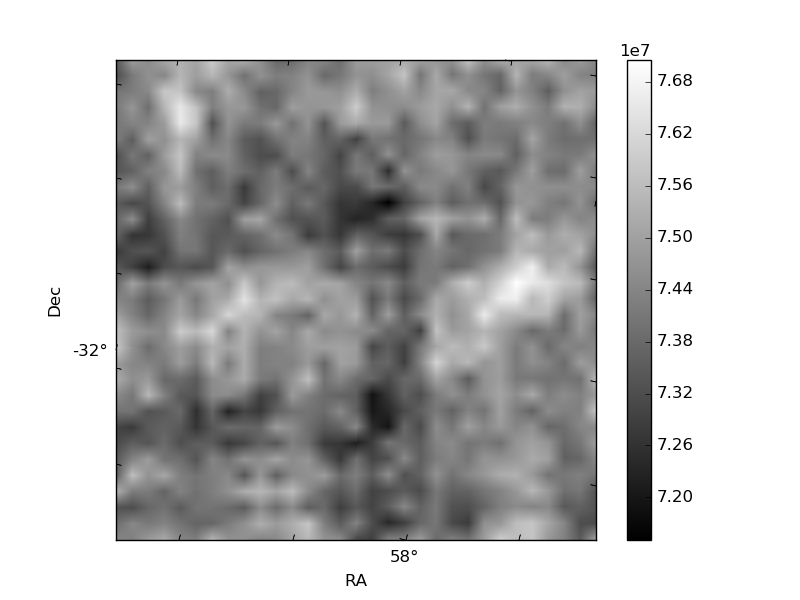
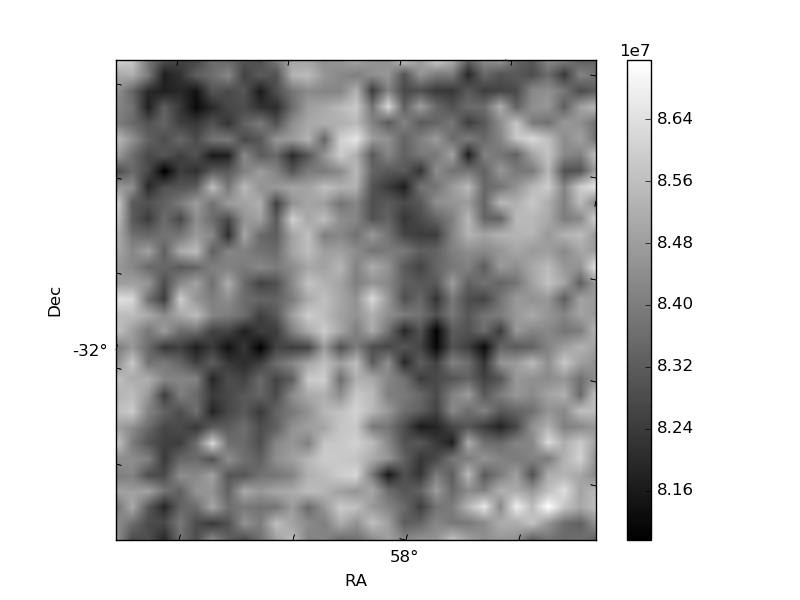
Histogram calculated using DETX and DETY for each event in the final _common_clean file
| Quadrant A | 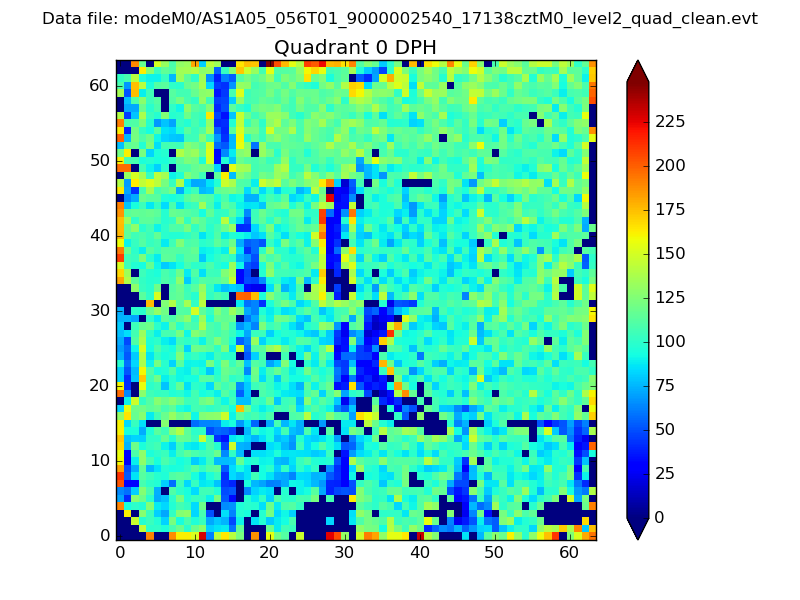 |
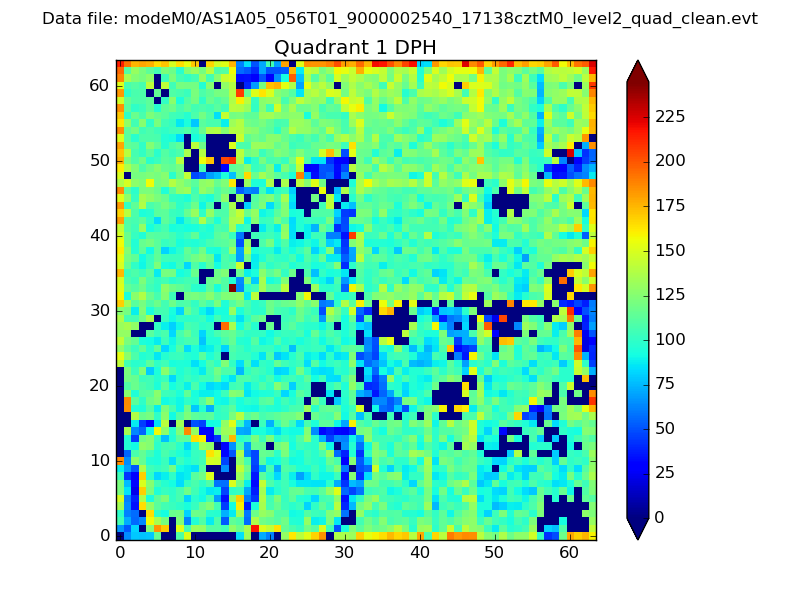 |
Quadrant B |
|---|---|---|---|
| Quadrant D | 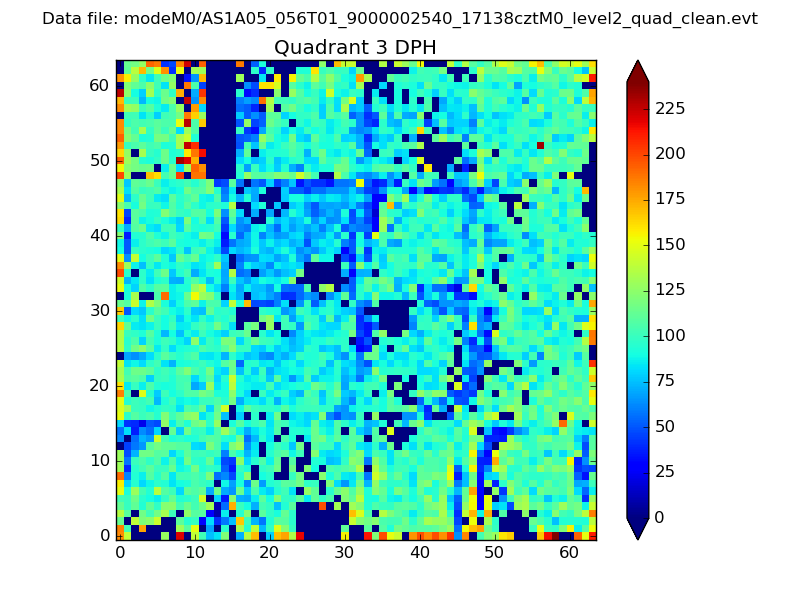 |
 |
Quadrant C |
| Plot type | Count rate plots | Images |
|---|---|---|
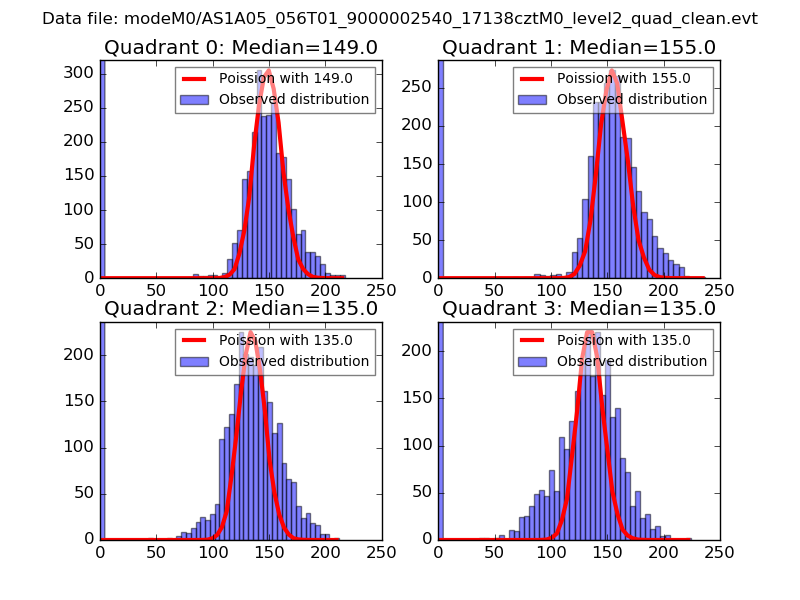
| Comparison with Poisson distribution Blue bars denote a histogram of data divided into 1 sec bins. Red curve is a Poisson curve with rate = median count rate of data. |
 |
 |
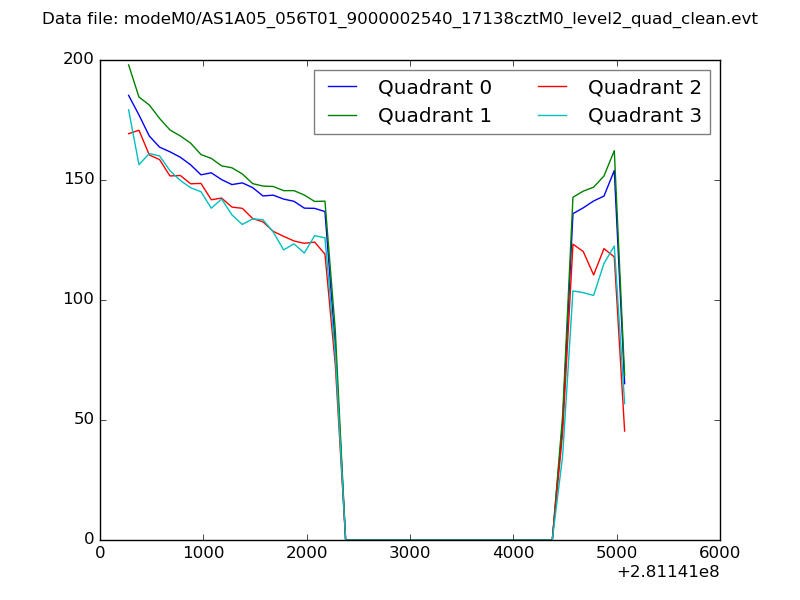
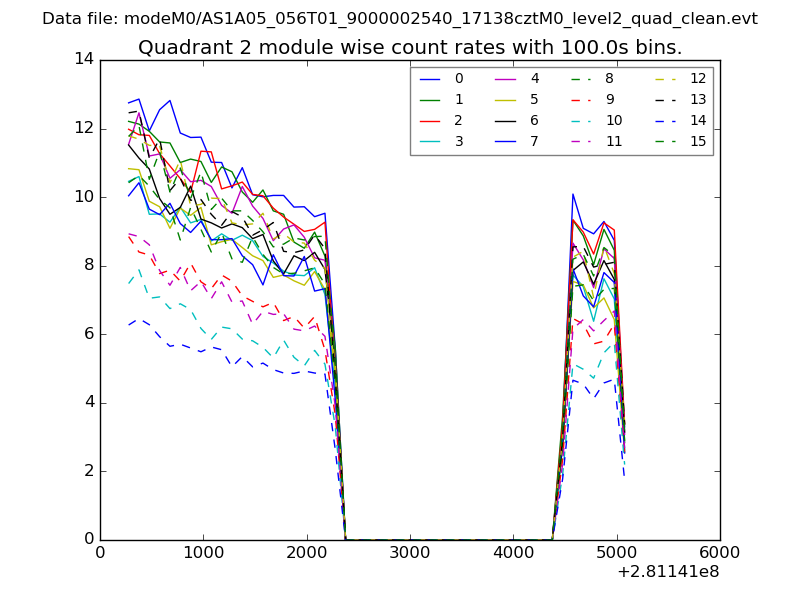
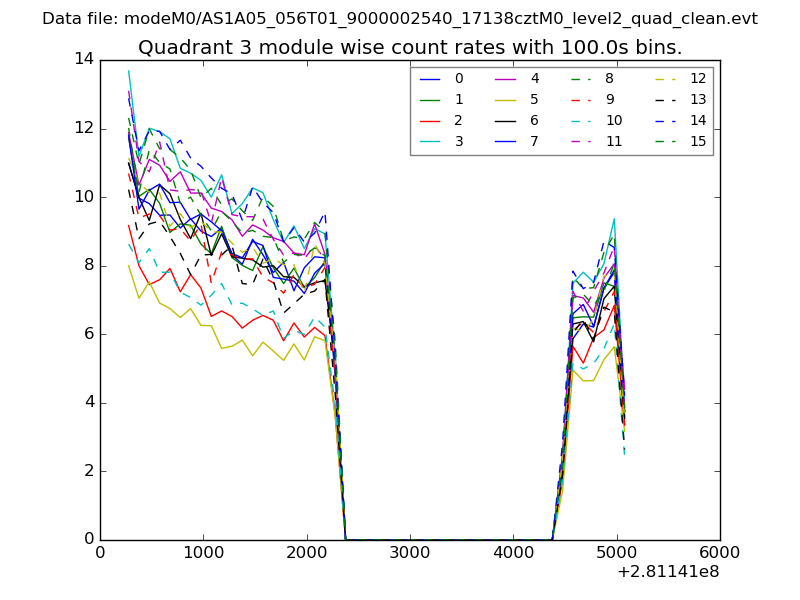
| Quadrant-wise count rates Data is divided into 100 sec bins |
 |
|
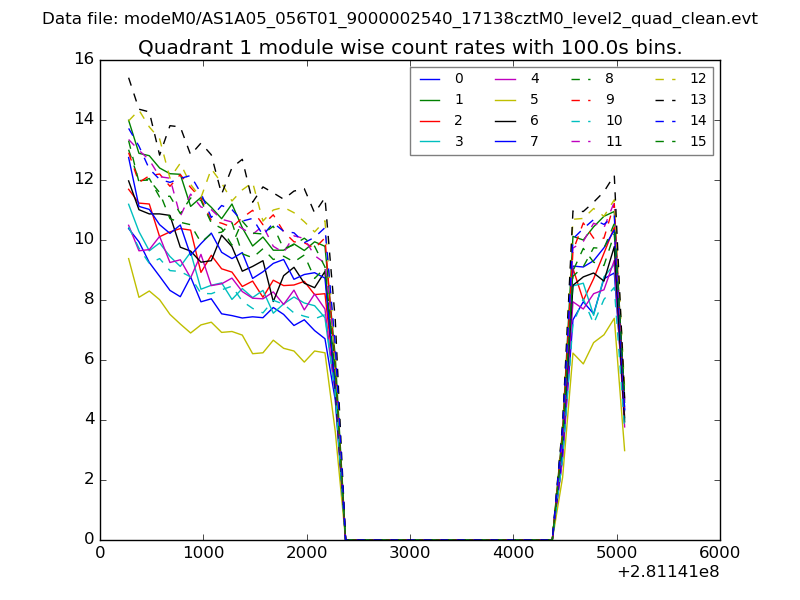
| Module-wise count rates for Quadrant A Data is divided into 100 sec bins |
 |
 |
| Module-wise count rates for Quadrant B Data is divided into 100 sec bins |
 |
 |
| Module-wise count rates for Quadrant C Data is divided into 100 sec bins |
 |
 |
| Module-wise count rates for Quadrant D Data is divided into 100 sec bins |
 |
 |
| Parameter | Plot |
|---|---|
| CZT HV Monitor |  |
| D_VDD | 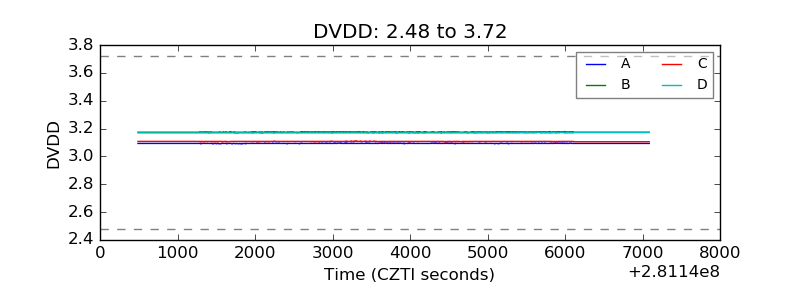 |
| Temperature 1 | 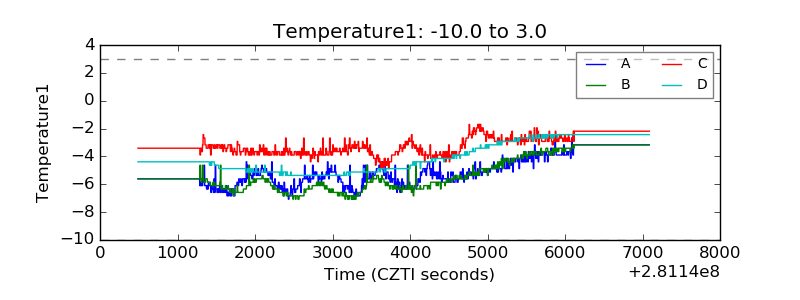 |
| Veto HV Monitor | 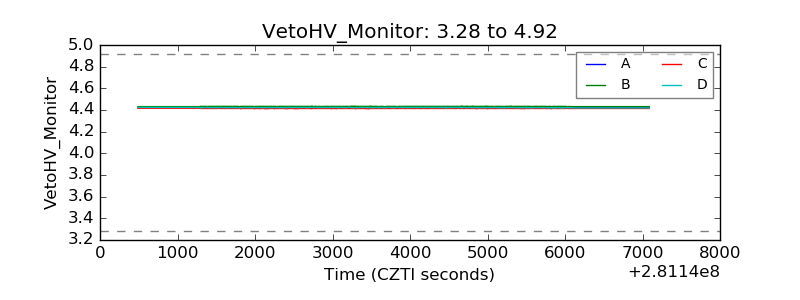 |
| Veto LLD | 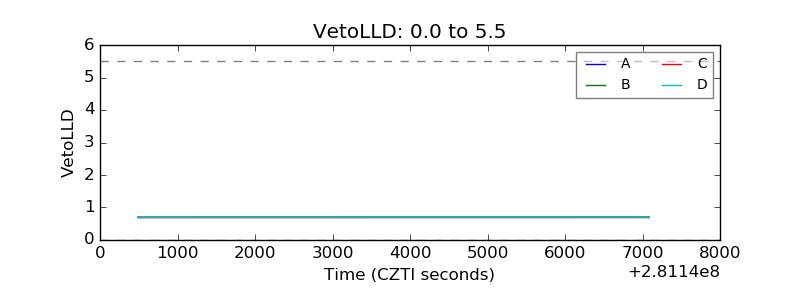 |
| Alpha Counter | 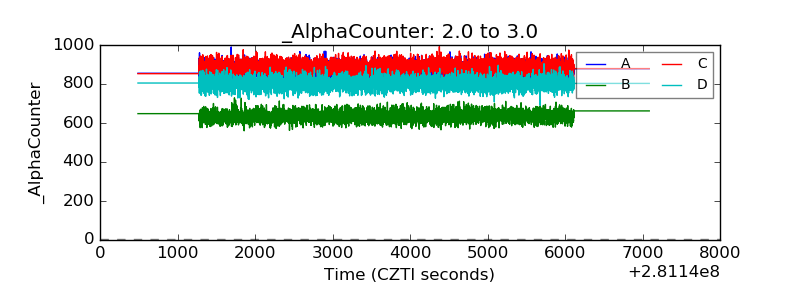 |
| _CPM_Rate | 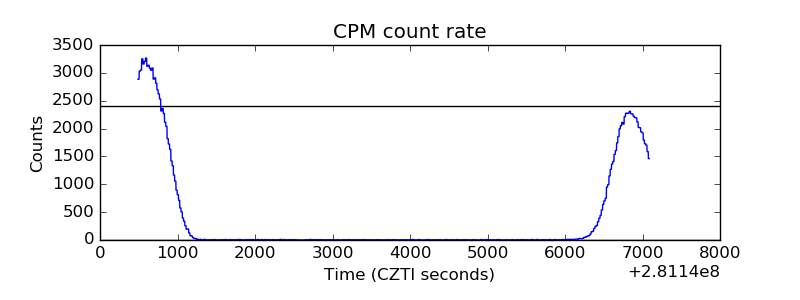 |
| CZT Counter | 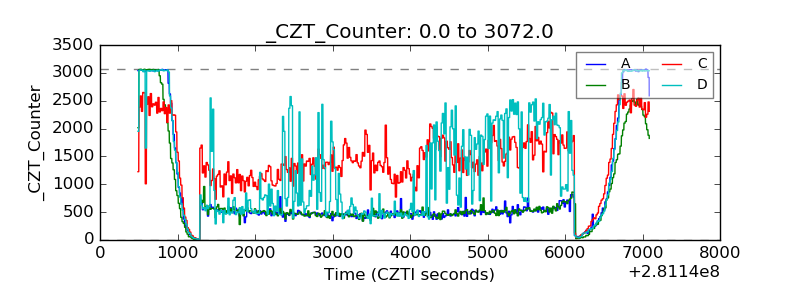 |
| +2.5 Volts monitor |  |
| +5 Volts monitor |  |
| _ROLL_ROT | 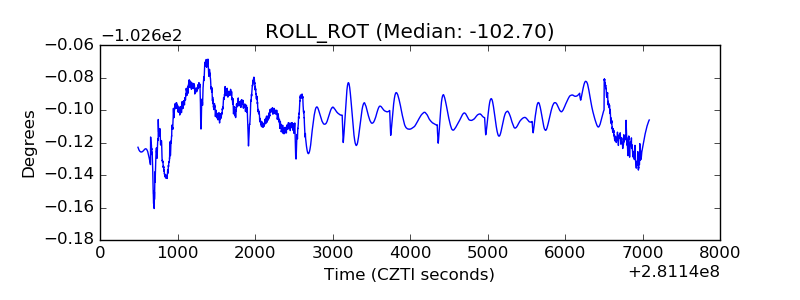 |
| _Roll_DEC | 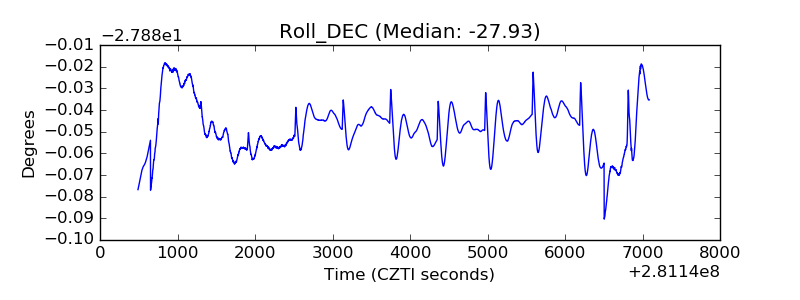 |
| _Roll_RA | 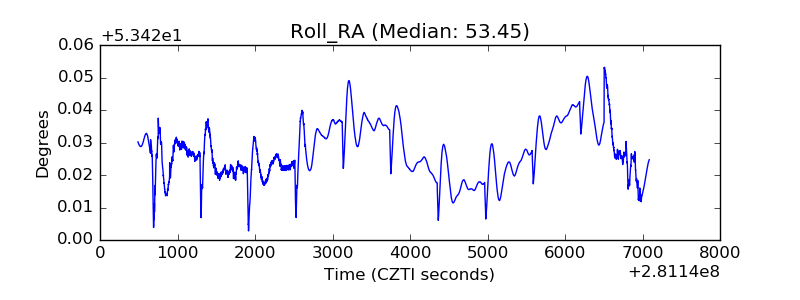 |
| Veto Counter |  |