| Param | Original file | Final file |
|---|---|---|
| Filename | modeM0/AS1A05_194T03_9000002544cztM0_level2.fits | modeM0/AS1A05_194T03_9000002544cztM0_level2_quad_clean.evt |
| Size (bytes) | 383,040,000 | 271,975,680 |
| Size | 365.3 MB | 259.4 MB |
| Events in quadrant A | 2,368,974 | 1,463,176 |
| Events in quadrant B | 2,272,590 | 1,458,401 |
| Events in quadrant C | 2,222,296 | 1,301,564 |
| Events in quadrant D | 2,010,192 | 1,285,578 |
| Mode M9 | |||
|---|---|---|---|
| Quadrant | BADHDUFLAG | Total packets | Discarded packets |
| A | 0 | 74 | 0 |
| B | 0 | 74 | 0 |
| C | 0 | 74 | 0 |
| D | 0 | 74 | 0 |
| Mode SS | |||
|---|---|---|---|
| Quadrant | BADHDUFLAG | Total packets | Discarded packets |
| A | 0 | 810 | 0 |
| B | 0 | 810 | 0 |
| C | 0 | 810 | 0 |
| D | 0 | 810 | 0 |
| Mode M0 | |||
|---|---|---|---|
| Quadrant | BADHDUFLAG | Total packets | Discarded packets |
| A | 0 | 82085 | 0 |
| B | 0 | 87108 | 0 |
| C | 0 | 138834 | 0 |
| D | 0 | 85468 | 0 |
| Quadrant | Total seconds | Saturated seconds | Saturation percentage |
|---|---|---|---|
| A | 39692 | 248 | 0.624811% |
| B | 39692 | 420 | 1.058148% |
| C | 39692 | 2084 | 5.250428% |
| D | 39692 | 507 | 1.277335% |
Noise dominated data is calculated using 1-second bins in cleaned event files. If a bin has >2000 counts, and if more than 50% of those come from <1% of pixels, then it is considered to be noise-dominated and hence unusable.
| Quadrant | # 1 sec bins | Bins with >0 counts | Bins with >2000 counts | High rate bins dominated by noise | Noise dominated (total time) | Noise dominated (detector-on time) | Marked lightcurve |
|---|---|---|---|---|---|---|---|
| A | 47177 | 39689 | 0 | 0 | 0.00% | 0.00% |  |
| B | 47177 | 39690 | 0 | 0 | 0.00% | 0.00% | 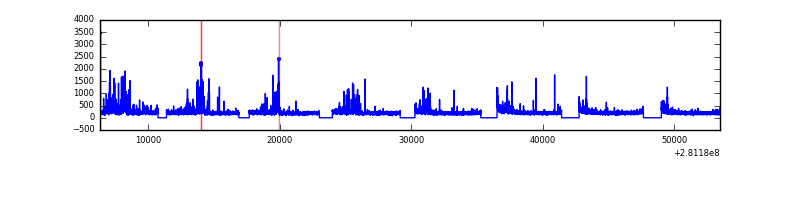 |
| C | 47177 | 39687 | 0 | 0 | 0.00% | 0.00% | 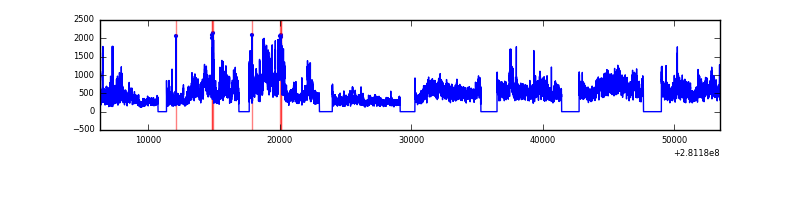 |
| D | 47177 | 39686 | 0 | 0 | 0.00% | 0.00% |  |
Top three noisy pixels from each quadrant. If the there are fewer than three noisy pixels in the level2.evt file, extra rows are filled as -1
| Pixel properties | Quadrant properties | ||||||
|---|---|---|---|---|---|---|---|
| Quadrant | DetID | PixID | Counts | Sigma | Mean | Median | Sigma |
| A | 0 | 29 | 2134 | 10.11 | 616 | 578 | 153.9 |
| A | 7 | 110 | 2015 | 9.34 | 616 | 578 | 153.9 |
| A | 15 | 236 | 1778 | 7.8 | 616 | 578 | 153.9 |
| B | 2 | 9 | 1857 | 10.7 | 601 | 575 | 119.8 |
| B | 2 | 8 | 1588 | 8.45 | 601 | 575 | 119.8 |
| B | 3 | 80 | 1559 | 8.21 | 601 | 575 | 119.8 |
| C | 1 | 81 | 1717 | 7.74 | 586 | 548 | 151.1 |
| C | 1 | 80 | 1684 | 7.52 | 586 | 548 | 151.1 |
| C | 12 | 241 | 1569 | 6.76 | 586 | 548 | 151.1 |
| D | 6 | 231 | 1500 | 6.46 | 572 | 521 | 151.5 |
| D | 3 | 14 | 1449 | 6.12 | 572 | 521 | 151.5 |
| D | 15 | 46 | 1447 | 6.11 | 572 | 521 | 151.5 |
Histogram calculated using DETX and DETY for each event in the final _common_clean file
| Quadrant A |  |
 |
Quadrant B |
|---|---|---|---|
| Quadrant D |  |
 |
Quadrant C |
| Plot type | Count rate plots | Images |
|---|---|---|
| Comparison with Poisson distribution Blue bars denote a histogram of data divided into 1 sec bins. Red curve is a Poisson curve with rate = median count rate of data. |
 |
 |
| Quadrant-wise count rates Data is divided into 100 sec bins |
 |
|
| Module-wise count rates for Quadrant A Data is divided into 100 sec bins |
 |
 |
| Module-wise count rates for Quadrant B Data is divided into 100 sec bins |
 |
 |
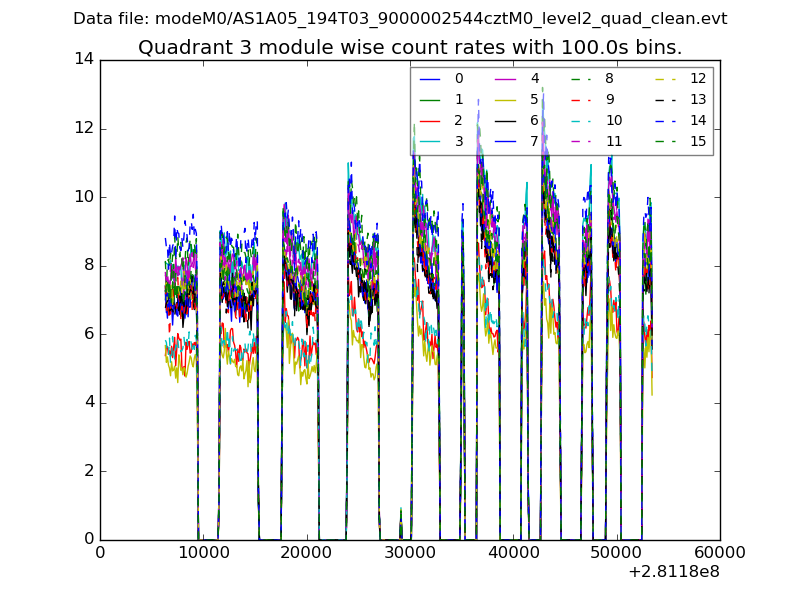
| Module-wise count rates for Quadrant C Data is divided into 100 sec bins |
 |
 |
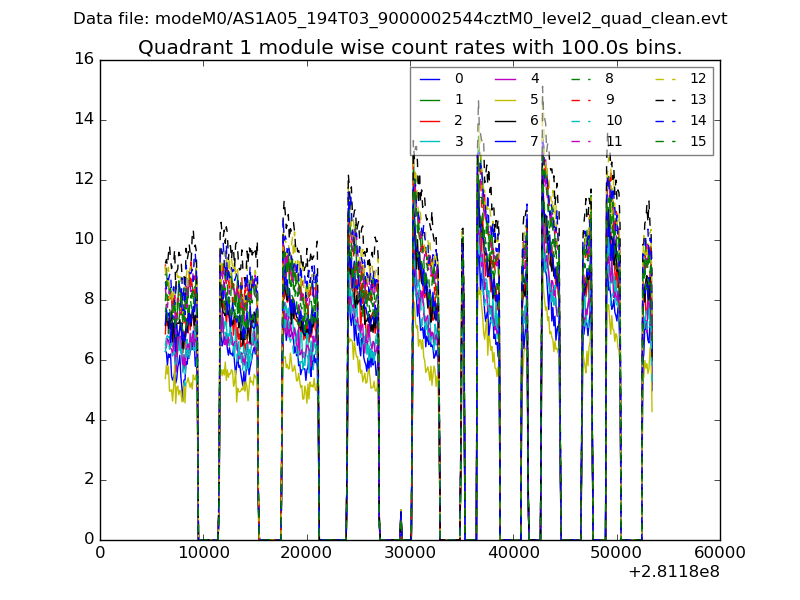
| Module-wise count rates for Quadrant D Data is divided into 100 sec bins |
 |
 |
| Parameter | Plot |
|---|---|
| CZT HV Monitor |  |
| D_VDD | 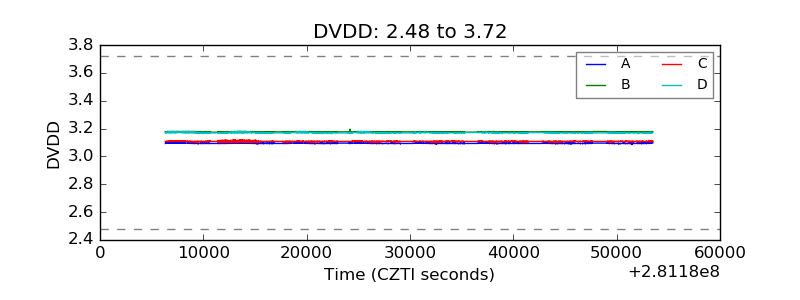 |
| Temperature 1 |  |
| Veto HV Monitor |  |
| Veto LLD |  |
| Alpha Counter |  |
| _CPM_Rate | 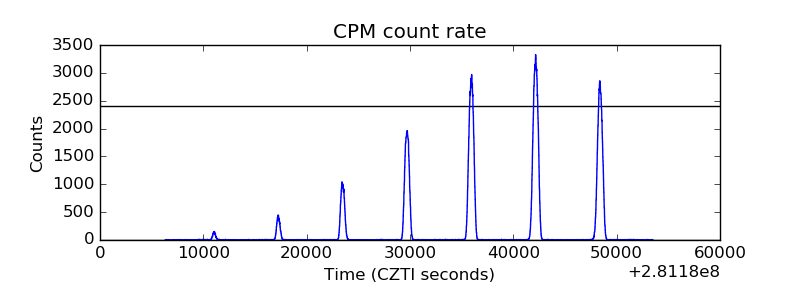 |
| CZT Counter |  |
| +2.5 Volts monitor | 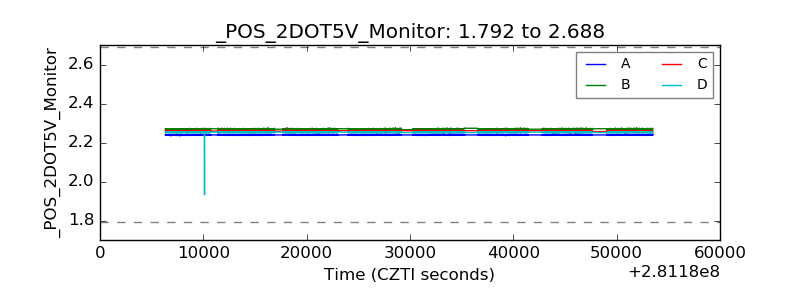 |
| +5 Volts monitor | 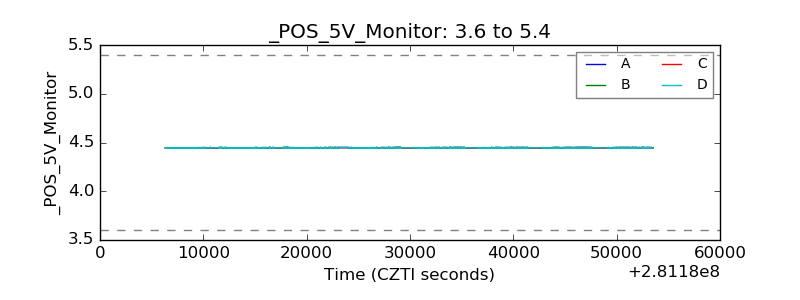 |
| _ROLL_ROT |  |
| _Roll_DEC |  |
| _Roll_RA |  |
| Veto Counter |  |