| Param | Original file | Final file |
|---|---|---|
| Filename | modeM0/AS1A05_194T03_9000002544_17146cztM0_level2.evt | modeM0/AS1A05_194T03_9000002544_17146cztM0_level2_quad_clean.evt |
| Size (bytes) | 951,975,360 | 159,307,200 |
| Size | 907.9 MB | 151.9 MB |
| Events in quadrant A | 5,302,841 | 1,036,491 |
| Events in quadrant B | 6,590,615 | 1,040,261 |
| Events in quadrant C | 10,232,960 | 962,315 |
| Events in quadrant D | 5,926,092 | 988,551 |
| Mode M9 | |||
|---|---|---|---|
| Quadrant | BADHDUFLAG | Total packets | Discarded packets |
| A | 0 | 14 | 0 |
| B | 0 | 14 | 0 |
| C | 0 | 14 | 0 |
| D | 0 | 14 | 0 |
| Mode SS | |||
|---|---|---|---|
| Quadrant | BADHDUFLAG | Total packets | Discarded packets |
| A | 0 | 234 | 0 |
| B | 0 | 234 | 0 |
| C | 0 | 234 | 0 |
| D | 0 | 234 | 0 |
| Mode M0 | |||
|---|---|---|---|
| Quadrant | BADHDUFLAG | Total packets | Discarded packets |
| A | 0 | 23545 | 2 |
| B | 0 | 26922 | 2 |
| C | 0 | 38697 | 2 |
| D | 0 | 25379 | 2 |
| Quadrant | Total seconds | Saturated seconds | Saturation percentage |
|---|---|---|---|
| A | 11523 | 95 | 0.824438% |
| B | 11523 | 214 | 1.857155% |
| C | 11523 | 747 | 6.482687% |
| D | 11523 | 171 | 1.483989% |
Noise dominated data is calculated using 1-second bins in cleaned event files. If a bin has >2000 counts, and if more than 50% of those come from <1% of pixels, then it is considered to be noise-dominated and hence unusable.
| Quadrant | # 1 sec bins | Bins with >0 counts | Bins with >2000 counts | High rate bins dominated by noise | Noise dominated (total time) | Noise dominated (detector-on time) | Marked lightcurve |
|---|---|---|---|---|---|---|---|
| A | 12963 | 11524 | 3 | 3 | 0.02% | 0.03% | 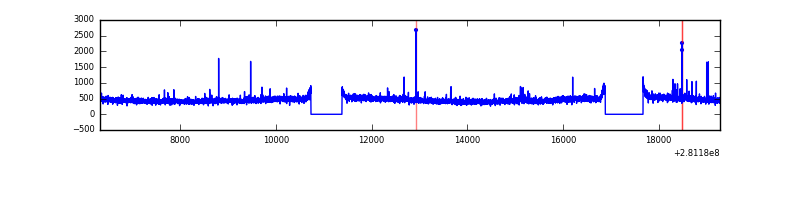 |
| B | 12963 | 11524 | 89 | 89 | 0.69% | 0.77% | 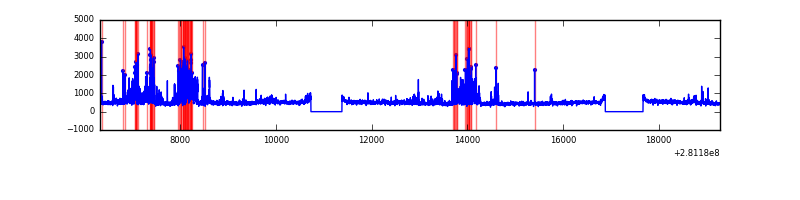 |
| C | 12963 | 11524 | 261 | 261 | 2.01% | 2.26% | 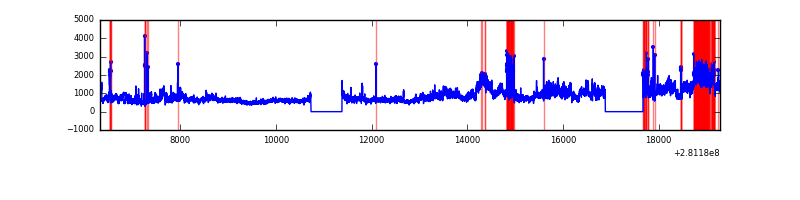 |
| D | 12963 | 11524 | 115 | 115 | 0.89% | 1.00% | 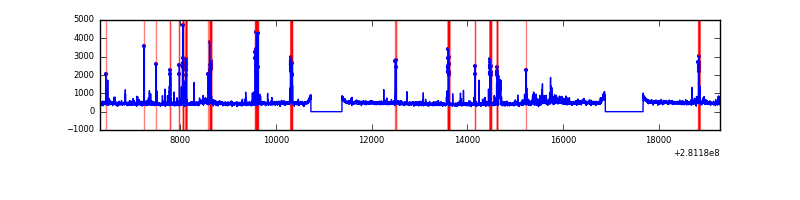 |
Top three noisy pixels from each quadrant. If the there are fewer than three noisy pixels in the level2.evt file, extra rows are filled as -1
| Pixel properties | Quadrant properties | ||||||
|---|---|---|---|---|---|---|---|
| Quadrant | DetID | PixID | Counts | Sigma | Mean | Median | Sigma |
| A | 12 | 96 | 50161 | 177.13 | 1358 | 1327 | 275.7 |
| A | 12 | 189 | 31641 | 109.95 | 1358 | 1327 | 275.7 |
| A | 0 | 226 | 12169 | 39.33 | 1358 | 1327 | 275.7 |
| B | 0 | 189 | 699536 | 2685.18 | 1351 | 1315 | 260.0 |
| B | 7 | 220 | 296270 | 1134.32 | 1351 | 1315 | 260.0 |
| B | 0 | 219 | 100867 | 382.85 | 1351 | 1315 | 260.0 |
| C | 3 | 233 | 4753184 | 15985.79 | 1277 | 1286 | 297.3 |
| C | 4 | 254 | 250620 | 838.78 | 1277 | 1286 | 297.3 |
| C | 14 | 238 | 194014 | 648.35 | 1277 | 1286 | 297.3 |
| D | 1 | 52 | 421021 | 1303.75 | 1324 | 1285 | 321.9 |
| D | 15 | 0 | 170874 | 526.76 | 1324 | 1285 | 321.9 |
| D | 10 | 70 | 104107 | 319.38 | 1324 | 1285 | 321.9 |
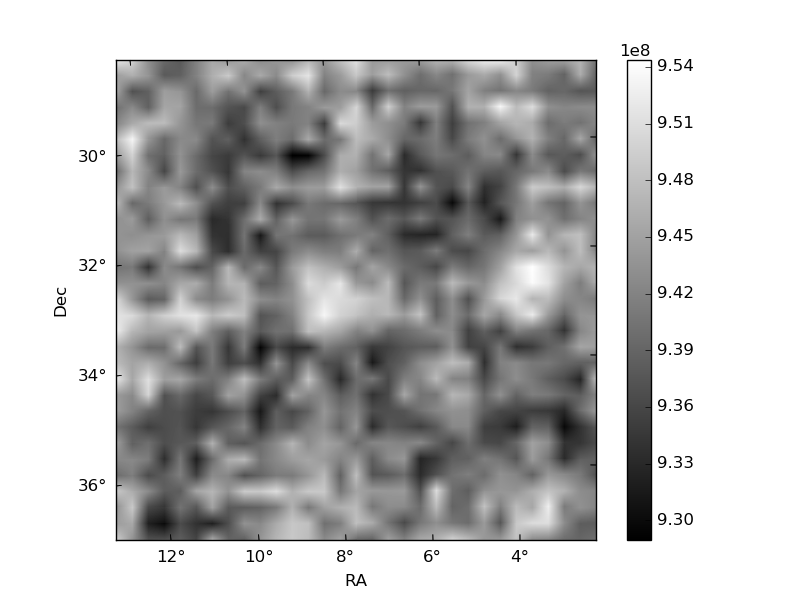
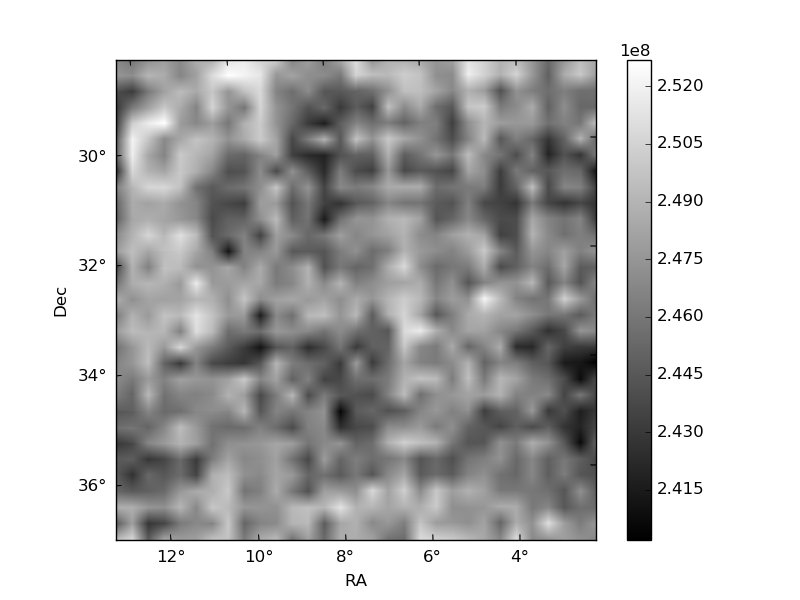
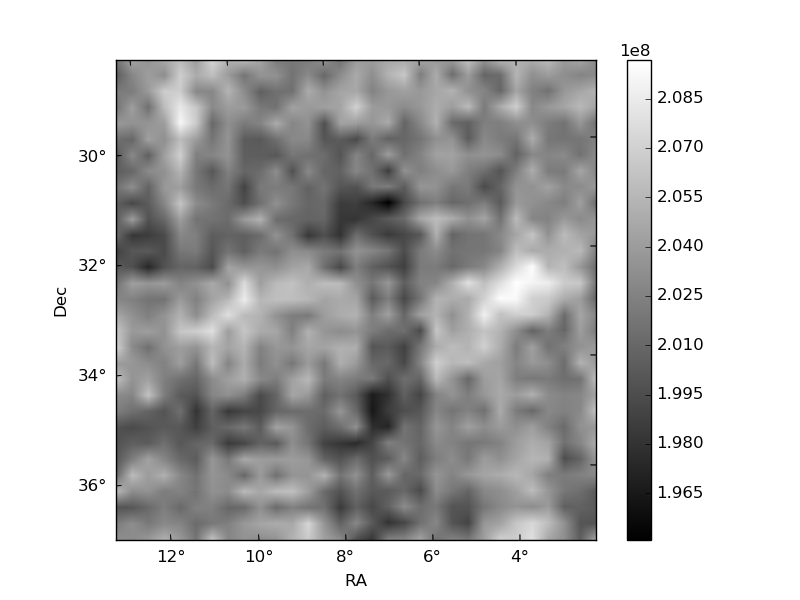
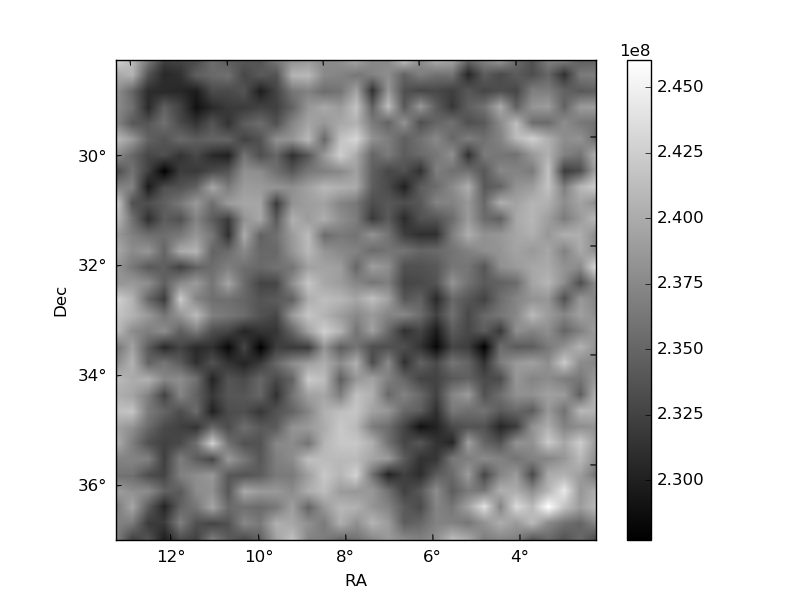
Histogram calculated using DETX and DETY for each event in the final _common_clean file
| Quadrant A | 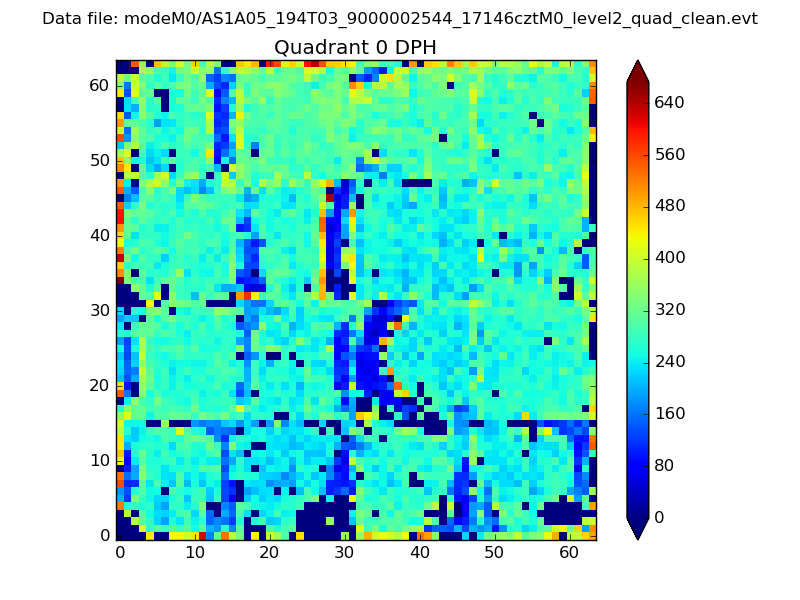 |
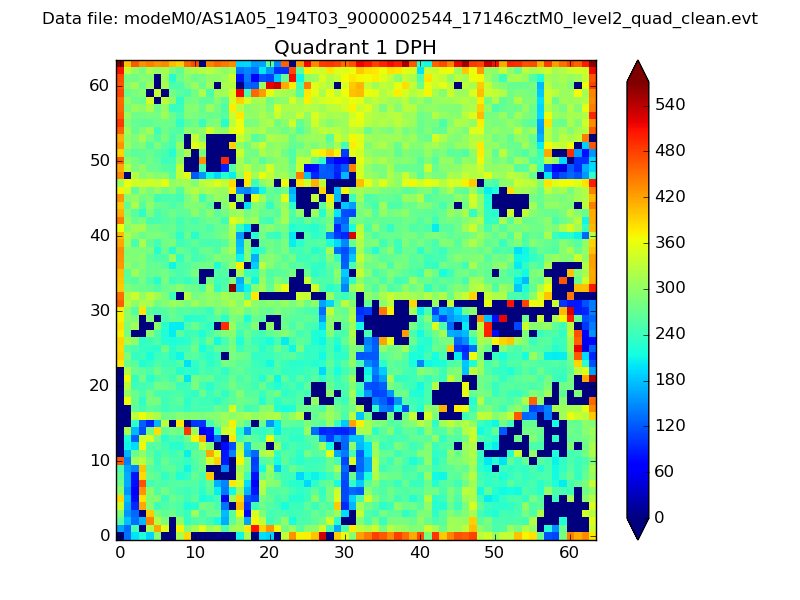 |
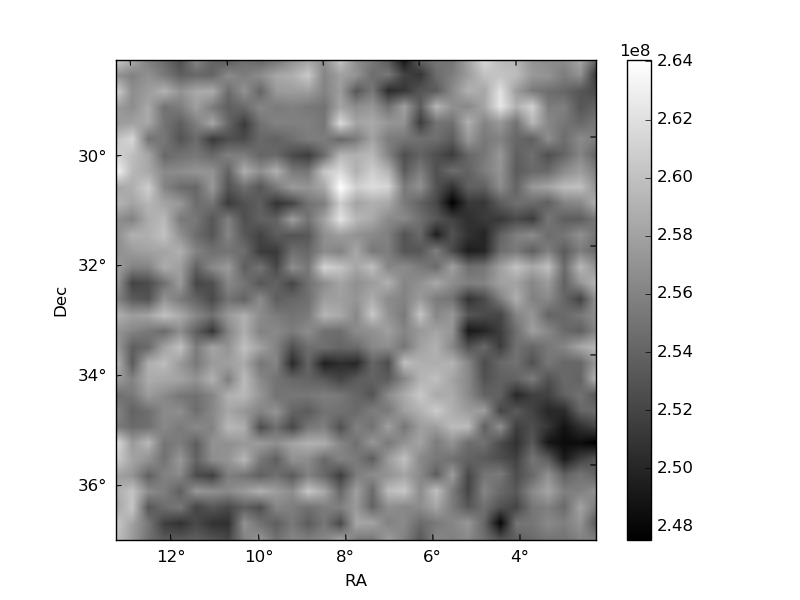
Quadrant B |
|---|---|---|---|
| Quadrant D | 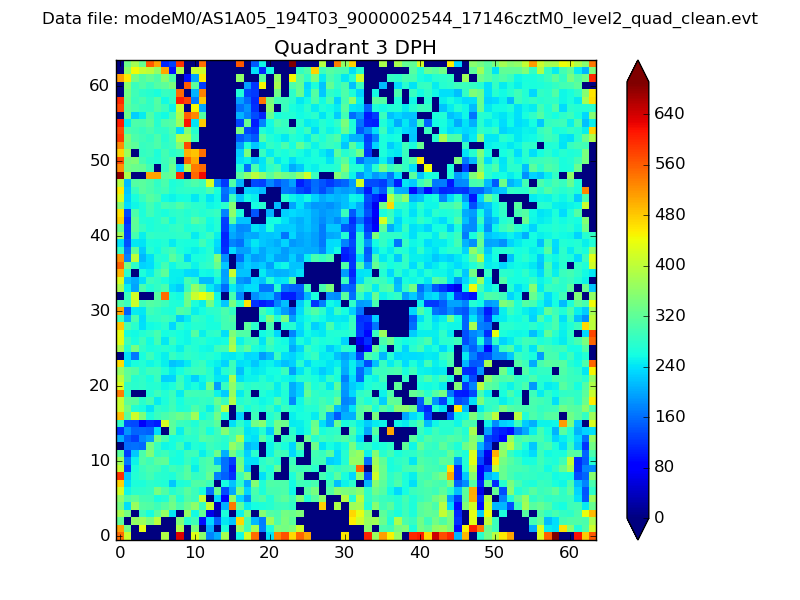 |
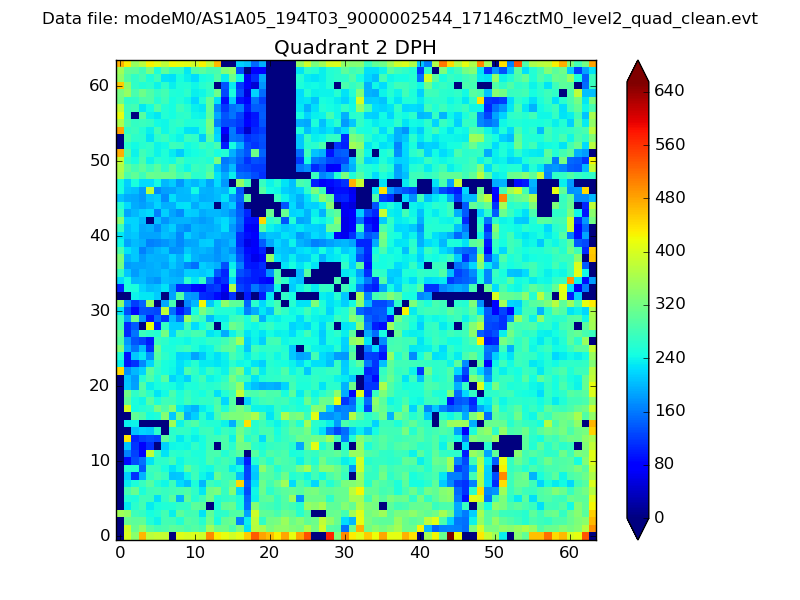 |
Quadrant C |
| Plot type | Count rate plots | Images |
|---|---|---|
| Comparison with Poisson distribution Blue bars denote a histogram of data divided into 1 sec bins. Red curve is a Poisson curve with rate = median count rate of data. |
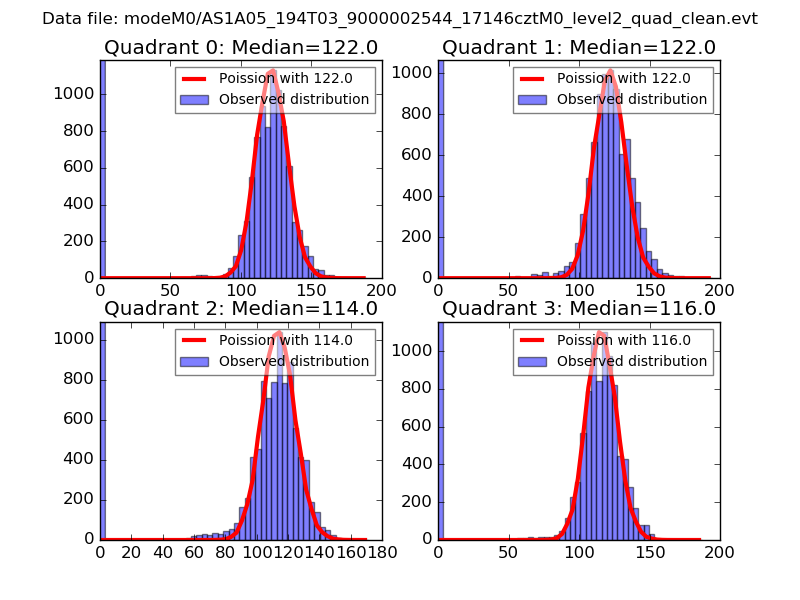 |
 |
| Quadrant-wise count rates Data is divided into 100 sec bins |
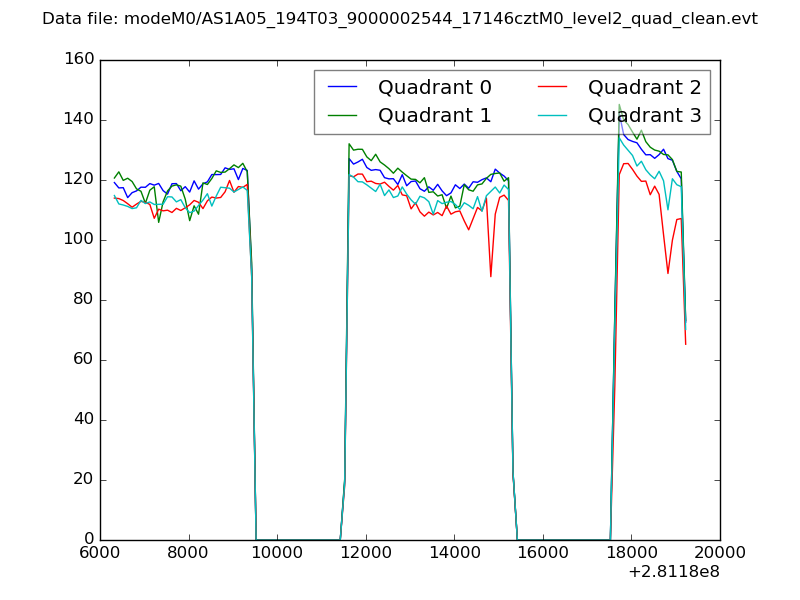 |
|
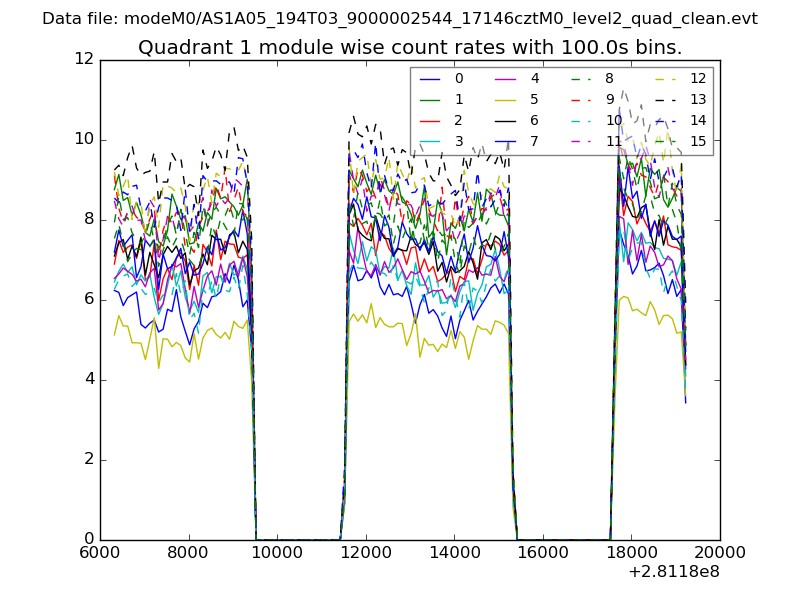
| Module-wise count rates for Quadrant A Data is divided into 100 sec bins |
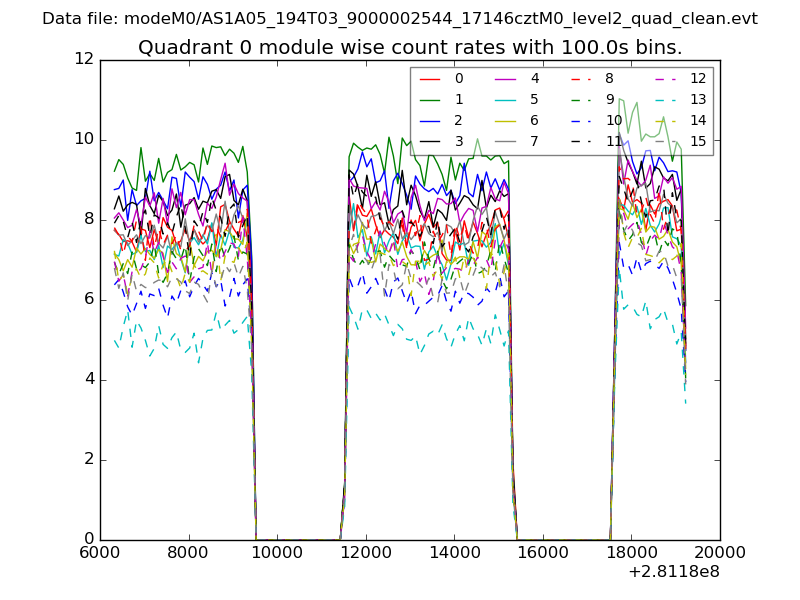 |
 |
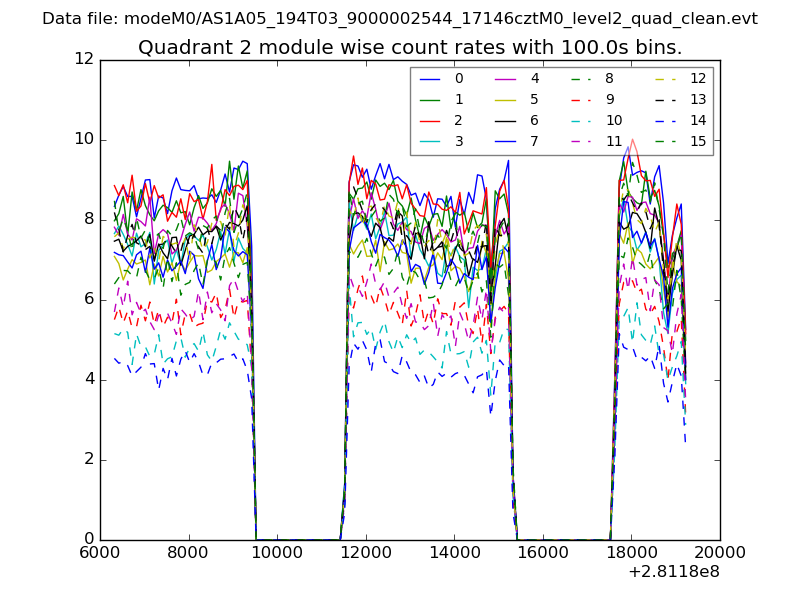
| Module-wise count rates for Quadrant B Data is divided into 100 sec bins |
 |
 |
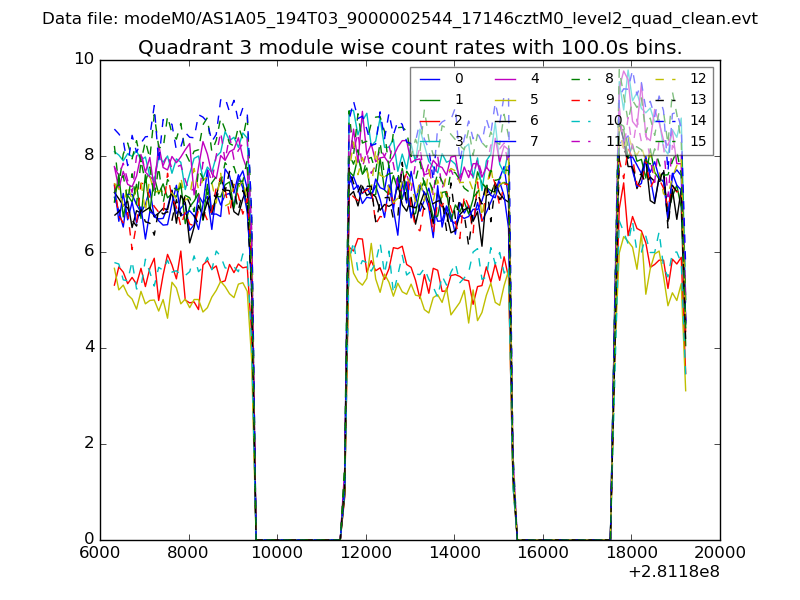
| Module-wise count rates for Quadrant C Data is divided into 100 sec bins |
 |
 |
| Module-wise count rates for Quadrant D Data is divided into 100 sec bins |
 |
 |
| Parameter | Plot |
|---|---|
| CZT HV Monitor | 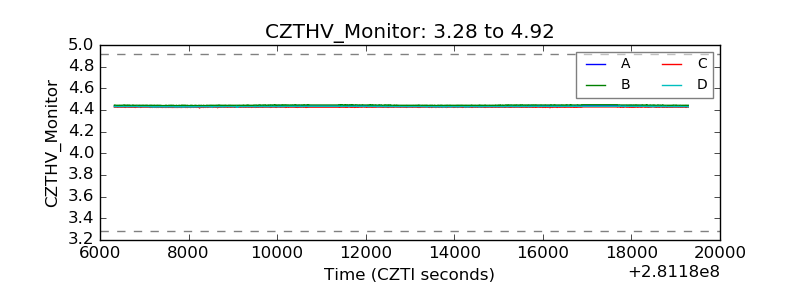 |
| D_VDD | 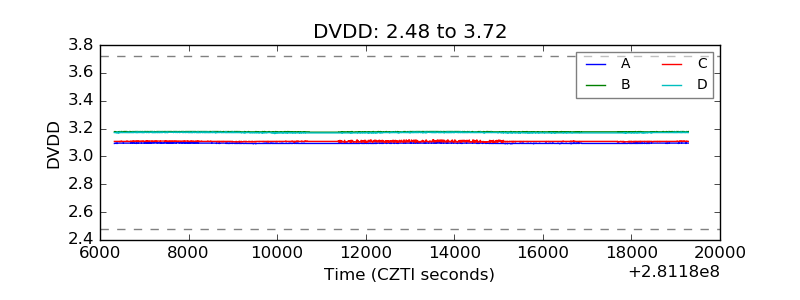 |
| Temperature 1 | 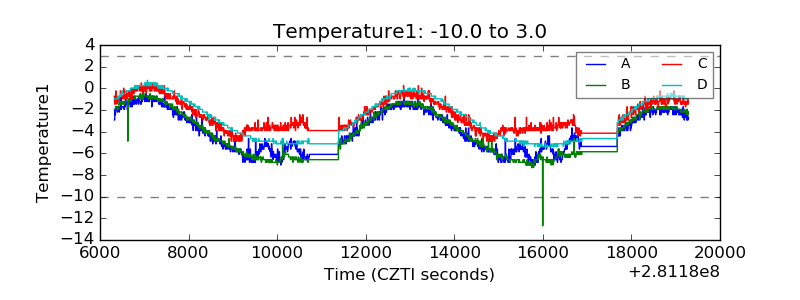 |
| Veto HV Monitor | 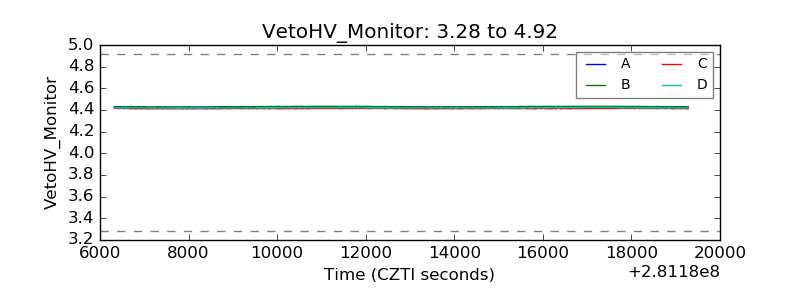 |
| Veto LLD | 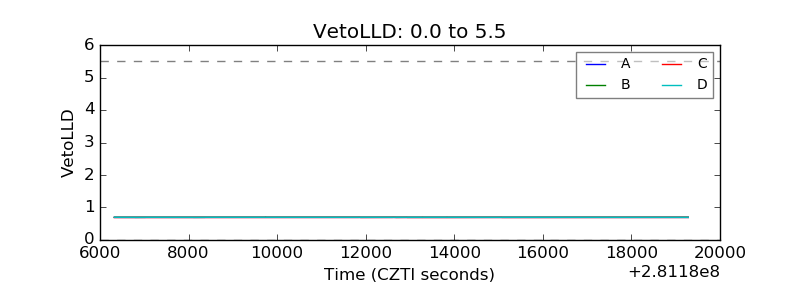 |
| Alpha Counter | 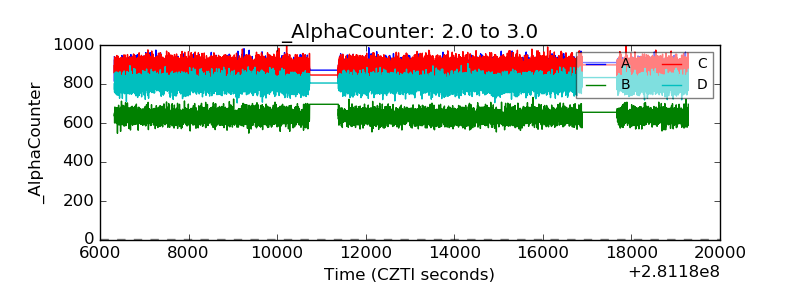 |
| _CPM_Rate | 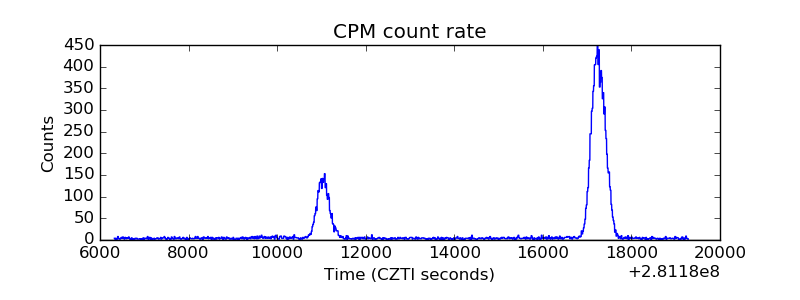 |
| CZT Counter | 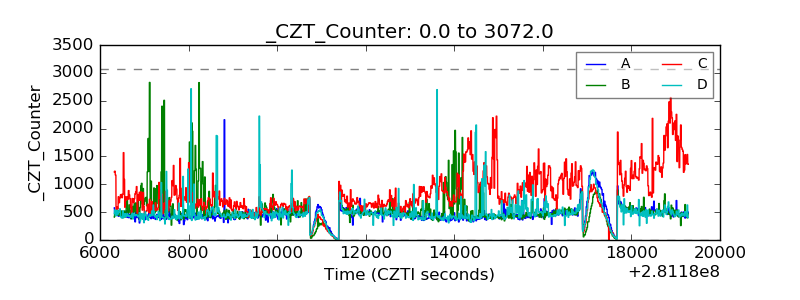 |
| +2.5 Volts monitor |  |
| +5 Volts monitor | 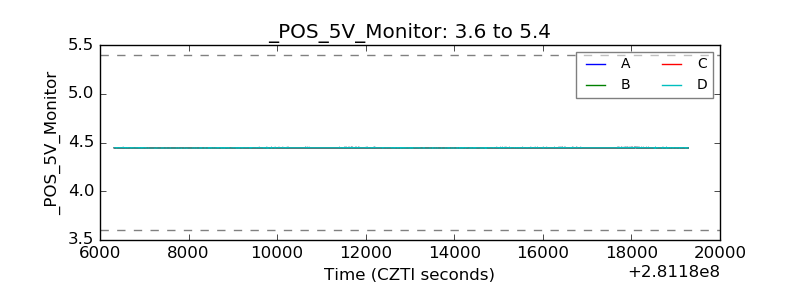 |
| _ROLL_ROT | 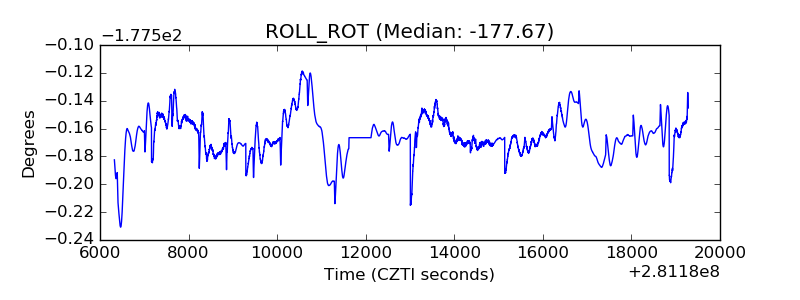 |
| _Roll_DEC | 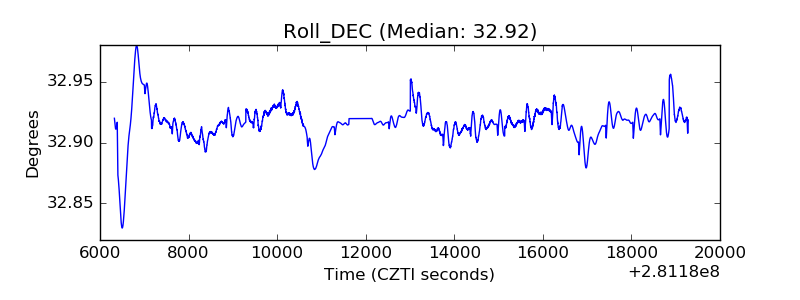 |
| _Roll_RA | 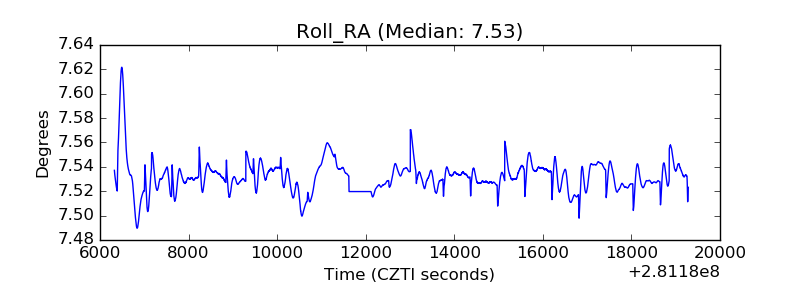 |
| Veto Counter | 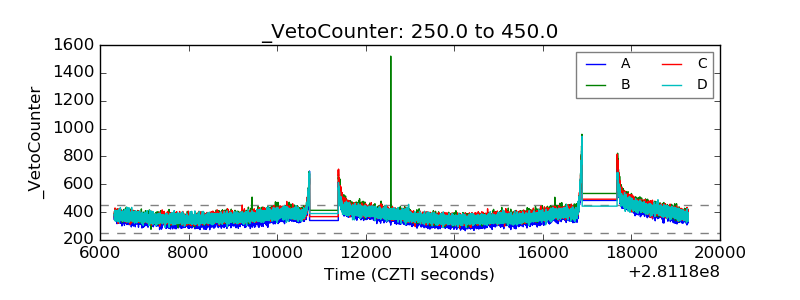 |