| Param | Original file | Final file |
|---|---|---|
| Filename | modeM0/AS1A05_194T03_9000002544_17149cztM0_level2.evt | modeM0/AS1A05_194T03_9000002544_17149cztM0_level2_quad_clean.evt |
| Size (bytes) | 465,960,960 | 89,616,960 |
| Size | 444.4 MB | 85.5 MB |
| Events in quadrant A | 3,050,335 | 581,321 |
| Events in quadrant B | 3,281,987 | 584,711 |
| Events in quadrant C | 4,302,478 | 549,020 |
| Events in quadrant D | 3,042,858 | 553,107 |
| Mode M9 | |||
|---|---|---|---|
| Quadrant | BADHDUFLAG | Total packets | Discarded packets |
| A | 0 | 11 | 0 |
| B | 0 | 11 | 0 |
| C | 0 | 11 | 0 |
| D | 0 | 11 | 0 |
| Mode SS | |||
|---|---|---|---|
| Quadrant | BADHDUFLAG | Total packets | Discarded packets |
| A | 0 | 130 | 0 |
| B | 0 | 130 | 0 |
| C | 0 | 130 | 0 |
| D | 0 | 130 | 0 |
| Mode M0 | |||
|---|---|---|---|
| Quadrant | BADHDUFLAG | Total packets | Discarded packets |
| A | 0 | 13333 | 1 |
| B | 0 | 13988 | 2 |
| C | 0 | 17253 | 1 |
| D | 0 | 13446 | 1 |
| Quadrant | Total seconds | Saturated seconds | Saturation percentage |
|---|---|---|---|
| A | 6390 | 44 | 0.688576% |
| B | 6390 | 48 | 0.751174% |
| C | 6390 | 109 | 1.705790% |
| D | 6390 | 62 | 0.970266% |
Noise dominated data is calculated using 1-second bins in cleaned event files. If a bin has >2000 counts, and if more than 50% of those come from <1% of pixels, then it is considered to be noise-dominated and hence unusable.
| Quadrant | # 1 sec bins | Bins with >0 counts | Bins with >2000 counts | High rate bins dominated by noise | Noise dominated (total time) | Noise dominated (detector-on time) | Marked lightcurve |
|---|---|---|---|---|---|---|---|
| A | 7515 | 6391 | 0 | 0 | 0.00% | 0.00% | 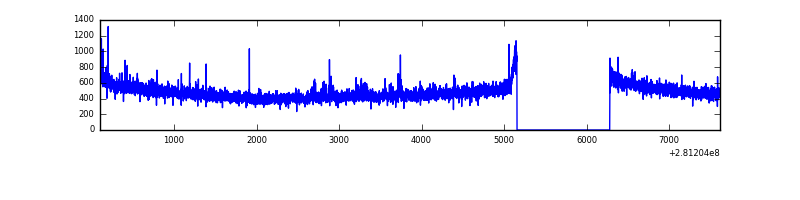 |
| B | 7515 | 6391 | 7 | 7 | 0.09% | 0.11% | 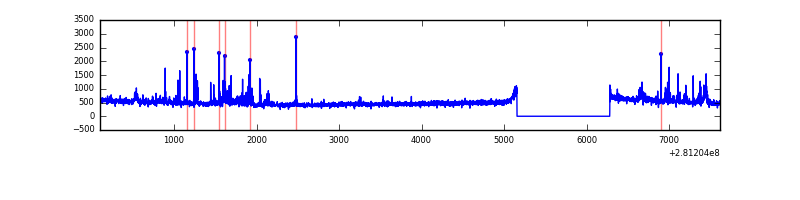 |
| C | 7515 | 6391 | 0 | 0 | 0.00% | 0.00% | 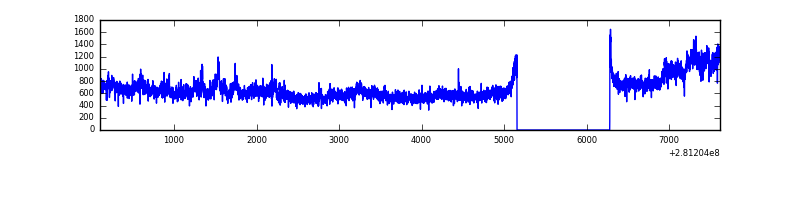 |
| D | 7515 | 6390 | 24 | 24 | 0.32% | 0.38% | 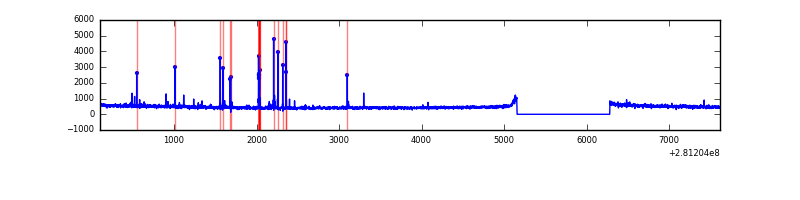 |
Top three noisy pixels from each quadrant. If the there are fewer than three noisy pixels in the level2.evt file, extra rows are filled as -1
| Pixel properties | Quadrant properties | ||||||
|---|---|---|---|---|---|---|---|
| Quadrant | DetID | PixID | Counts | Sigma | Mean | Median | Sigma |
| A | 12 | 189 | 34905 | 217.62 | 778 | 760 | 156.9 |
| A | 12 | 96 | 17615 | 107.42 | 778 | 760 | 156.9 |
| A | 0 | 226 | 7115 | 40.5 | 778 | 760 | 156.9 |
| B | 0 | 197 | 85127 | 573.26 | 775 | 757 | 147.2 |
| B | 0 | 189 | 80316 | 540.58 | 775 | 757 | 147.2 |
| B | 0 | 182 | 24046 | 158.24 | 775 | 757 | 147.2 |
| C | 3 | 233 | 1287974 | 7414.15 | 743 | 748 | 173.6 |
| C | 14 | 238 | 114573 | 655.61 | 743 | 748 | 173.6 |
| C | 13 | 61 | 5312 | 26.29 | 743 | 748 | 173.6 |
| D | 10 | 70 | 110450 | 598.72 | 759 | 737 | 183.2 |
| D | 2 | 234 | 29397 | 156.4 | 759 | 737 | 183.2 |
| D | 1 | 52 | 17928 | 93.81 | 759 | 737 | 183.2 |
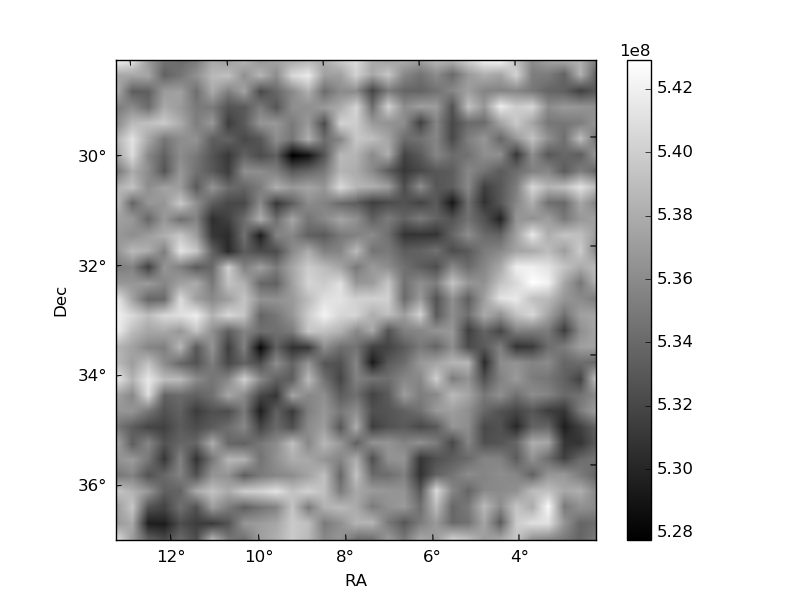
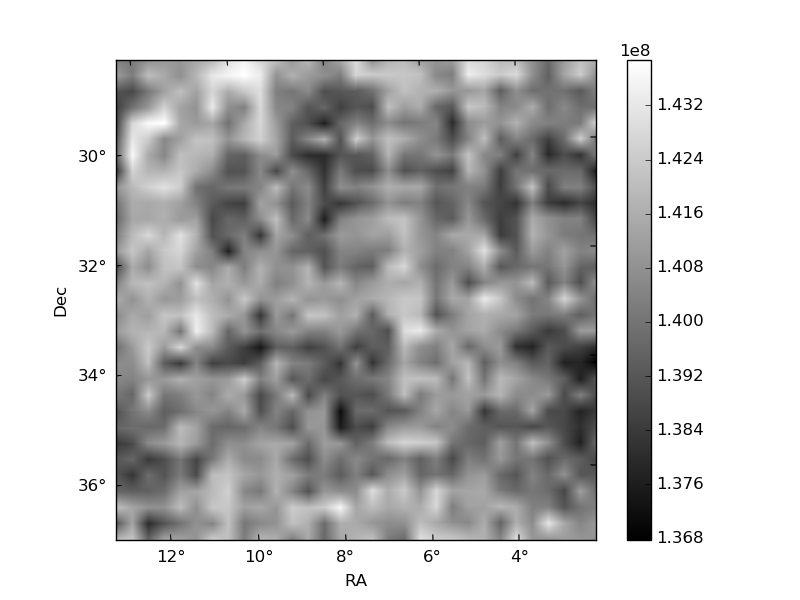
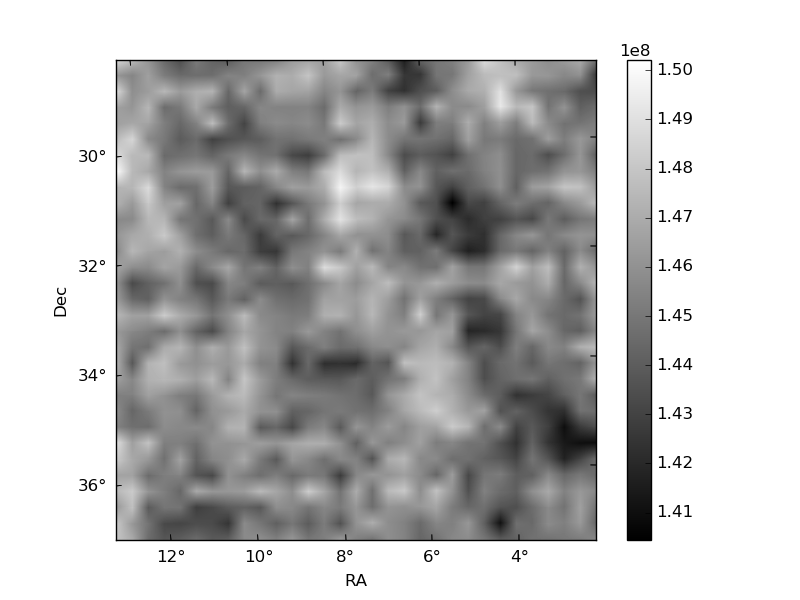
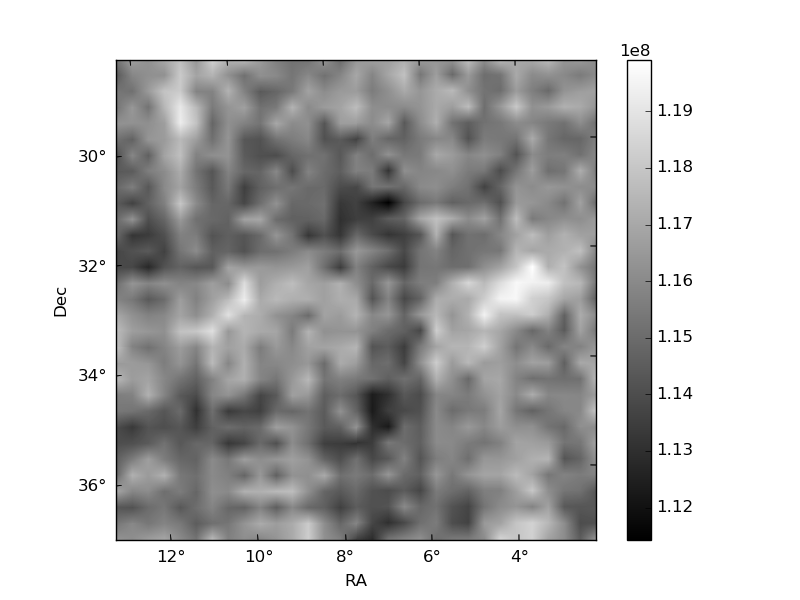
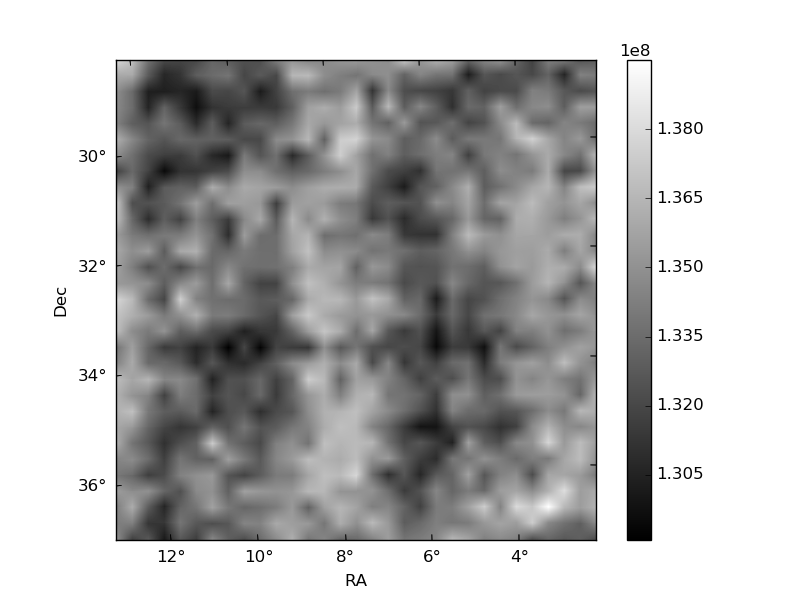
Histogram calculated using DETX and DETY for each event in the final _common_clean file
| Quadrant A | 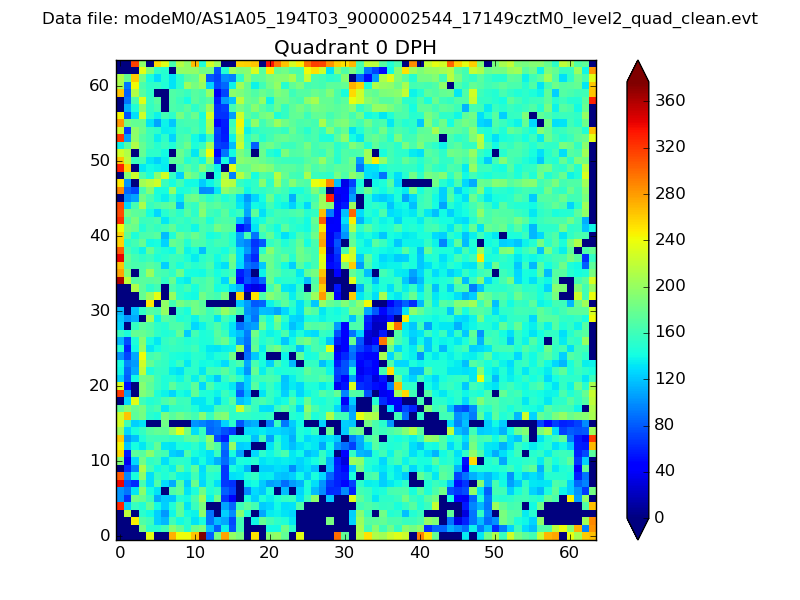 |
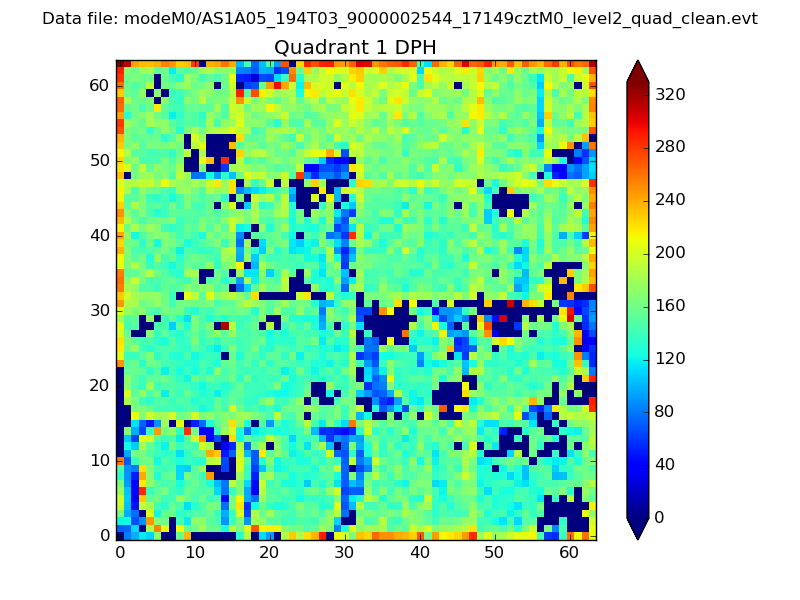 |
Quadrant B |
|---|---|---|---|
| Quadrant D |  |
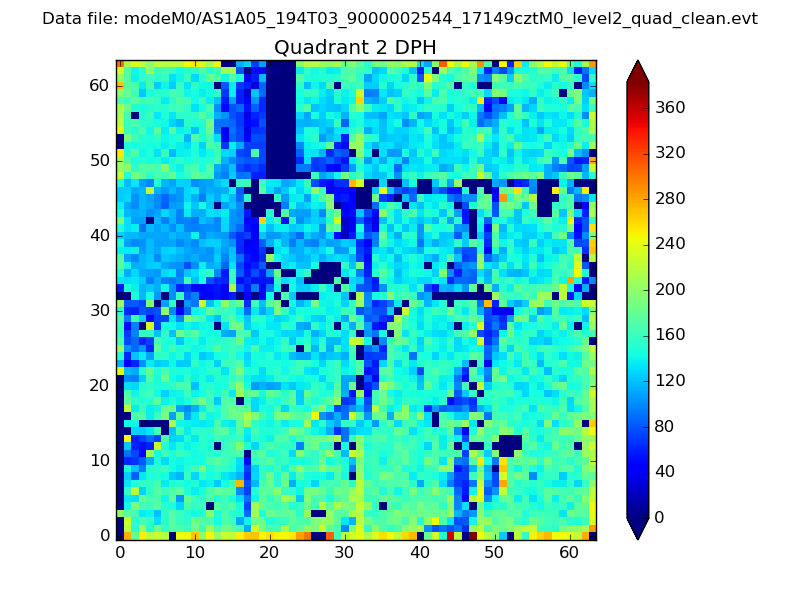 |
Quadrant C |
| Plot type | Count rate plots | Images |
|---|---|---|
| Comparison with Poisson distribution Blue bars denote a histogram of data divided into 1 sec bins. Red curve is a Poisson curve with rate = median count rate of data. |
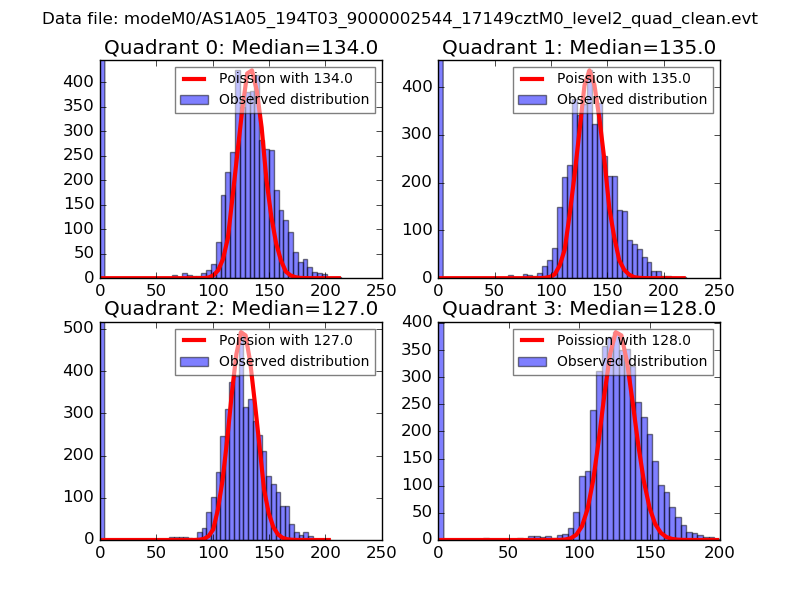 |
 |
| Quadrant-wise count rates Data is divided into 100 sec bins |
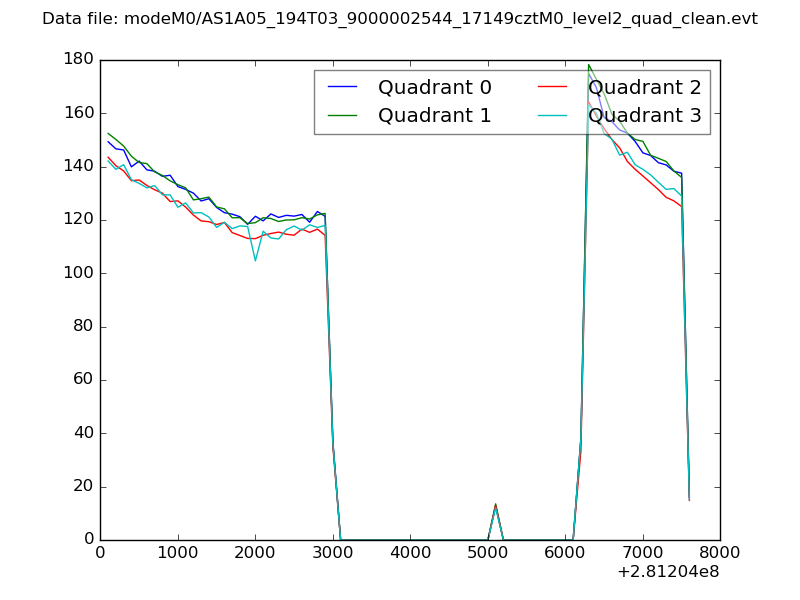 |
|
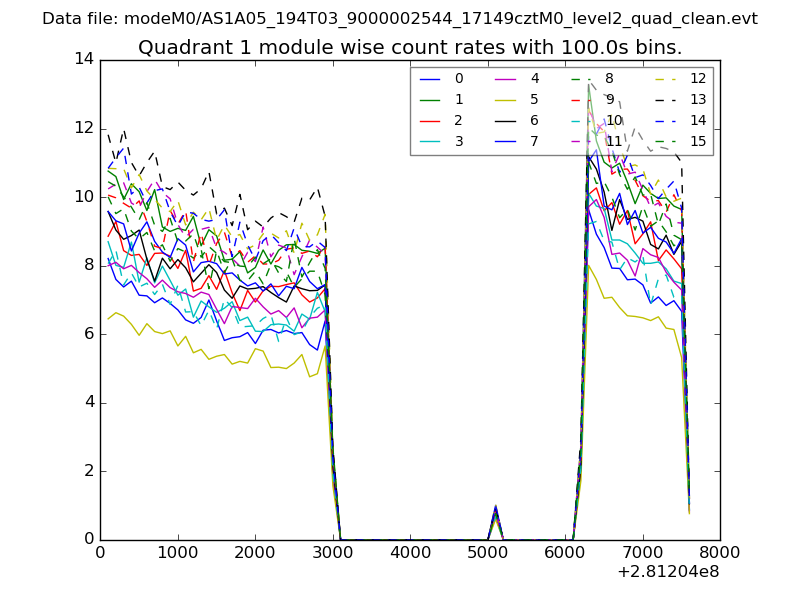
| Module-wise count rates for Quadrant A Data is divided into 100 sec bins |
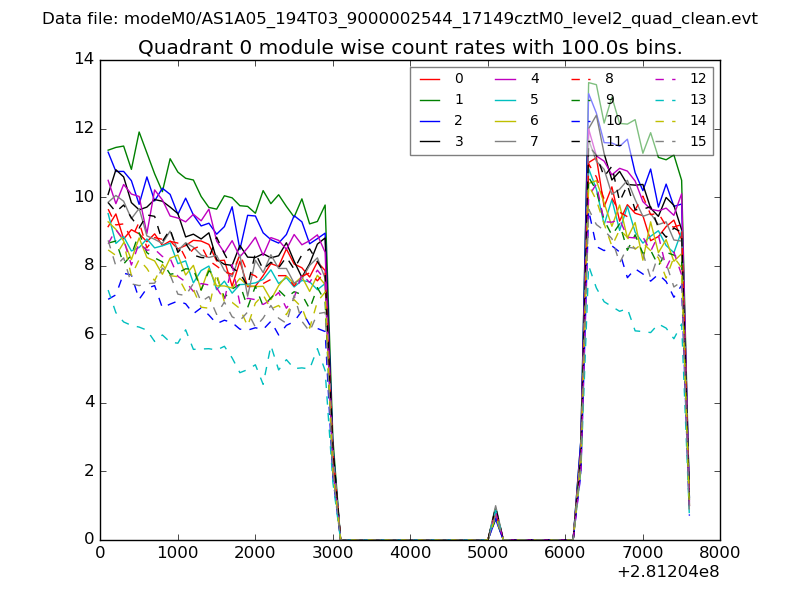 |
 |
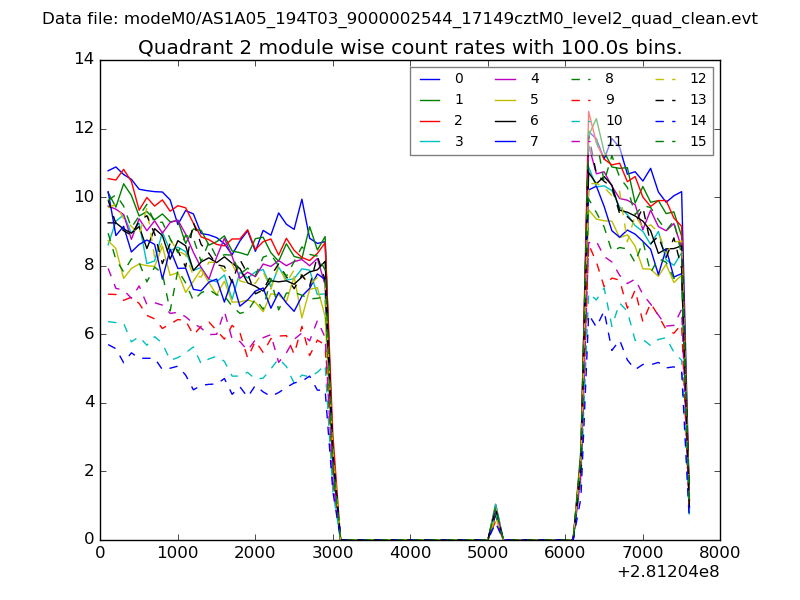
| Module-wise count rates for Quadrant B Data is divided into 100 sec bins |
 |
 |
| Module-wise count rates for Quadrant C Data is divided into 100 sec bins |
 |
 |
| Module-wise count rates for Quadrant D Data is divided into 100 sec bins |
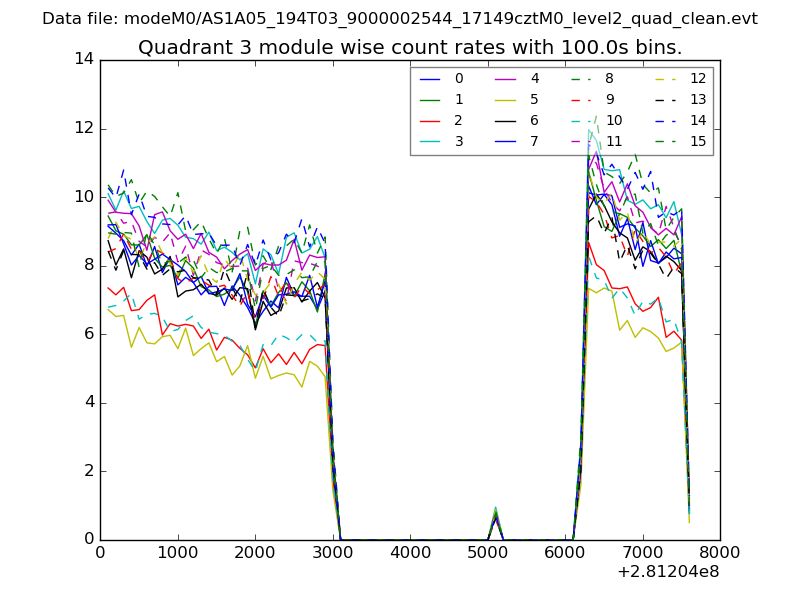 |
 |
| Parameter | Plot |
|---|---|
| CZT HV Monitor | 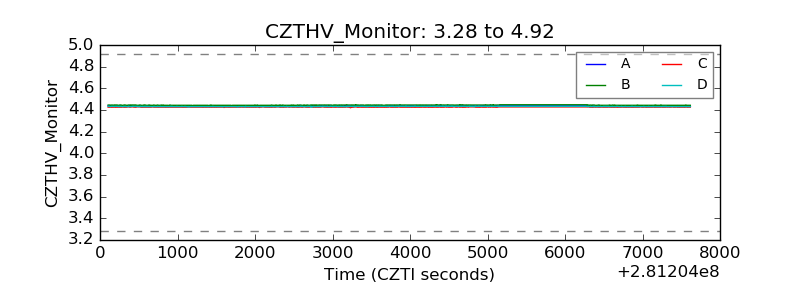 |
| D_VDD | 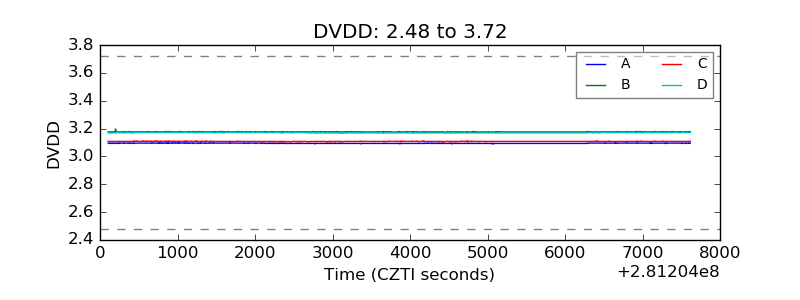 |
| Temperature 1 | 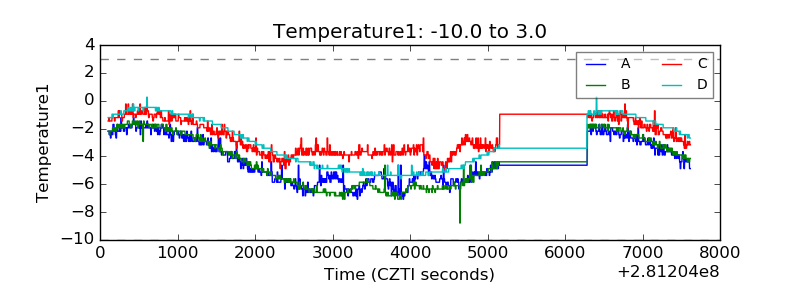 |
| Veto HV Monitor | 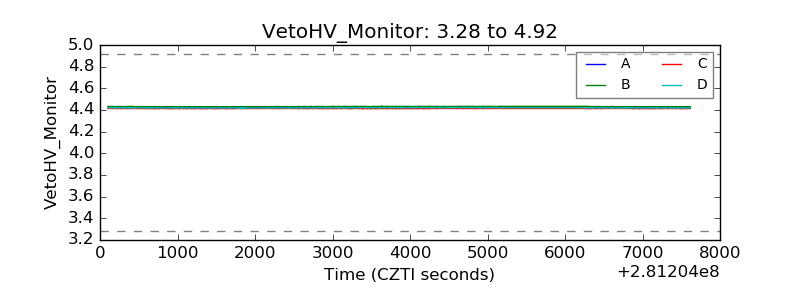 |
| Veto LLD | 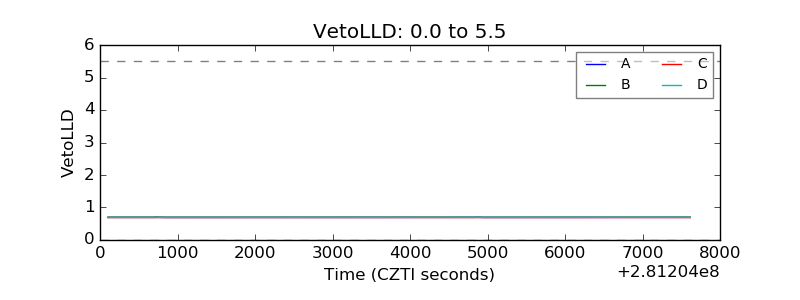 |
| Alpha Counter |  |
| _CPM_Rate | 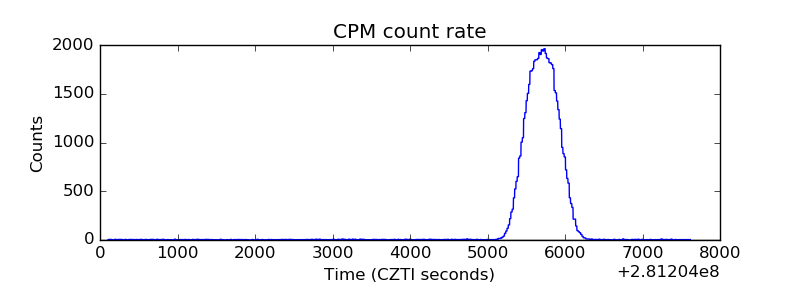 |
| CZT Counter |  |
| +2.5 Volts monitor |  |
| +5 Volts monitor |  |
| _ROLL_ROT | 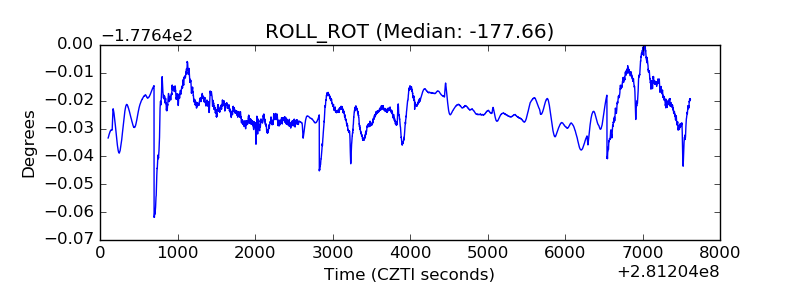 |
| _Roll_DEC | 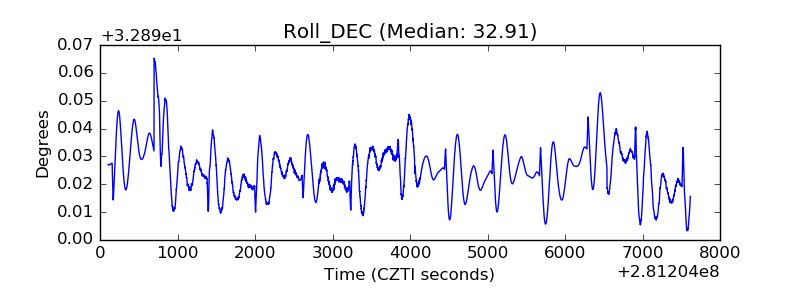 |
| _Roll_RA |  |
| Veto Counter | 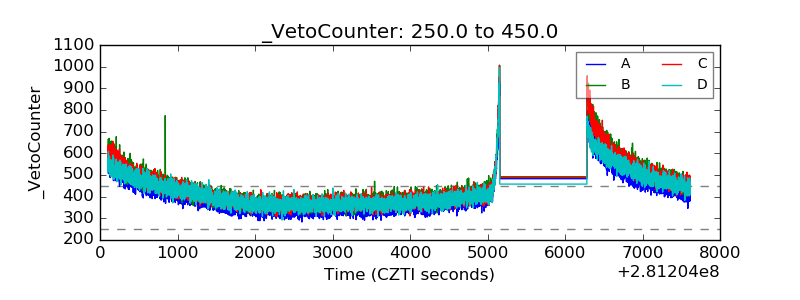 |