| Param | Original file | Final file |
|---|---|---|
| Filename | modeM0/AS1A05_194T03_9000002544_17150cztM0_level2.evt | modeM0/AS1A05_194T03_9000002544_17150cztM0_level2_quad_clean.evt |
| Size (bytes) | 526,173,120 | 91,198,080 |
| Size | 501.8 MB | 87.0 MB |
| Events in quadrant A | 3,067,195 | 599,336 |
| Events in quadrant B | 3,277,981 | 608,055 |
| Events in quadrant C | 6,128,064 | 555,578 |
| Events in quadrant D | 3,040,848 | 564,863 |
| Mode M9 | |||
|---|---|---|---|
| Quadrant | BADHDUFLAG | Total packets | Discarded packets |
| A | 0 | 17 | 0 |
| B | 0 | 18 | 0 |
| C | 0 | 18 | 0 |
| D | 0 | 18 | 0 |
| Mode SS | |||
|---|---|---|---|
| Quadrant | BADHDUFLAG | Total packets | Discarded packets |
| A | 0 | 128 | 0 |
| B | 0 | 128 | 0 |
| C | 0 | 128 | 0 |
| D | 0 | 128 | 0 |
| Mode M0 | |||
|---|---|---|---|
| Quadrant | BADHDUFLAG | Total packets | Discarded packets |
| A | 0 | 13190 | 2 |
| B | 0 | 13926 | 2 |
| C | 0 | 22649 | 2 |
| D | 0 | 13250 | 2 |
| Quadrant | Total seconds | Saturated seconds | Saturation percentage |
|---|---|---|---|
| A | 6210 | 32 | 0.515298% |
| B | 6210 | 55 | 0.885668% |
| C | 6210 | 276 | 4.444444% |
| D | 6210 | 46 | 0.740741% |
Noise dominated data is calculated using 1-second bins in cleaned event files. If a bin has >2000 counts, and if more than 50% of those come from <1% of pixels, then it is considered to be noise-dominated and hence unusable.
| Quadrant | # 1 sec bins | Bins with >0 counts | Bins with >2000 counts | High rate bins dominated by noise | Noise dominated (total time) | Noise dominated (detector-on time) | Marked lightcurve |
|---|---|---|---|---|---|---|---|
| A | 7445 | 6211 | 0 | 0 | 0.00% | 0.00% | 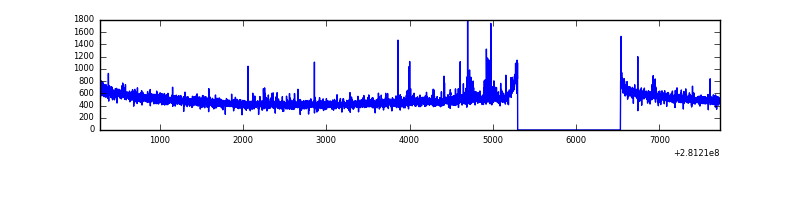 |
| B | 7445 | 6211 | 5 | 5 | 0.07% | 0.08% | 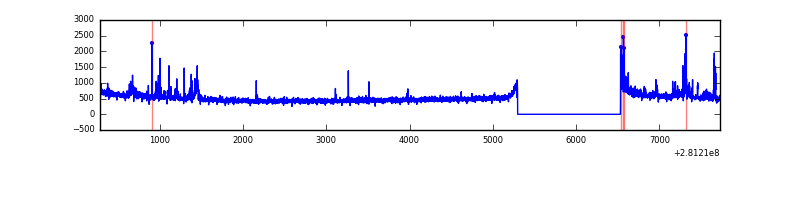 |
| C | 7445 | 6210 | 20 | 20 | 0.27% | 0.32% | 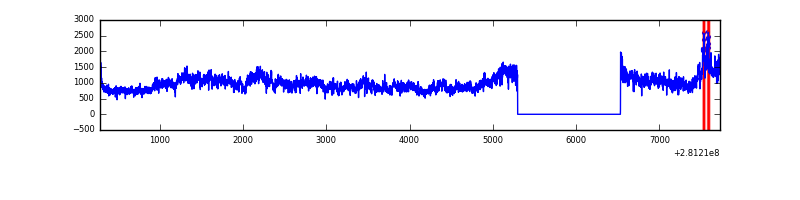 |
| D | 7445 | 6211 | 22 | 22 | 0.30% | 0.35% | 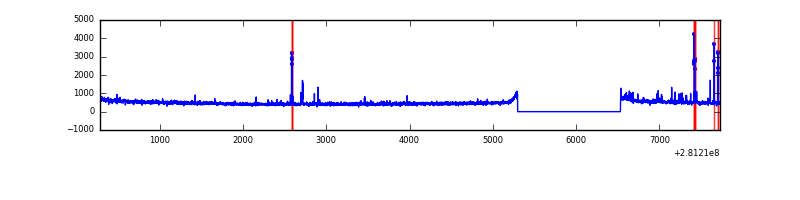 |
Top three noisy pixels from each quadrant. If the there are fewer than three noisy pixels in the level2.evt file, extra rows are filled as -1
| Pixel properties | Quadrant properties | ||||||
|---|---|---|---|---|---|---|---|
| Quadrant | DetID | PixID | Counts | Sigma | Mean | Median | Sigma |
| A | 4 | 2 | 41013 | 258.02 | 778 | 762 | 156.0 |
| A | 12 | 189 | 32838 | 205.62 | 778 | 762 | 156.0 |
| A | 0 | 226 | 6982 | 39.87 | 778 | 762 | 156.0 |
| B | 0 | 189 | 99120 | 672.05 | 779 | 760 | 146.4 |
| B | 0 | 197 | 77171 | 522.08 | 779 | 760 | 146.4 |
| B | 6 | 36 | 16466 | 107.31 | 779 | 760 | 146.4 |
| C | 3 | 233 | 3124449 | 18096.97 | 739 | 745 | 172.6 |
| C | 14 | 238 | 114436 | 658.66 | 739 | 745 | 172.6 |
| C | 13 | 61 | 5289 | 26.33 | 739 | 745 | 172.6 |
| D | 1 | 52 | 90023 | 485.09 | 759 | 737 | 184.1 |
| D | 2 | 234 | 29153 | 154.38 | 759 | 737 | 184.1 |
| D | 10 | 70 | 28996 | 153.53 | 759 | 737 | 184.1 |
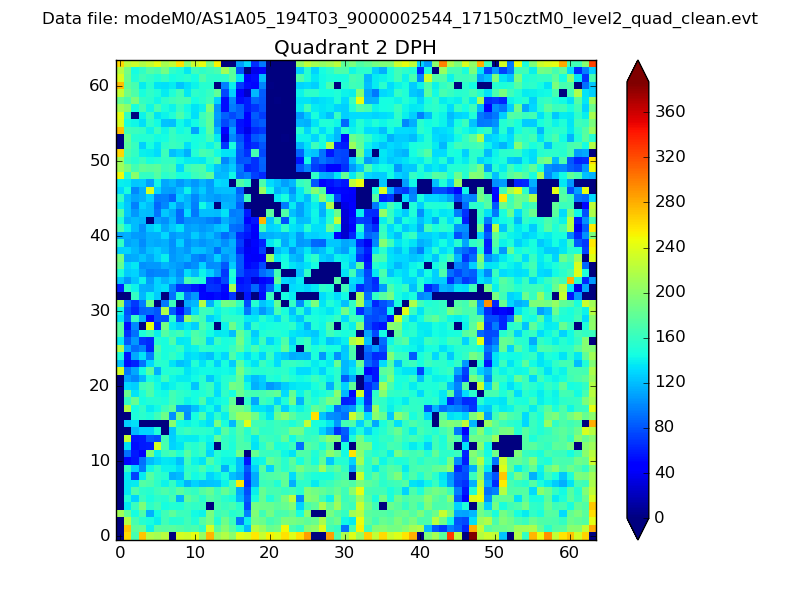
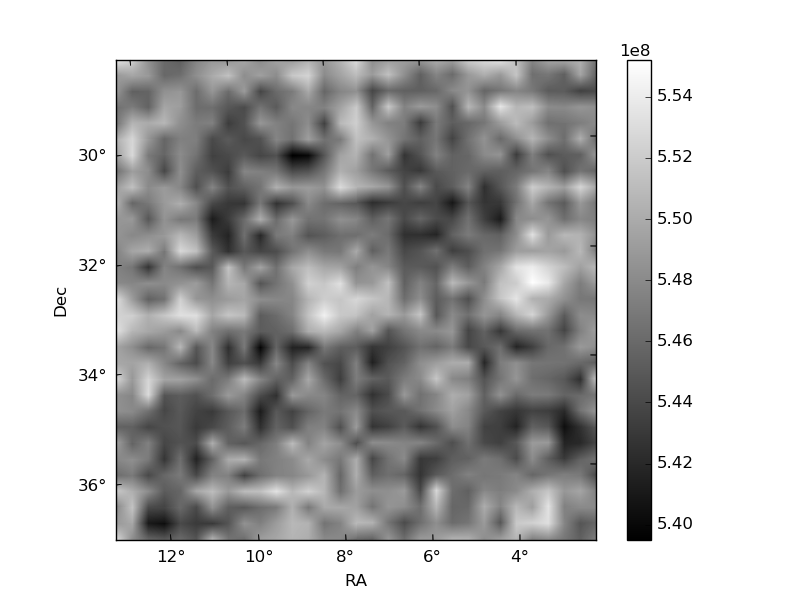
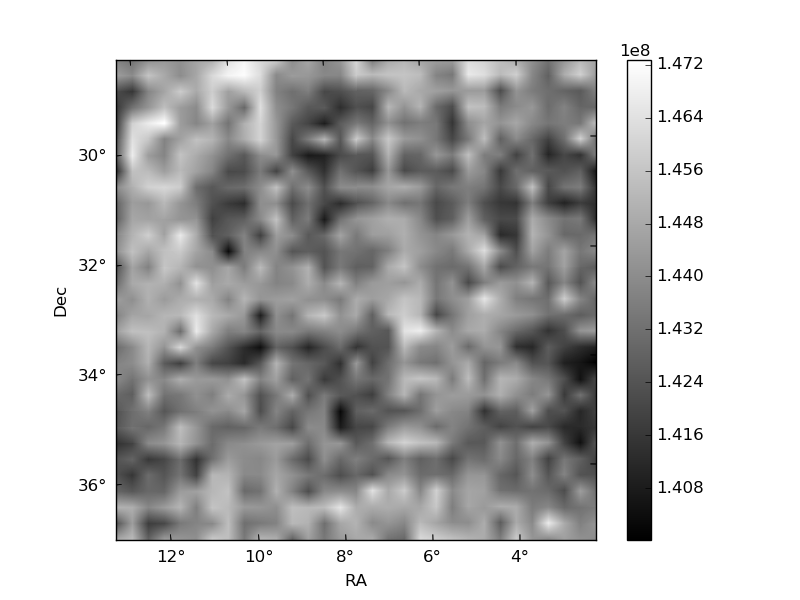
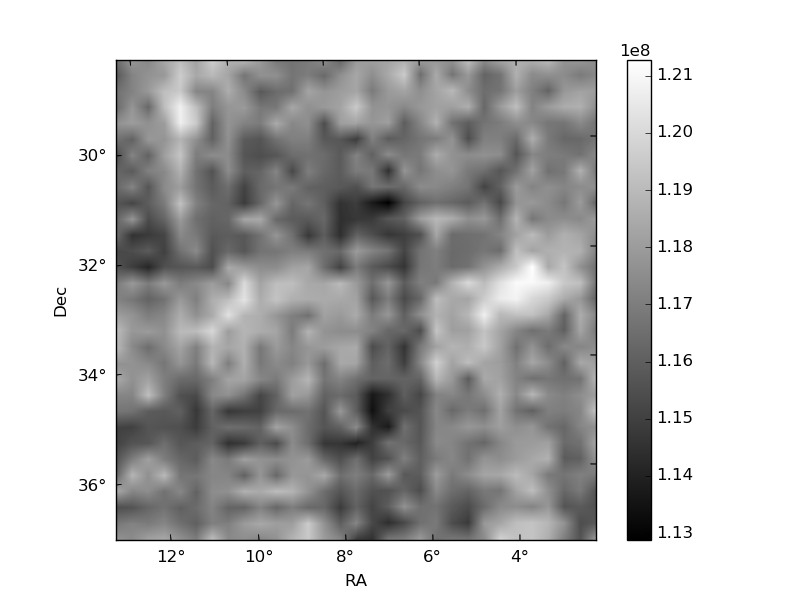
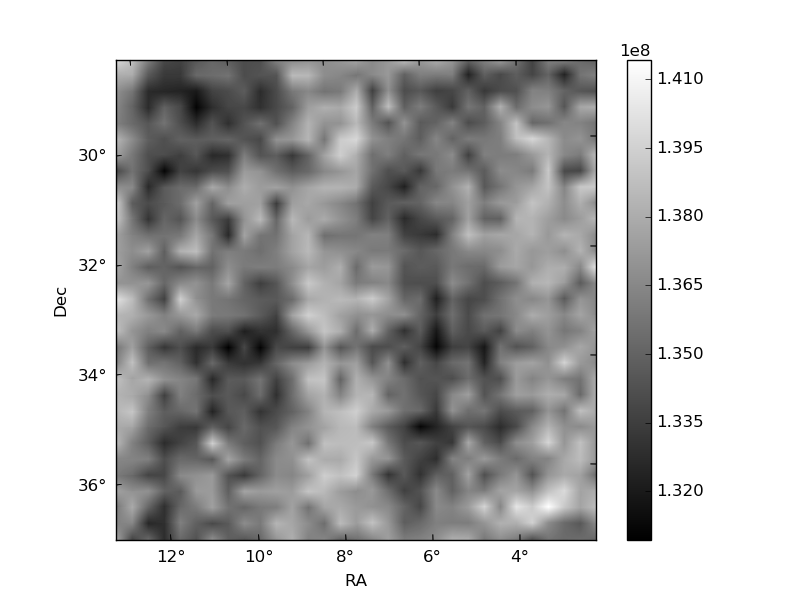
Histogram calculated using DETX and DETY for each event in the final _common_clean file
| Quadrant A | 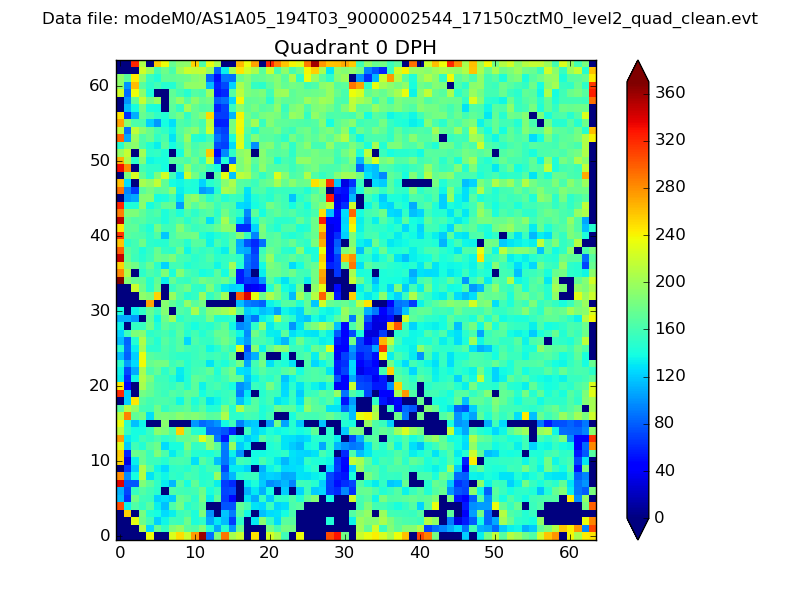 |
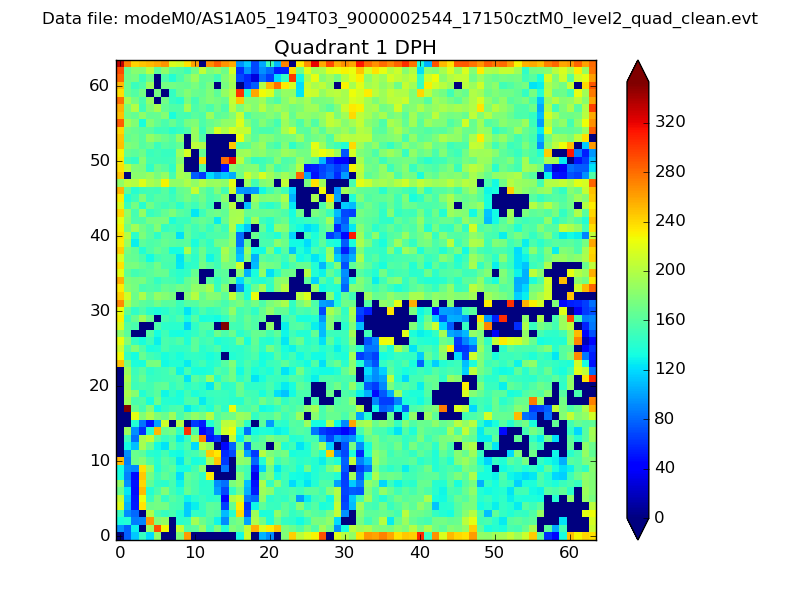 |
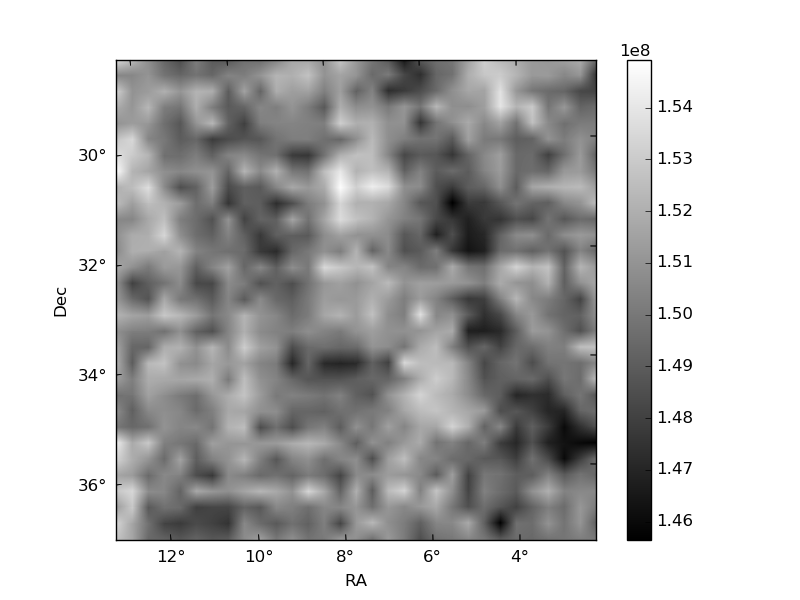
Quadrant B |
|---|---|---|---|
| Quadrant D | 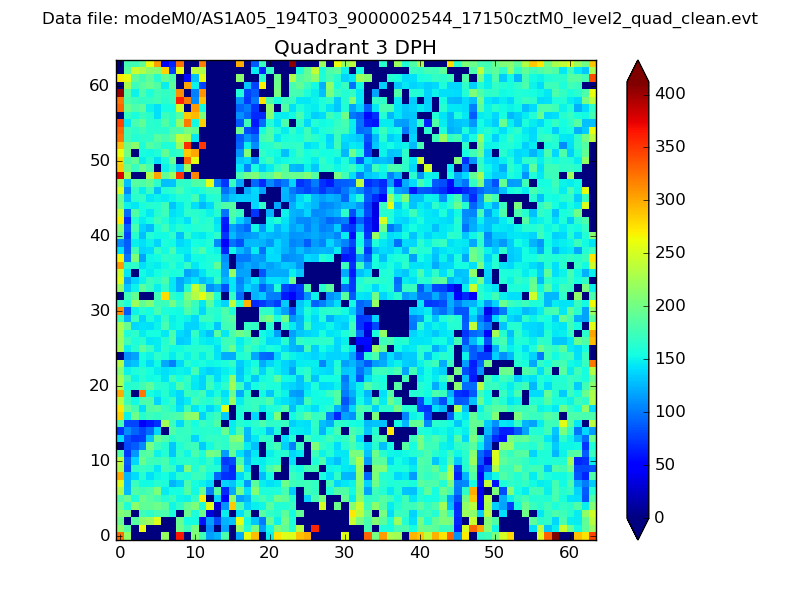 |
 |
Quadrant C |
| Plot type | Count rate plots | Images |
|---|---|---|
| Comparison with Poisson distribution Blue bars denote a histogram of data divided into 1 sec bins. Red curve is a Poisson curve with rate = median count rate of data. |
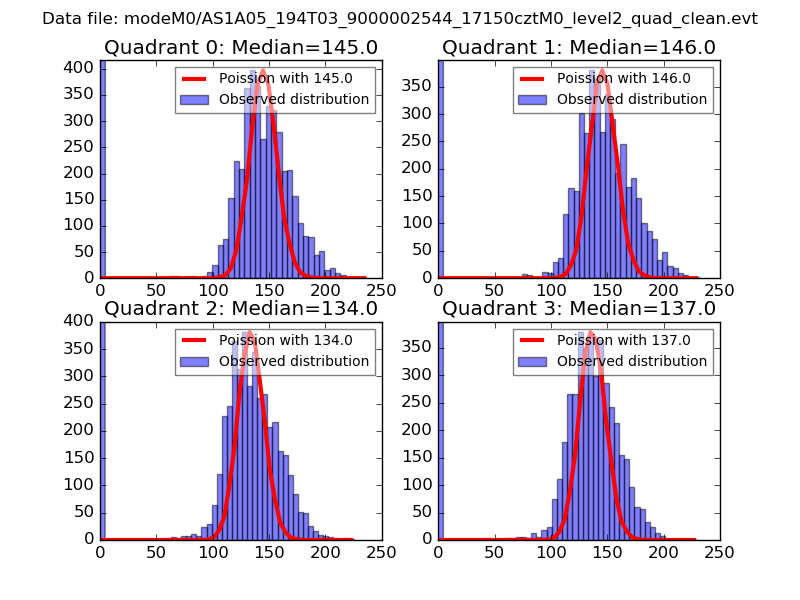 |
 |
| Quadrant-wise count rates Data is divided into 100 sec bins |
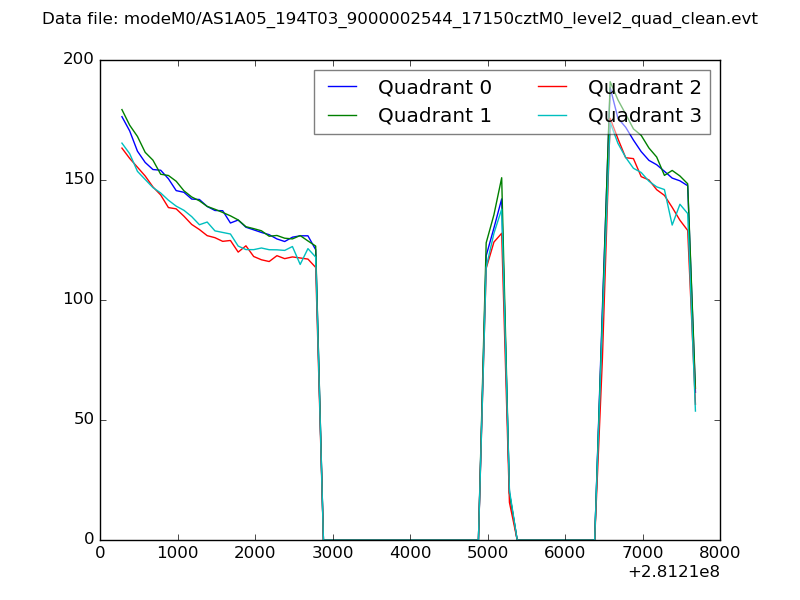 |
|
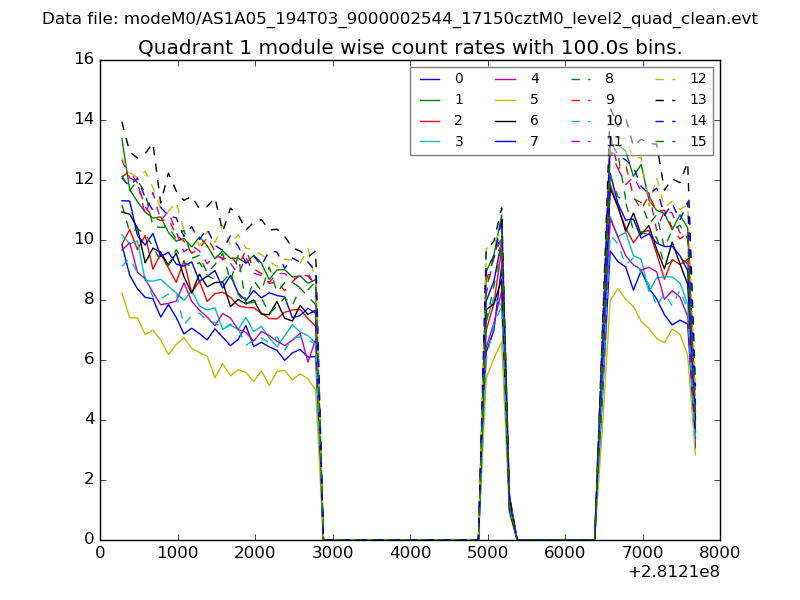
| Module-wise count rates for Quadrant A Data is divided into 100 sec bins |
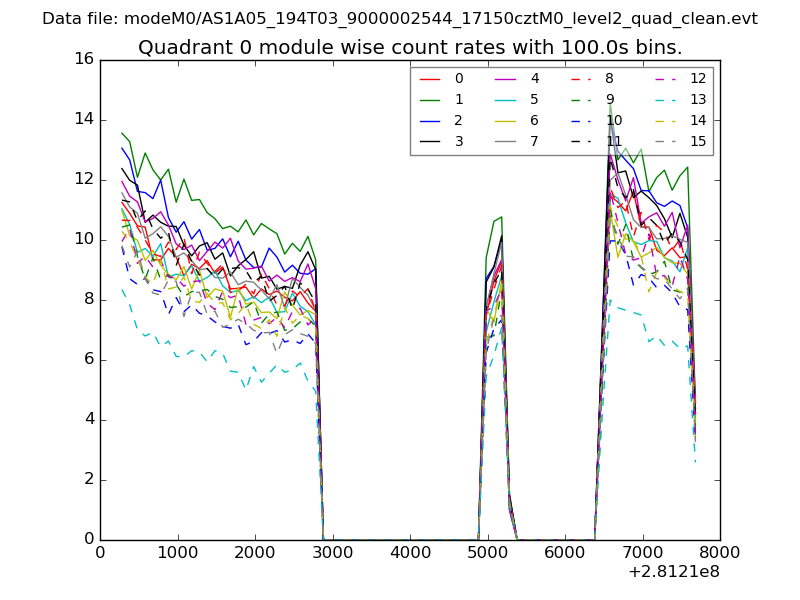 |
 |
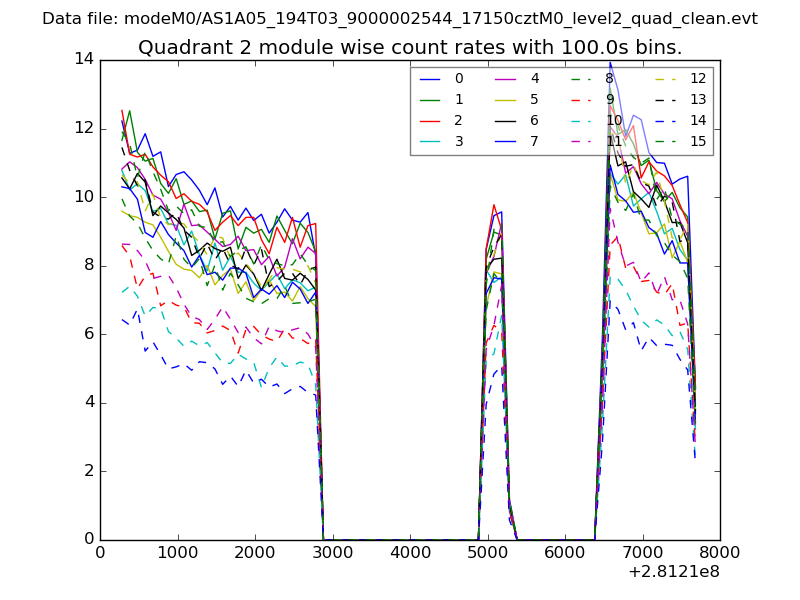
| Module-wise count rates for Quadrant B Data is divided into 100 sec bins |
 |
 |
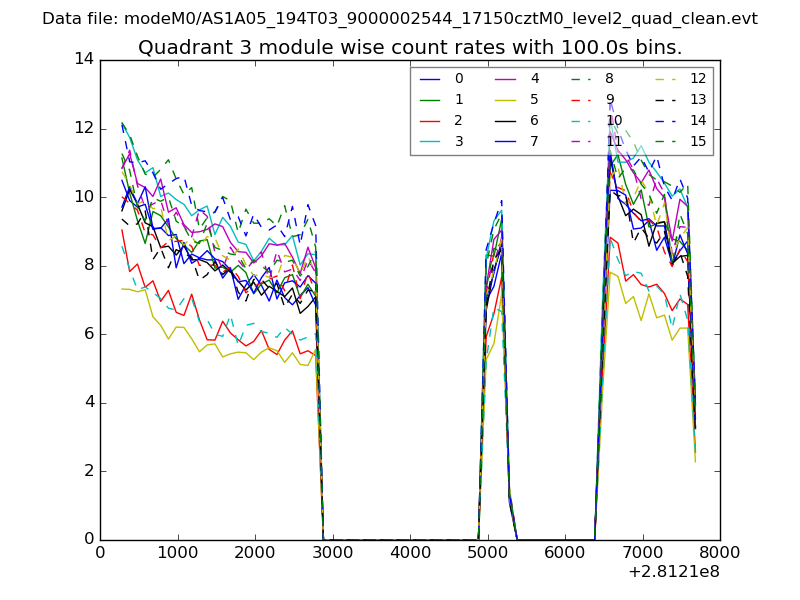
| Module-wise count rates for Quadrant C Data is divided into 100 sec bins |
 |
 |
| Module-wise count rates for Quadrant D Data is divided into 100 sec bins |
 |
 |
| Parameter | Plot |
|---|---|
| CZT HV Monitor | 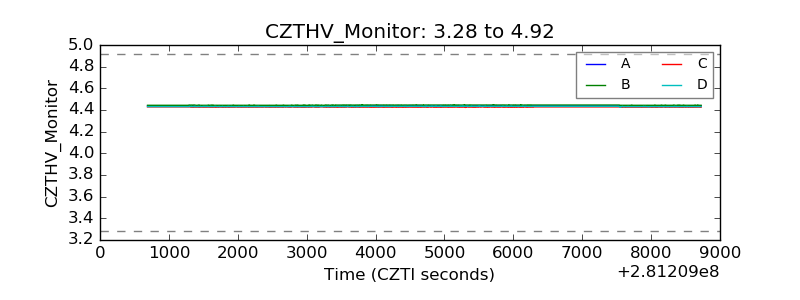 |
| D_VDD | 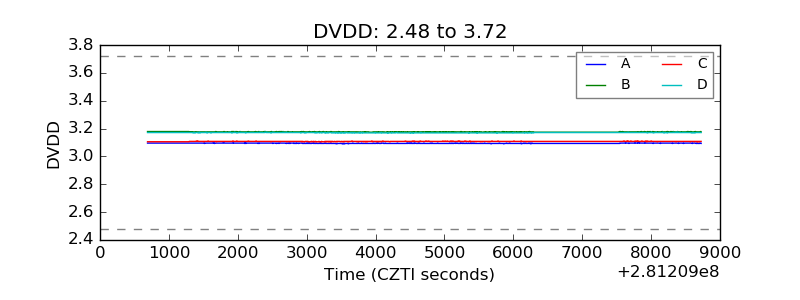 |
| Temperature 1 | 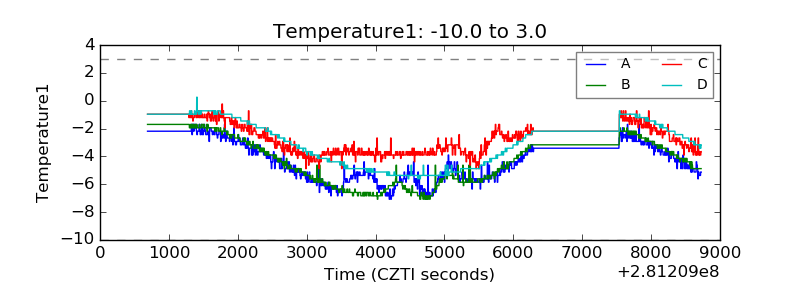 |
| Veto HV Monitor |  |
| Veto LLD | 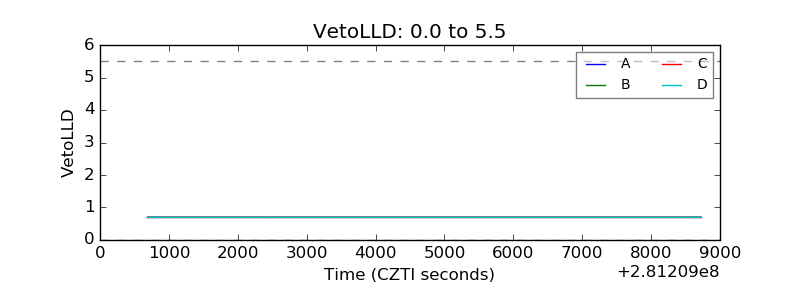 |
| Alpha Counter | 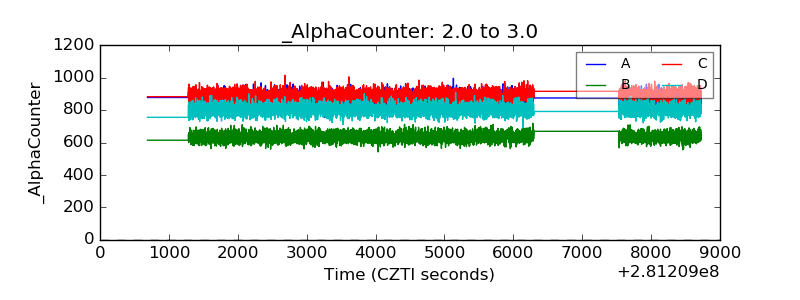 |
| _CPM_Rate | 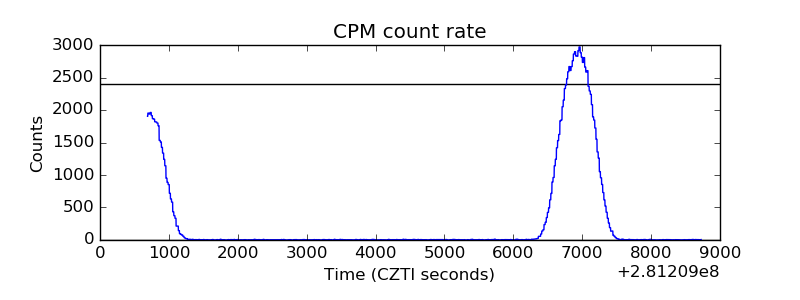 |
| CZT Counter | 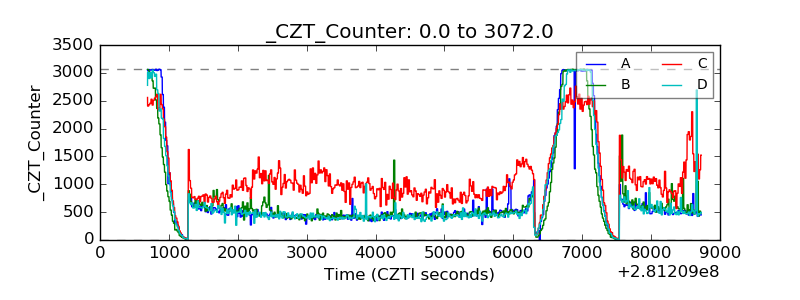 |
| +2.5 Volts monitor |  |
| +5 Volts monitor |  |
| _ROLL_ROT | 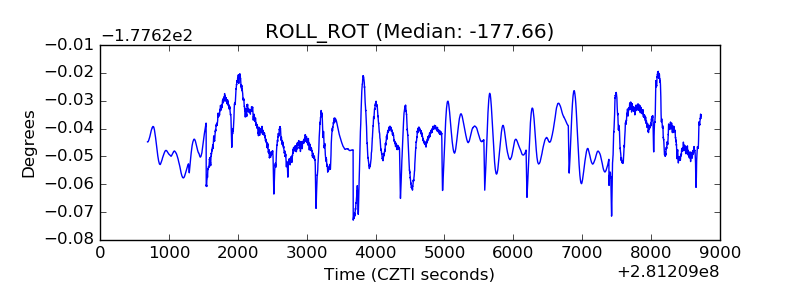 |
| _Roll_DEC | 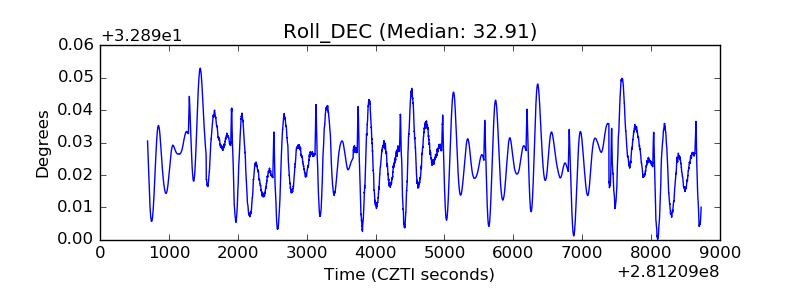 |
| _Roll_RA | 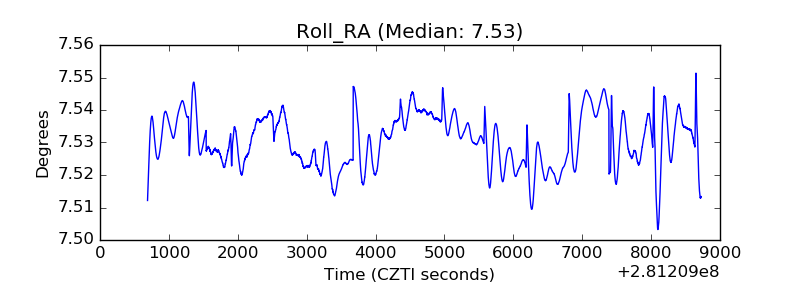 |
| Veto Counter | 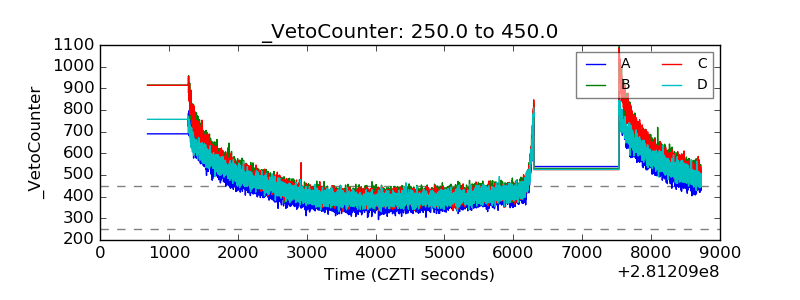 |