| Param | Original file | Final file |
|---|---|---|
| Filename | modeM0/AS1A05_194T03_9000002544_17153cztM0_level2.evt | modeM0/AS1A05_194T03_9000002544_17153cztM0_level2_quad_clean.evt |
| Size (bytes) | 371,554,560 | 54,048,960 |
| Size | 354.3 MB | 51.5 MB |
| Events in quadrant A | 2,126,907 | 341,263 |
| Events in quadrant B | 2,188,533 | 352,809 |
| Events in quadrant C | 4,307,411 | 318,703 |
| Events in quadrant D | 2,326,008 | 309,486 |
| Mode M9 | |||
|---|---|---|---|
| Quadrant | BADHDUFLAG | Total packets | Discarded packets |
| A | 0 | 7 | 0 |
| B | 0 | 8 | 0 |
| C | 0 | 8 | 0 |
| D | 0 | 8 | 0 |
| Mode SS | |||
|---|---|---|---|
| Quadrant | BADHDUFLAG | Total packets | Discarded packets |
| A | 0 | 90 | 0 |
| B | 0 | 90 | 0 |
| C | 0 | 90 | 0 |
| D | 0 | 90 | 0 |
| Mode M0 | |||
|---|---|---|---|
| Quadrant | BADHDUFLAG | Total packets | Discarded packets |
| A | 0 | 9102 | 1 |
| B | 0 | 9281 | 1 |
| C | 0 | 16013 | 1 |
| D | 0 | 10009 | 1 |
| Quadrant | Total seconds | Saturated seconds | Saturation percentage |
|---|---|---|---|
| A | 4462 | 7 | 0.156880% |
| B | 4462 | 5 | 0.112057% |
| C | 4462 | 162 | 3.630659% |
| D | 4462 | 142 | 3.182429% |
Noise dominated data is calculated using 1-second bins in cleaned event files. If a bin has >2000 counts, and if more than 50% of those come from <1% of pixels, then it is considered to be noise-dominated and hence unusable.
| Quadrant | # 1 sec bins | Bins with >0 counts | Bins with >2000 counts | High rate bins dominated by noise | Noise dominated (total time) | Noise dominated (detector-on time) | Marked lightcurve |
|---|---|---|---|---|---|---|---|
| A | 4462 | 4462 | 0 | 0 | 0.00% | 0.00% | 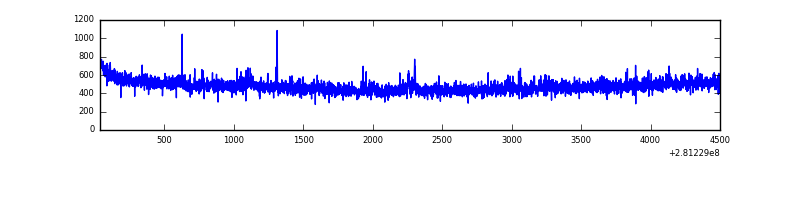 |
| B | 4462 | 4462 | 0 | 0 | 0.00% | 0.00% | 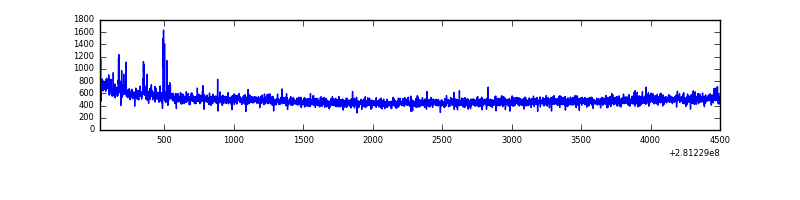 |
| C | 4462 | 4462 | 12 | 12 | 0.27% | 0.27% | 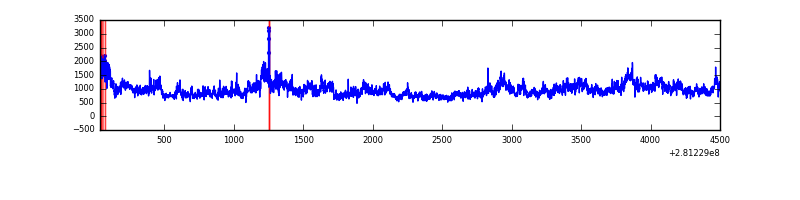 |
| D | 4462 | 4462 | 130 | 130 | 2.91% | 2.91% | 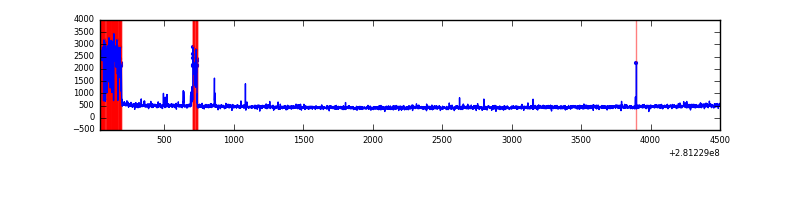 |
Top three noisy pixels from each quadrant. If the there are fewer than three noisy pixels in the level2.evt file, extra rows are filled as -1
| Pixel properties | Quadrant properties | ||||||
|---|---|---|---|---|---|---|---|
| Quadrant | DetID | PixID | Counts | Sigma | Mean | Median | Sigma |
| A | 12 | 189 | 37939 | 343.86 | 543 | 532 | 108.8 |
| A | 0 | 226 | 4752 | 38.79 | 543 | 532 | 108.8 |
| A | 12 | 194 | 3924 | 31.18 | 543 | 532 | 108.8 |
| B | 0 | 197 | 15063 | 140.29 | 551 | 538 | 103.5 |
| B | 12 | 111 | 11984 | 110.55 | 551 | 538 | 103.5 |
| B | 11 | 111 | 10185 | 93.18 | 551 | 538 | 103.5 |
| C | 3 | 233 | 2195013 | 18026.94 | 520 | 526 | 121.7 |
| C | 14 | 238 | 81322 | 663.71 | 520 | 526 | 121.7 |
| C | 13 | 61 | 3621 | 25.42 | 520 | 526 | 121.7 |
| D | 15 | 0 | 286371 | 2277.8 | 514 | 500 | 125.5 |
| D | 7 | 38 | 59377 | 469.13 | 514 | 500 | 125.5 |
| D | 2 | 152 | 17468 | 135.2 | 514 | 500 | 125.5 |
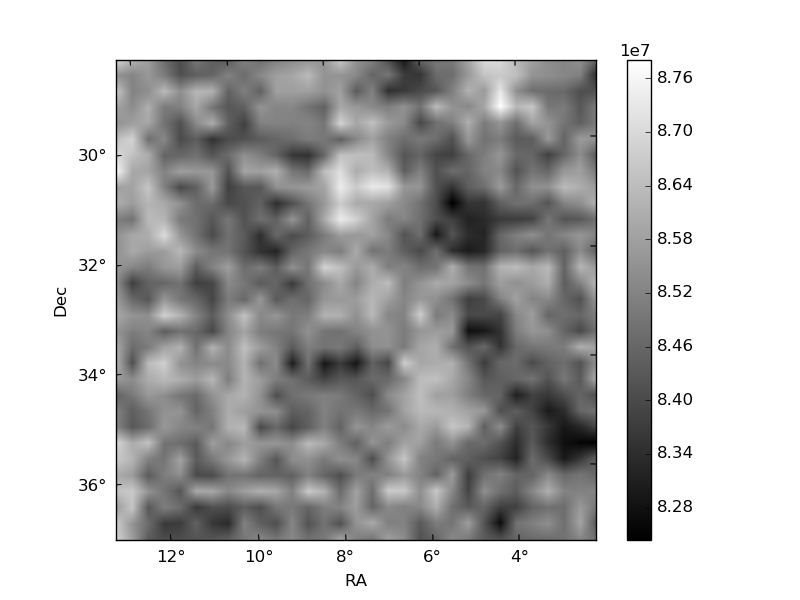
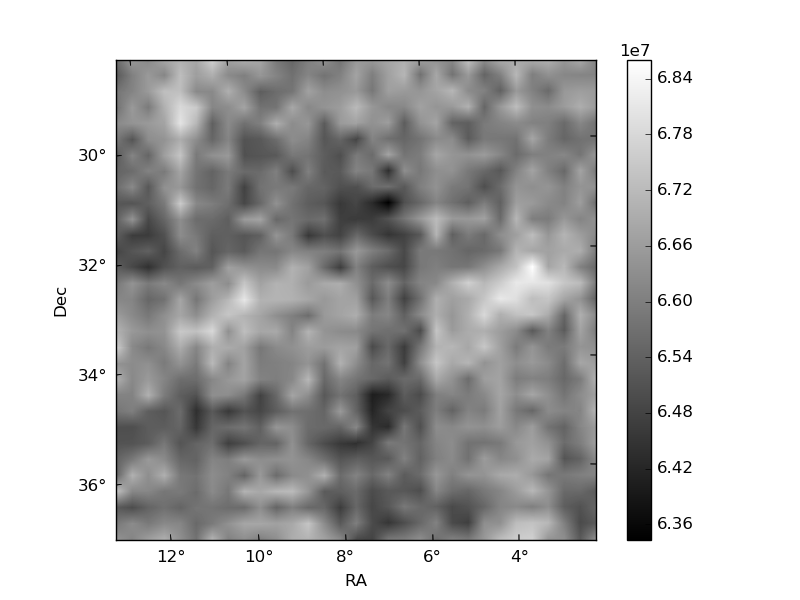
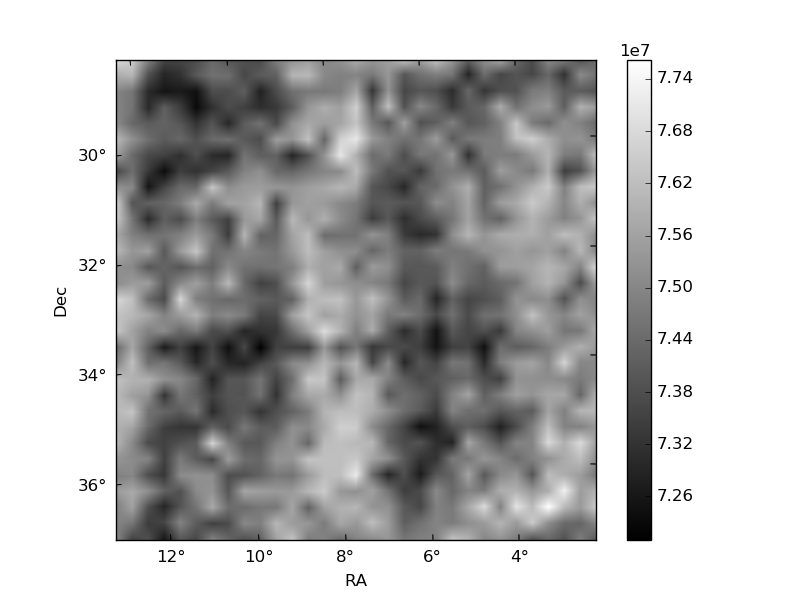
Histogram calculated using DETX and DETY for each event in the final _common_clean file
| Quadrant A | 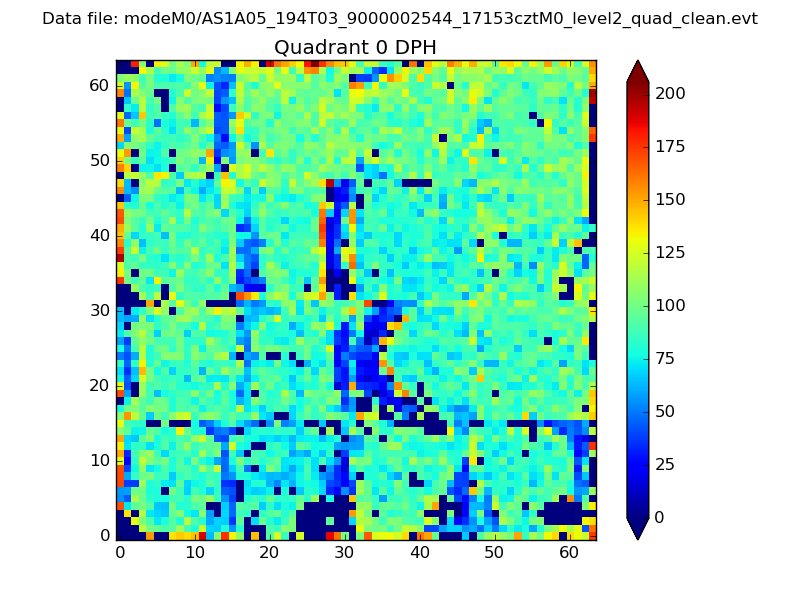 |
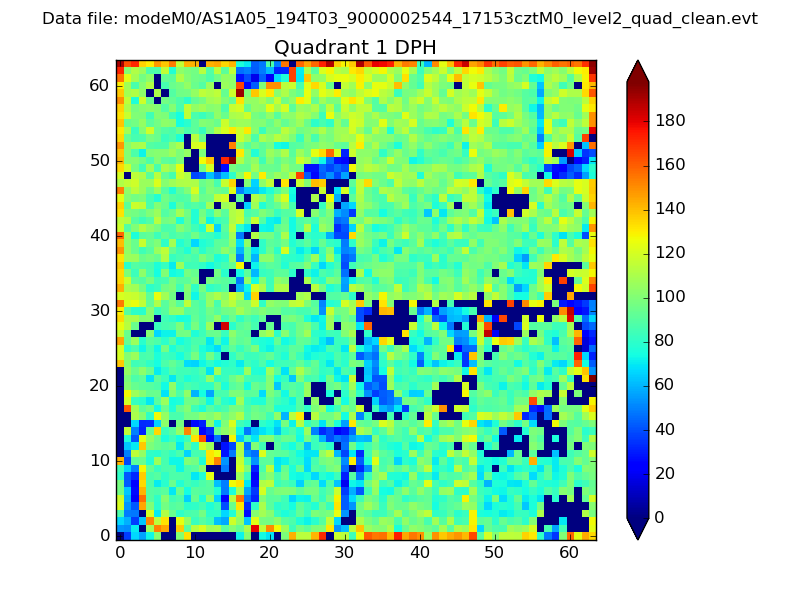 |
Quadrant B |
|---|---|---|---|
| Quadrant D | 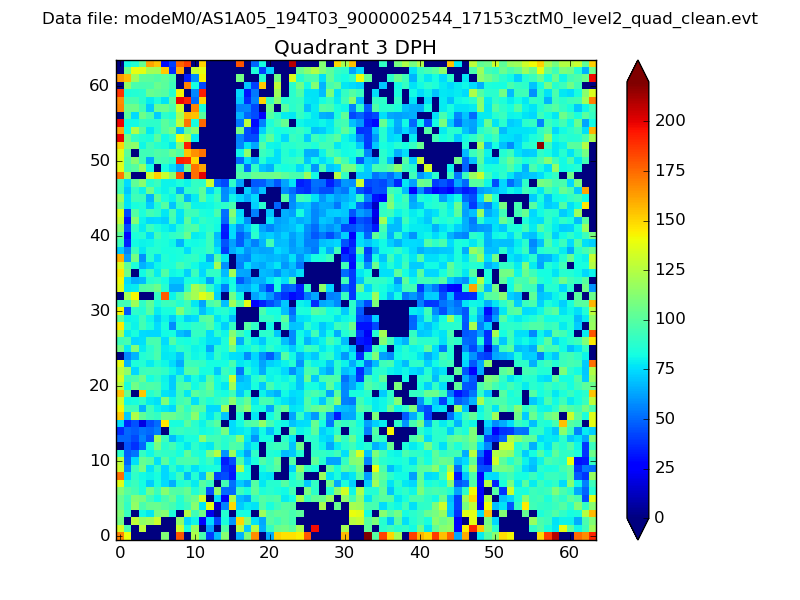 |
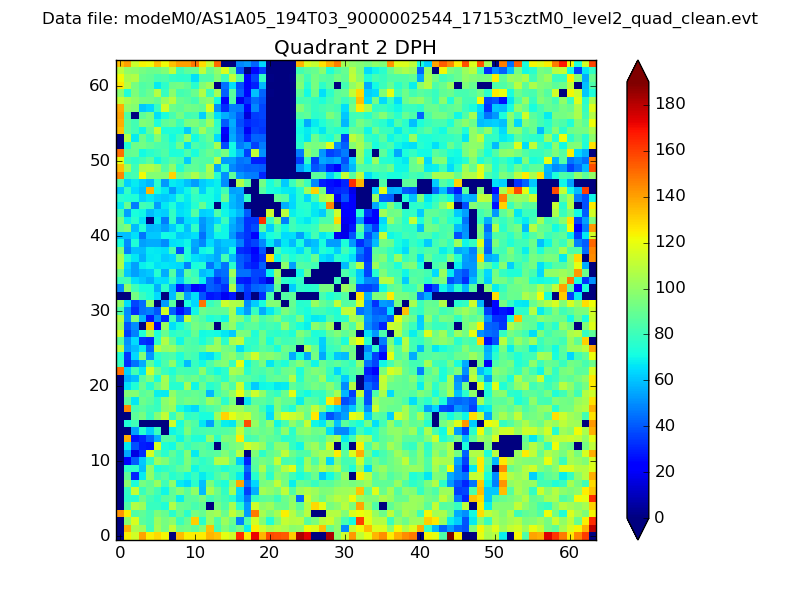 |
Quadrant C |
| Plot type | Count rate plots | Images |
|---|---|---|
| Comparison with Poisson distribution Blue bars denote a histogram of data divided into 1 sec bins. Red curve is a Poisson curve with rate = median count rate of data. |
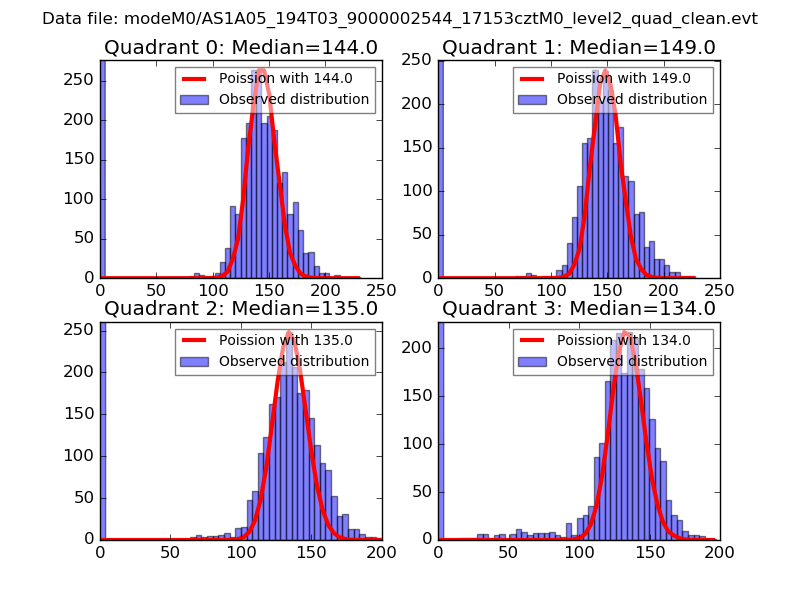 |
 |
| Quadrant-wise count rates Data is divided into 100 sec bins |
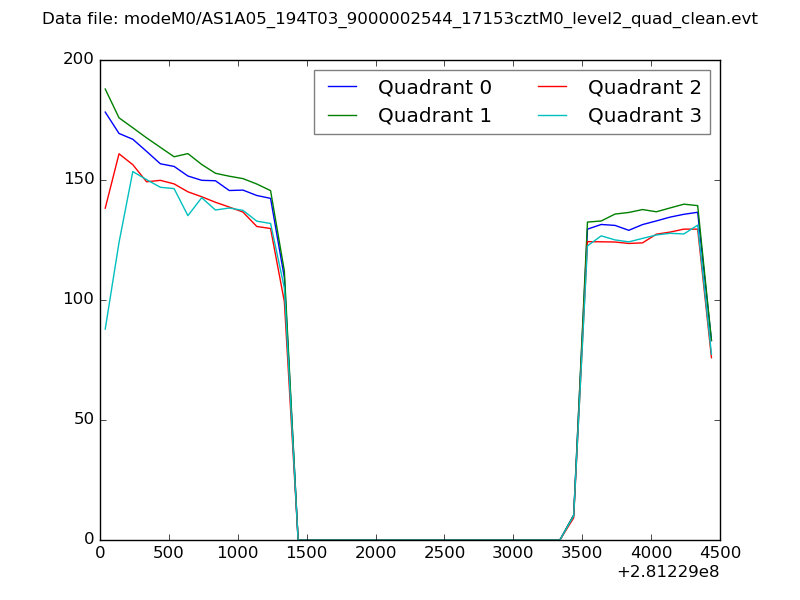 |
|
| Module-wise count rates for Quadrant A Data is divided into 100 sec bins |
 |
 |
| Module-wise count rates for Quadrant B Data is divided into 100 sec bins |
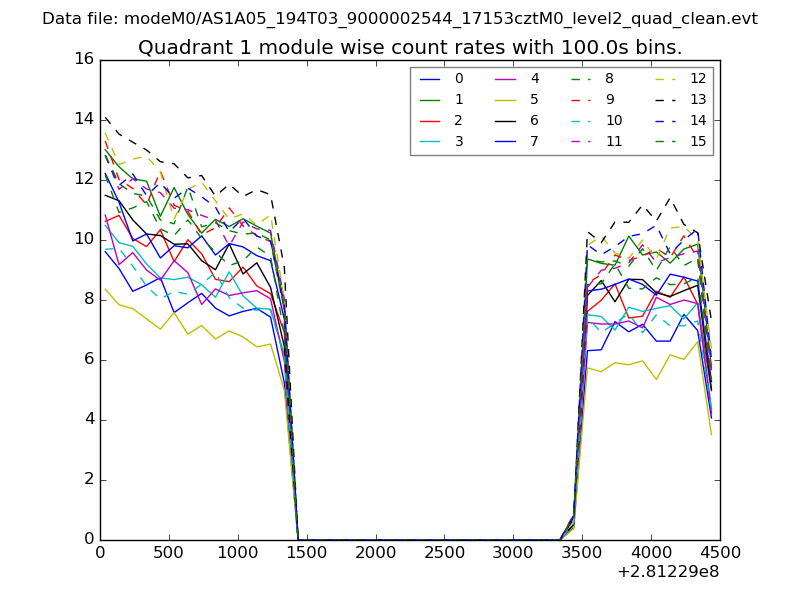 |
 |
| Module-wise count rates for Quadrant C Data is divided into 100 sec bins |
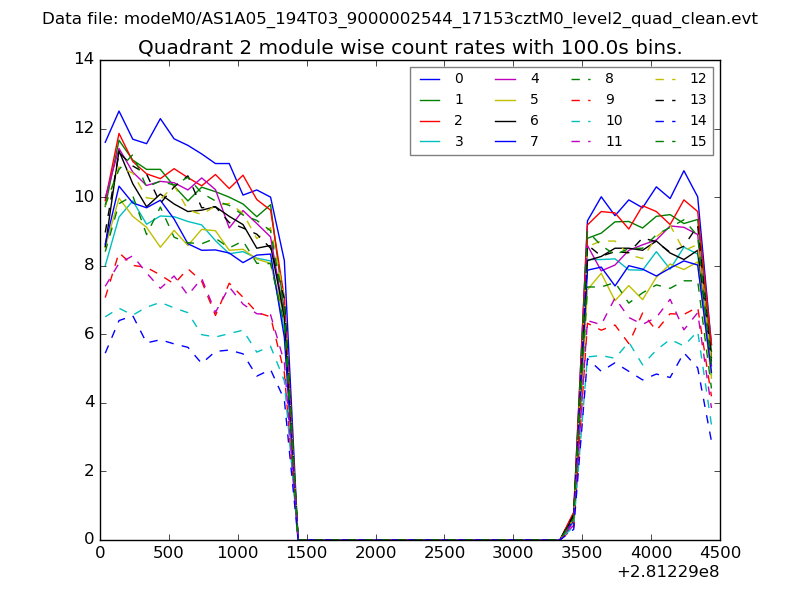 |
 |
| Module-wise count rates for Quadrant D Data is divided into 100 sec bins |
 |
 |
| Parameter | Plot |
|---|---|
| CZT HV Monitor | 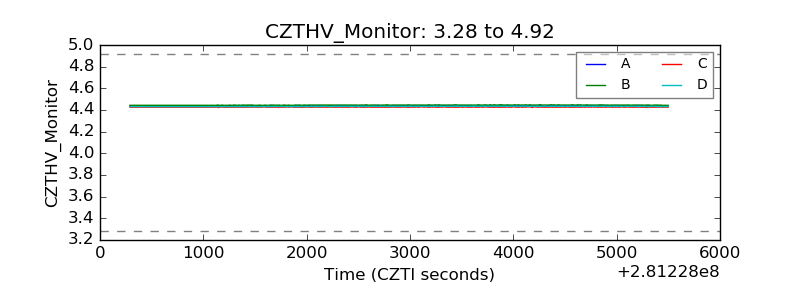 |
| D_VDD | 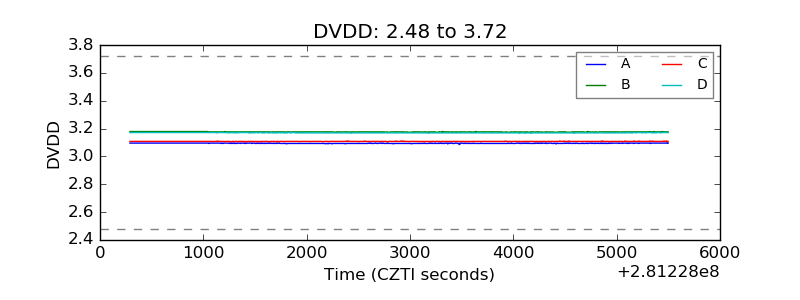 |
| Temperature 1 | 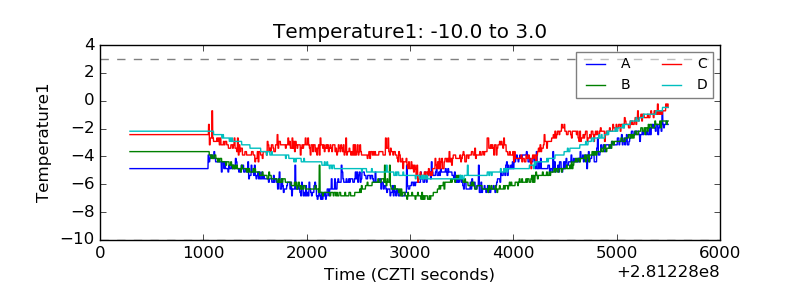 |
| Veto HV Monitor | 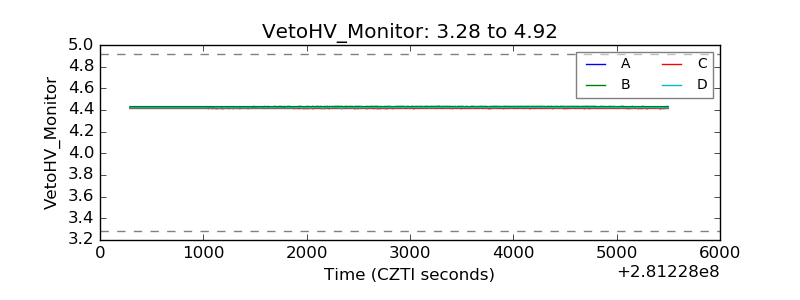 |
| Veto LLD | 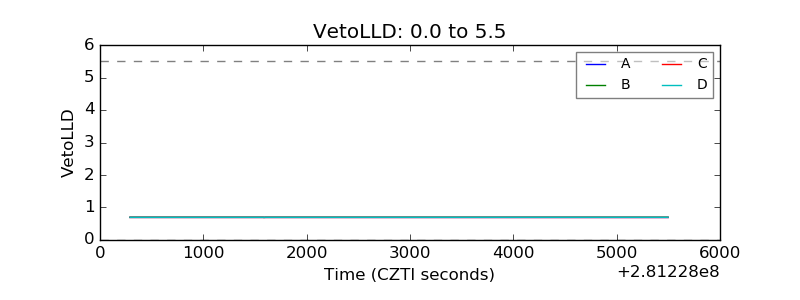 |
| Alpha Counter | 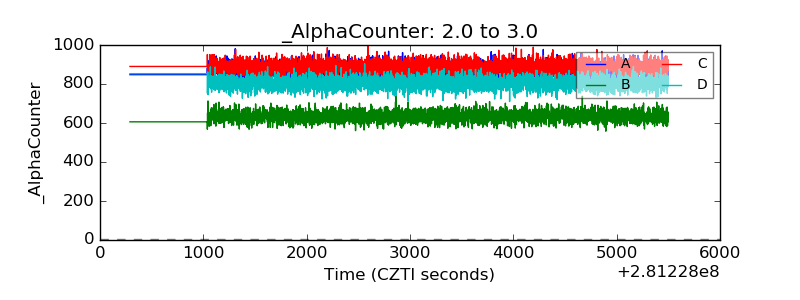 |
| _CPM_Rate | 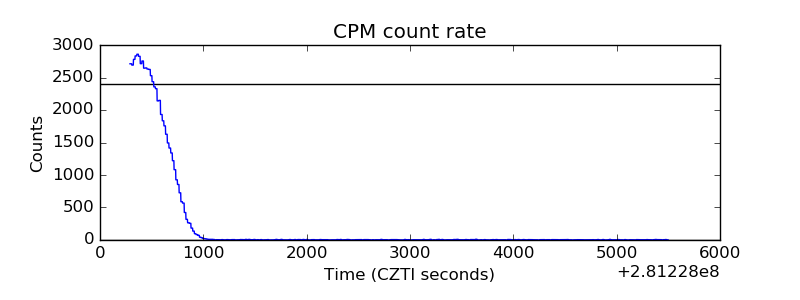 |
| CZT Counter |  |
| +2.5 Volts monitor |  |
| +5 Volts monitor |  |
| _ROLL_ROT |  |
| _Roll_DEC |  |
| _Roll_RA |  |
| Veto Counter |  |