| Param | Original file | Final file |
|---|---|---|
| Filename | modeM0/AS1C04_004T01_9000002542cztM0_level2.fits | modeM0/AS1C04_004T01_9000002542cztM0_level2_quad_clean.evt |
| Size (bytes) | 318,893,760 | 308,537,280 |
| Size | 304.1 MB | 294.2 MB |
| Events in quadrant A | 1,939,128 | 1,843,455 |
| Events in quadrant B | 1,889,972 | 1,866,983 |
| Events in quadrant C | 1,855,752 | 1,720,450 |
| Events in quadrant D | 1,650,956 | 1,591,929 |
| Mode SS | |||
|---|---|---|---|
| Quadrant | BADHDUFLAG | Total packets | Discarded packets |
| A | 0 | 690 | 0 |
| B | 0 | 690 | 0 |
| C | 0 | 690 | 0 |
| D | 0 | 690 | 0 |
| Mode M0 | |||
|---|---|---|---|
| Quadrant | BADHDUFLAG | Total packets | Discarded packets |
| A | 0 | 69892 | 0 |
| B | 0 | 70110 | 0 |
| C | 0 | 107003 | 0 |
| D | 0 | 84880 | 0 |
| Mode M9 | |||
|---|---|---|---|
| Quadrant | BADHDUFLAG | Total packets | Discarded packets |
| A | 0 | 35 | 0 |
| B | 0 | 35 | 0 |
| C | 0 | 35 | 0 |
| D | 0 | 35 | 0 |
| Quadrant | Total seconds | Saturated seconds | Saturation percentage |
|---|---|---|---|
| A | 33778 | 538 | 1.592753% |
| B | 33778 | 644 | 1.906566% |
| C | 33778 | 2203 | 6.521997% |
| D | 33778 | 1097 | 3.247676% |
Noise dominated data is calculated using 1-second bins in cleaned event files. If a bin has >2000 counts, and if more than 50% of those come from <1% of pixels, then it is considered to be noise-dominated and hence unusable.
| Quadrant | # 1 sec bins | Bins with >0 counts | Bins with >2000 counts | High rate bins dominated by noise | Noise dominated (total time) | Noise dominated (detector-on time) | Marked lightcurve |
|---|---|---|---|---|---|---|---|
| A | 37338 | 33776 | 0 | 0 | 0.00% | 0.00% |  |
| B | 37338 | 33775 | 0 | 0 | 0.00% | 0.00% |  |
| C | 37338 | 33776 | 0 | 0 | 0.00% | 0.00% |  |
| D | 37338 | 33777 | 0 | 0 | 0.00% | 0.00% |  |
Top three noisy pixels from each quadrant. If the there are fewer than three noisy pixels in the level2.evt file, extra rows are filled as -1
| Pixel properties | Quadrant properties | ||||||
|---|---|---|---|---|---|---|---|
| Quadrant | DetID | PixID | Counts | Sigma | Mean | Median | Sigma |
| A | 0 | 29 | 1785 | 10.54 | 503 | 472 | 124.5 |
| A | 7 | 110 | 1576 | 8.86 | 503 | 472 | 124.5 |
| A | 9 | 19 | 1478 | 8.08 | 503 | 472 | 124.5 |
| B | 2 | 9 | 1567 | 10.88 | 498 | 473 | 100.5 |
| B | 2 | 8 | 1247 | 7.7 | 498 | 473 | 100.5 |
| B | 5 | 225 | 1239 | 7.62 | 498 | 473 | 100.5 |
| C | 1 | 81 | 1439 | 7.67 | 489 | 456 | 128.1 |
| C | 1 | 80 | 1432 | 7.62 | 489 | 456 | 128.1 |
| C | 12 | 241 | 1354 | 7.01 | 489 | 456 | 128.1 |
| D | 3 | 14 | 1226 | 6.25 | 471 | 428 | 127.6 |
| D | 6 | 231 | 1188 | 5.95 | 471 | 428 | 127.6 |
| D | 10 | 189 | 1168 | 5.8 | 471 | 428 | 127.6 |
Histogram calculated using DETX and DETY for each event in the final _common_clean file
| Quadrant A | 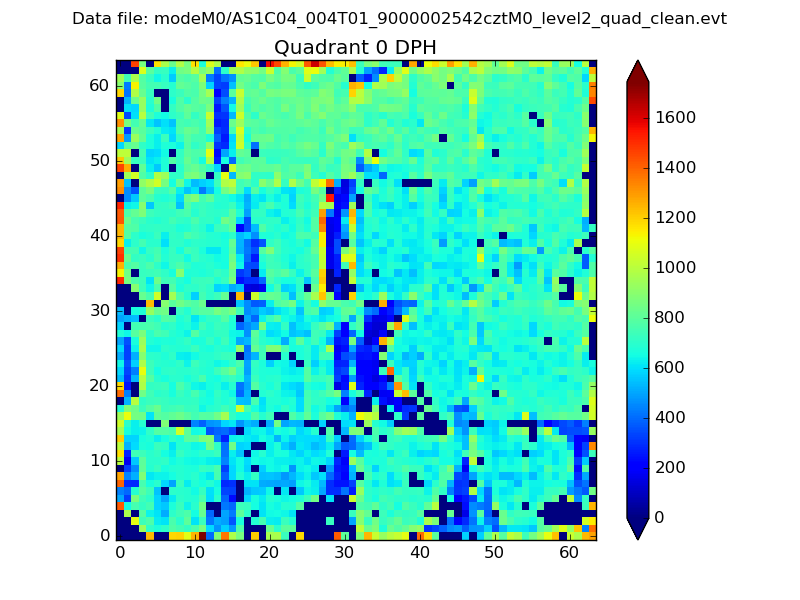 |
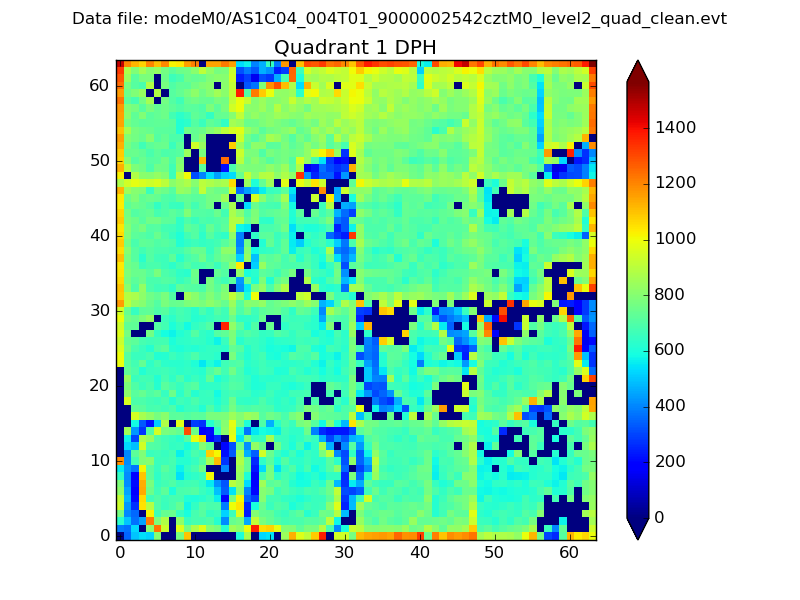 |
Quadrant B |
|---|---|---|---|
| Quadrant D |  |
 |
Quadrant C |
| Plot type | Count rate plots | Images |
|---|---|---|
| Comparison with Poisson distribution Blue bars denote a histogram of data divided into 1 sec bins. Red curve is a Poisson curve with rate = median count rate of data. |
 |
 |
| Quadrant-wise count rates Data is divided into 100 sec bins |
 |
|
| Module-wise count rates for Quadrant A Data is divided into 100 sec bins |
 |
 |
| Module-wise count rates for Quadrant B Data is divided into 100 sec bins |
 |
 |
| Module-wise count rates for Quadrant C Data is divided into 100 sec bins |
 |
 |
| Module-wise count rates for Quadrant D Data is divided into 100 sec bins |
 |
 |
| Parameter | Plot |
|---|---|
| CZT HV Monitor |  |
| D_VDD |  |
| Temperature 1 |  |
| Veto HV Monitor |  |
| Veto LLD |  |
| Alpha Counter |  |
| _CPM_Rate | 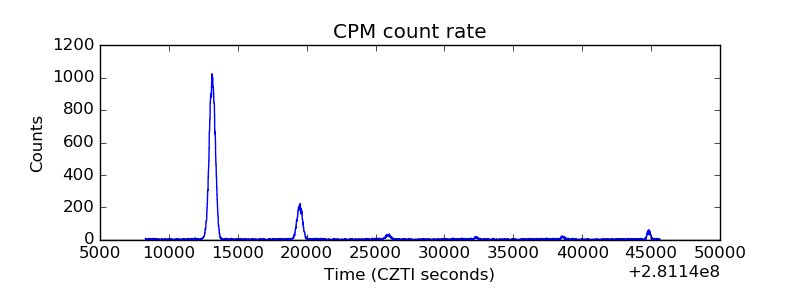 |
| CZT Counter |  |
| +2.5 Volts monitor |  |
| +5 Volts monitor |  |
| _ROLL_ROT |  |
| _Roll_DEC |  |
| _Roll_RA | 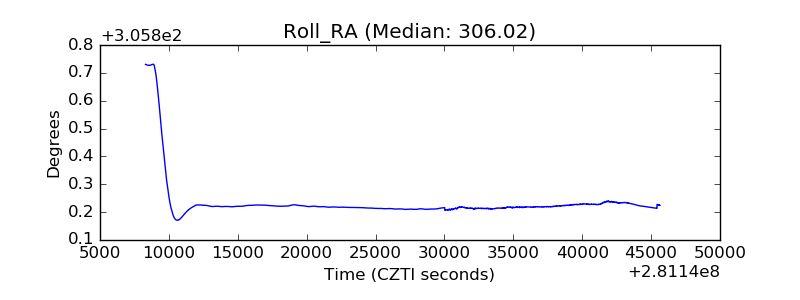 |
| Veto Counter |  |