| Param | Original file | Final file |
|---|---|---|
| Filename | modeM0/AS1C04_004T01_9000002542_17140cztM0_level2.evt | modeM0/AS1C04_004T01_9000002542_17140cztM0_level2_quad_clean.evt |
| Size (bytes) | 717,410,880 | 73,673,280 |
| Size | 684.2 MB | 70.3 MB |
| Events in quadrant A | 3,190,684 | 458,812 |
| Events in quadrant B | 3,278,918 | 469,508 |
| Events in quadrant C | 8,759,618 | 420,859 |
| Events in quadrant D | 6,048,023 | 416,462 |
| Mode SS | |||
|---|---|---|---|
| Quadrant | BADHDUFLAG | Total packets | Discarded packets |
| A | 0 | 136 | 0 |
| B | 0 | 136 | 0 |
| C | 0 | 136 | 0 |
| D | 0 | 136 | 0 |
| Mode M0 | |||
|---|---|---|---|
| Quadrant | BADHDUFLAG | Total packets | Discarded packets |
| A | 0 | 13724 | 2 |
| B | 0 | 13913 | 2 |
| C | 0 | 30700 | 2 |
| D | 0 | 22405 | 2 |
| Mode M9 | |||
|---|---|---|---|
| Quadrant | BADHDUFLAG | Total packets | Discarded packets |
| A | 0 | 13 | 0 |
| B | 0 | 14 | 0 |
| C | 0 | 14 | 0 |
| D | 0 | 14 | 0 |
| Quadrant | Total seconds | Saturated seconds | Saturation percentage |
|---|---|---|---|
| A | 6665 | 65 | 0.975244% |
| B | 6665 | 89 | 1.335334% |
| C | 6665 | 995 | 14.928732% |
| D | 6665 | 519 | 7.786947% |
Noise dominated data is calculated using 1-second bins in cleaned event files. If a bin has >2000 counts, and if more than 50% of those come from <1% of pixels, then it is considered to be noise-dominated and hence unusable.
| Quadrant | # 1 sec bins | Bins with >0 counts | Bins with >2000 counts | High rate bins dominated by noise | Noise dominated (total time) | Noise dominated (detector-on time) | Marked lightcurve |
|---|---|---|---|---|---|---|---|
| A | 7615 | 6666 | 0 | 0 | 0.00% | 0.00% | 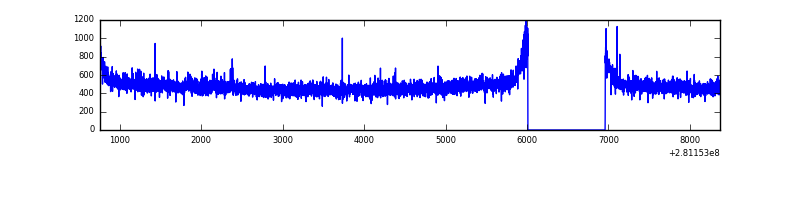 |
| B | 7615 | 6666 | 0 | 0 | 0.00% | 0.00% | 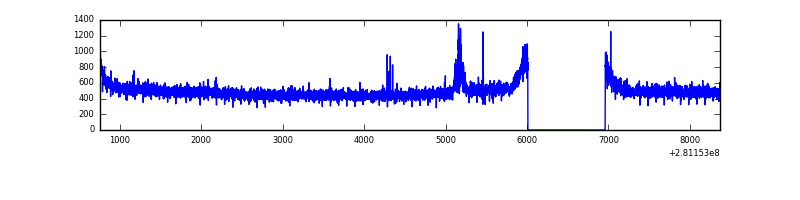 |
| C | 7615 | 6665 | 253 | 253 | 3.32% | 3.80% | 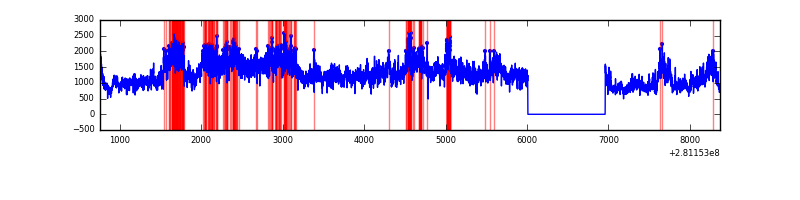 |
| D | 7615 | 6666 | 606 | 606 | 7.96% | 9.09% | 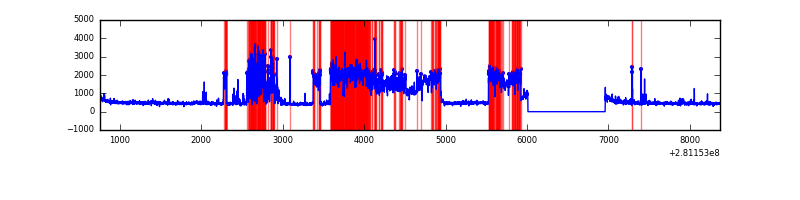 |
Top three noisy pixels from each quadrant. If the there are fewer than three noisy pixels in the level2.evt file, extra rows are filled as -1
| Pixel properties | Quadrant properties | ||||||
|---|---|---|---|---|---|---|---|
| Quadrant | DetID | PixID | Counts | Sigma | Mean | Median | Sigma |
| A | 12 | 189 | 20397 | 116.45 | 825 | 809 | 168.2 |
| A | 0 | 226 | 7183 | 37.89 | 825 | 809 | 168.2 |
| A | 3 | 137 | 6055 | 31.19 | 825 | 809 | 168.2 |
| B | 4 | 216 | 37713 | 233.81 | 827 | 806 | 157.9 |
| B | 12 | 111 | 19197 | 116.51 | 827 | 806 | 157.9 |
| B | 11 | 111 | 16649 | 100.37 | 827 | 806 | 157.9 |
| C | 3 | 233 | 5636676 | 31294.58 | 771 | 777 | 180.1 |
| C | 14 | 238 | 119002 | 656.47 | 771 | 777 | 180.1 |
| C | 13 | 61 | 5502 | 26.24 | 771 | 777 | 180.1 |
| D | 13 | 232 | 1150766 | 5953.89 | 788 | 766 | 193.2 |
| D | 13 | 200 | 714989 | 3697.74 | 788 | 766 | 193.2 |
| D | 13 | 249 | 546667 | 2826.29 | 788 | 766 | 193.2 |
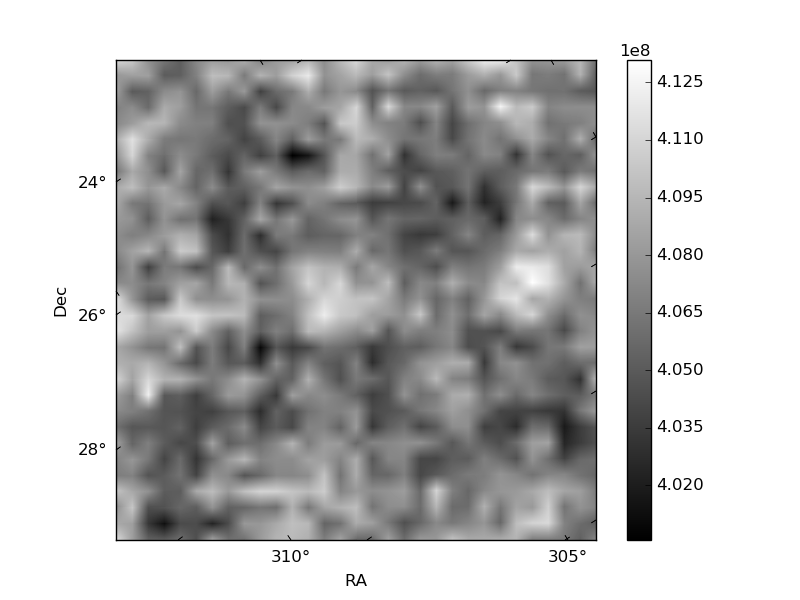
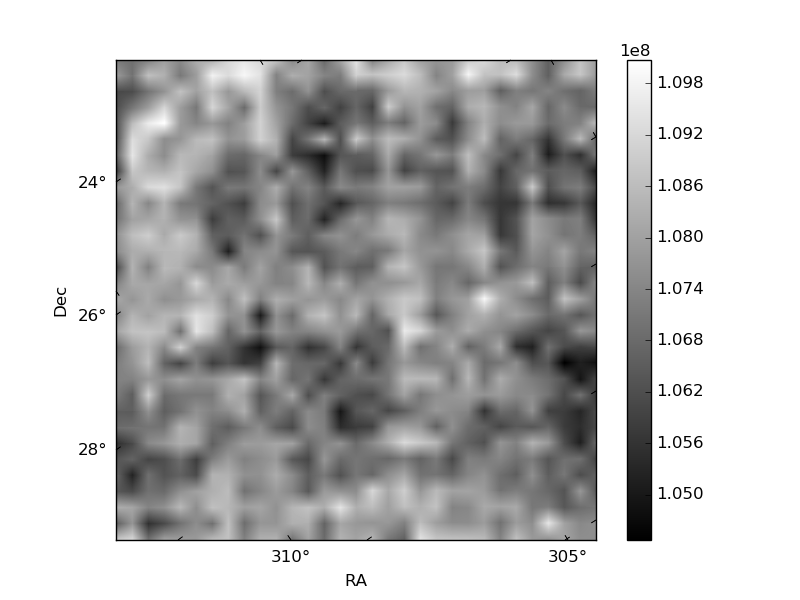
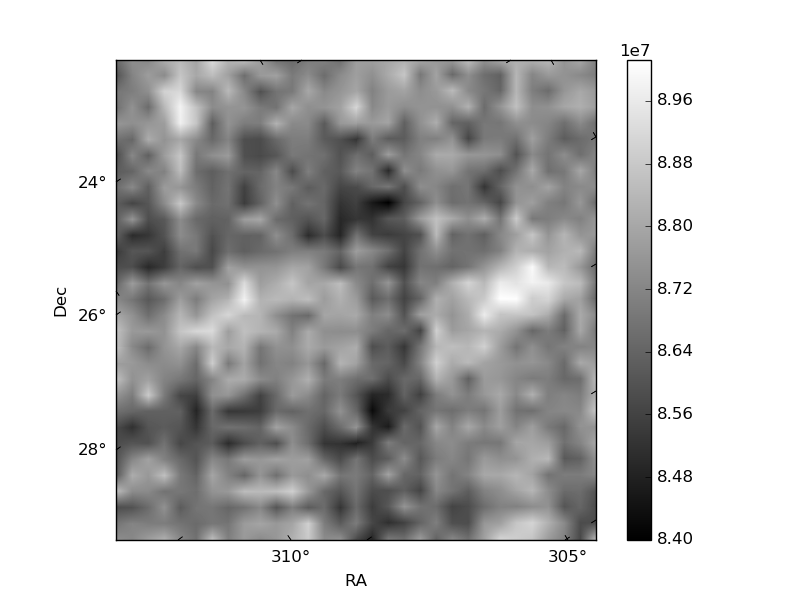
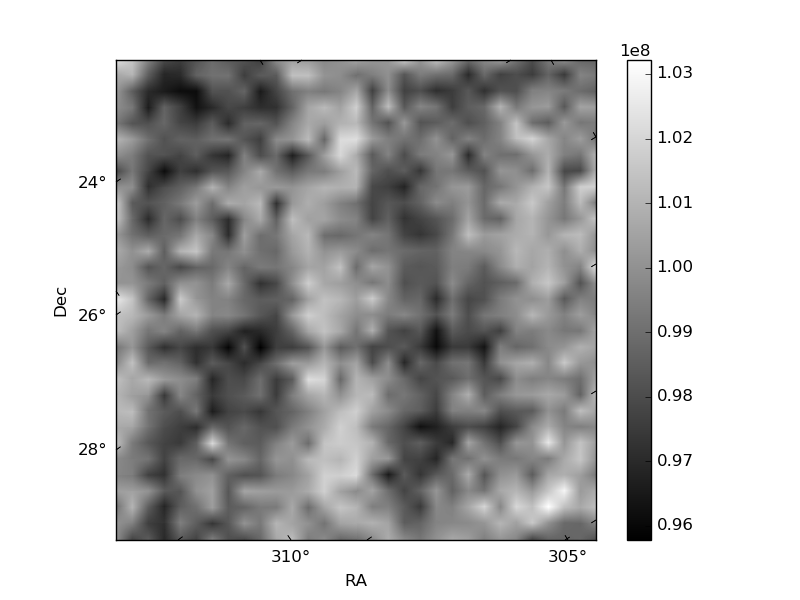
Histogram calculated using DETX and DETY for each event in the final _common_clean file
| Quadrant A | 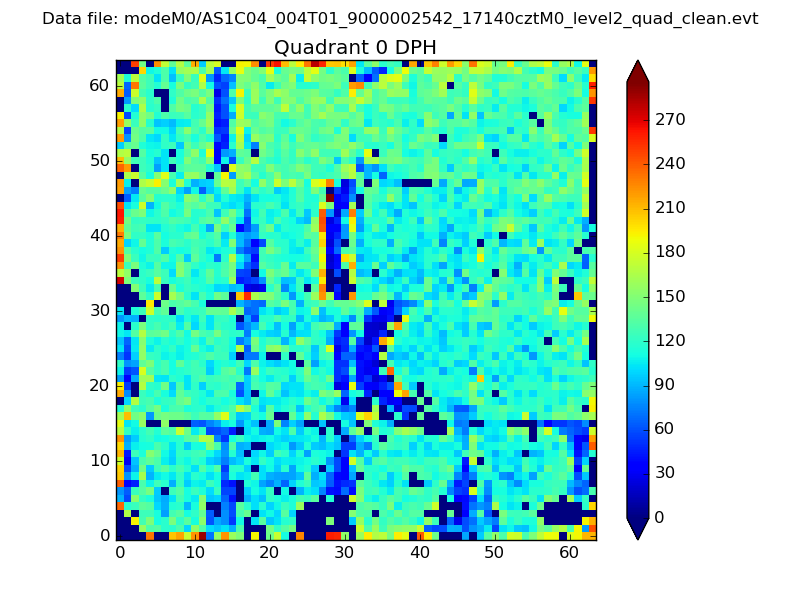 |
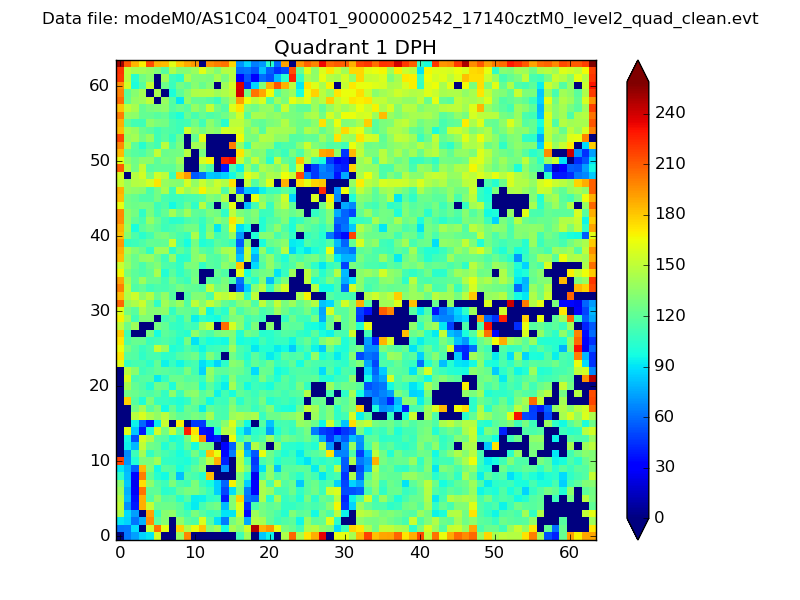 |
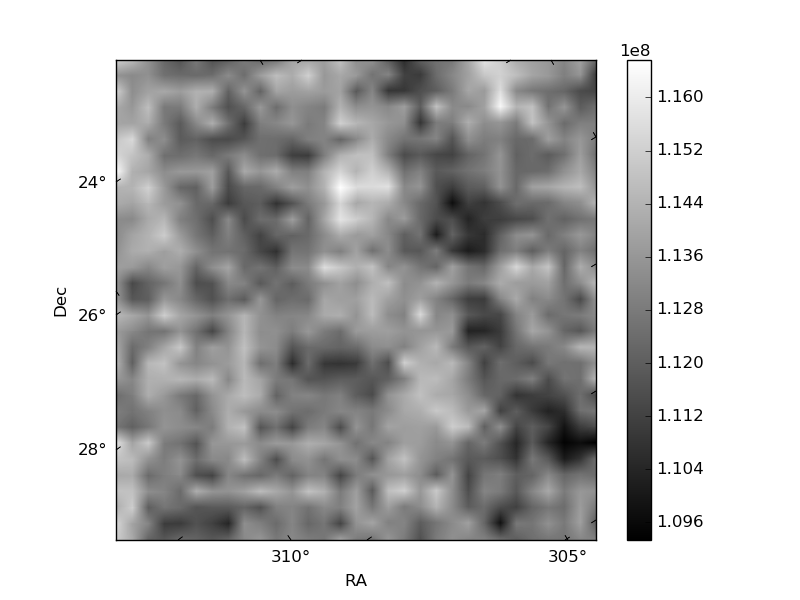
Quadrant B |
|---|---|---|---|
| Quadrant D | 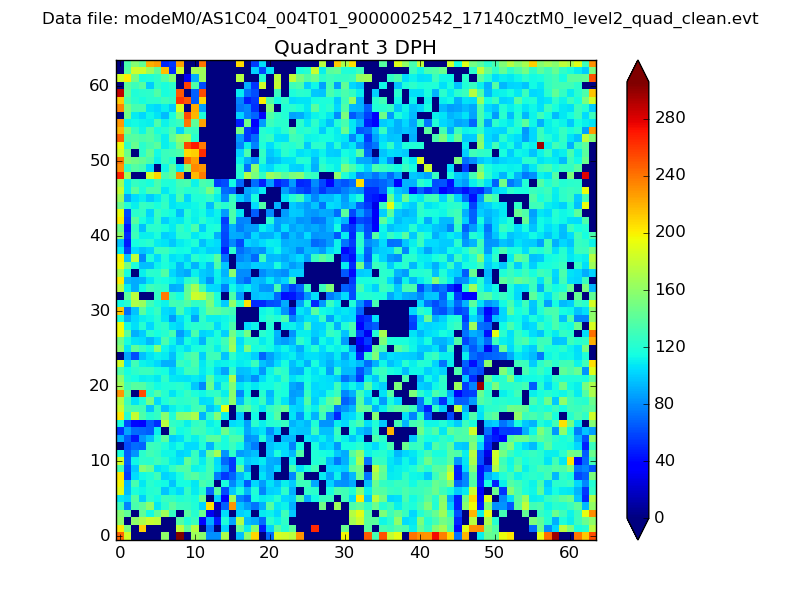 |
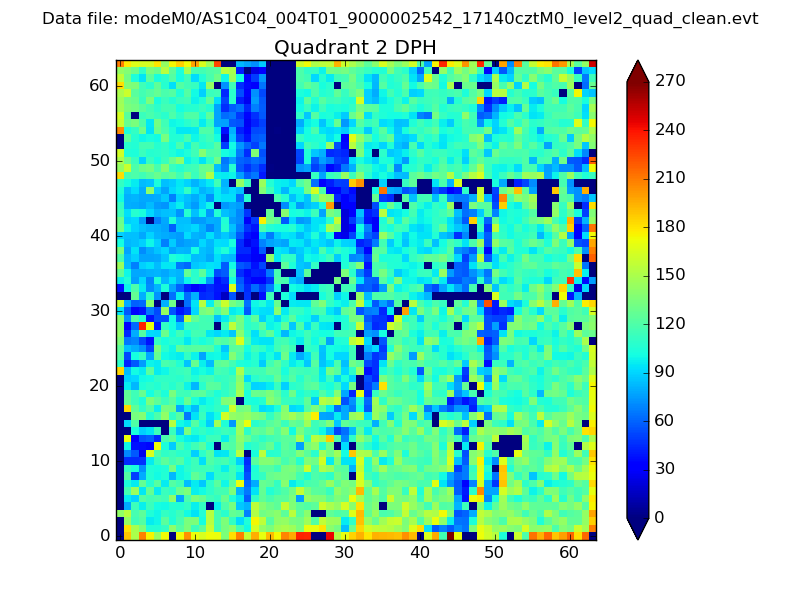 |
Quadrant C |
| Plot type | Count rate plots | Images |
|---|---|---|
| Comparison with Poisson distribution Blue bars denote a histogram of data divided into 1 sec bins. Red curve is a Poisson curve with rate = median count rate of data. |
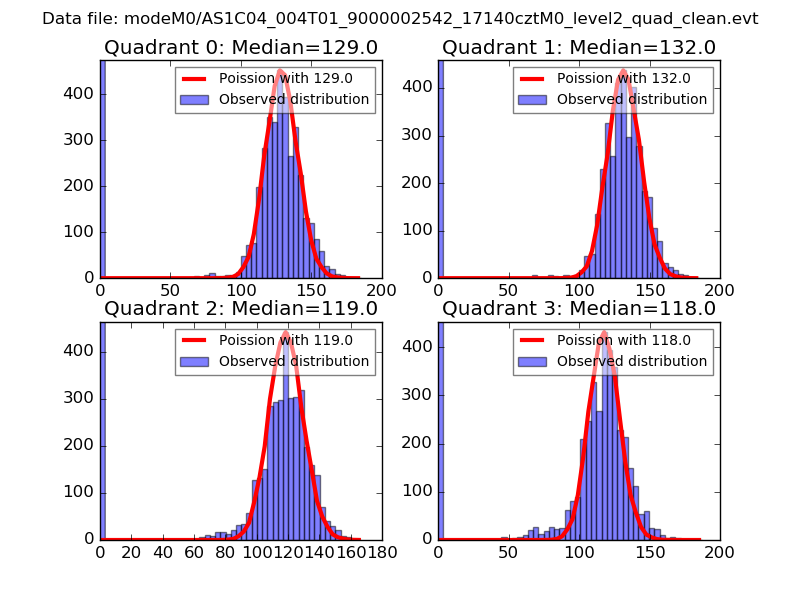 |
 |
| Quadrant-wise count rates Data is divided into 100 sec bins |
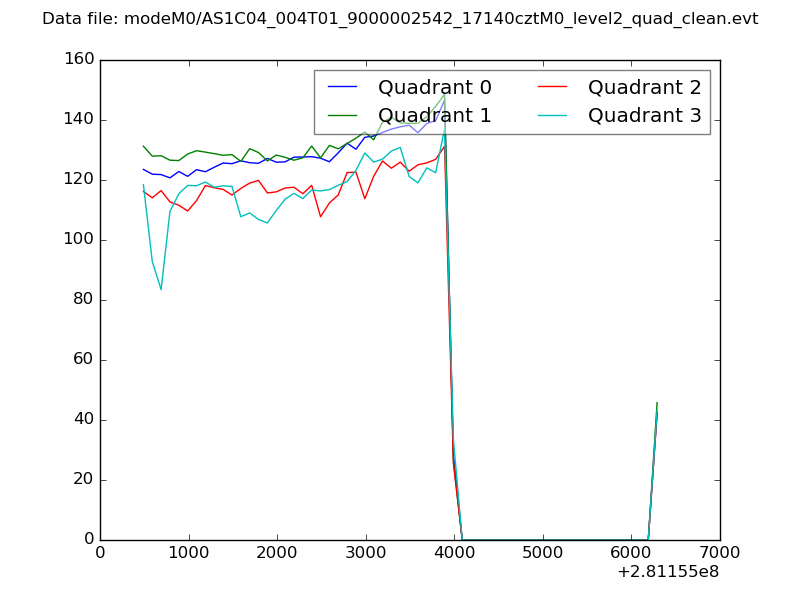 |
|
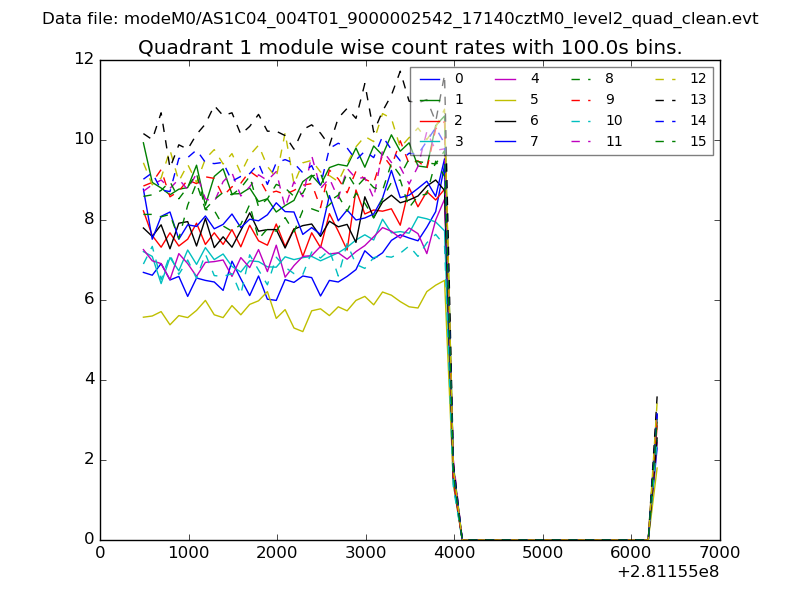
| Module-wise count rates for Quadrant A Data is divided into 100 sec bins |
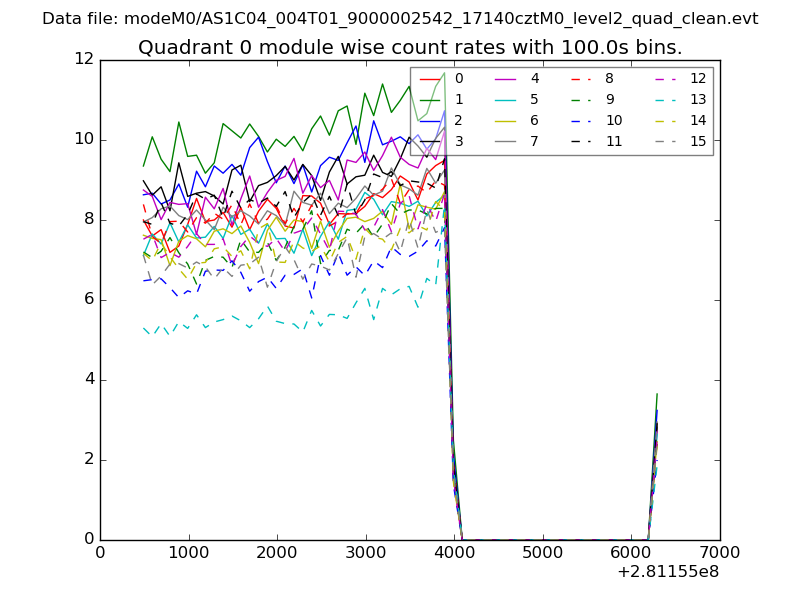 |
 |
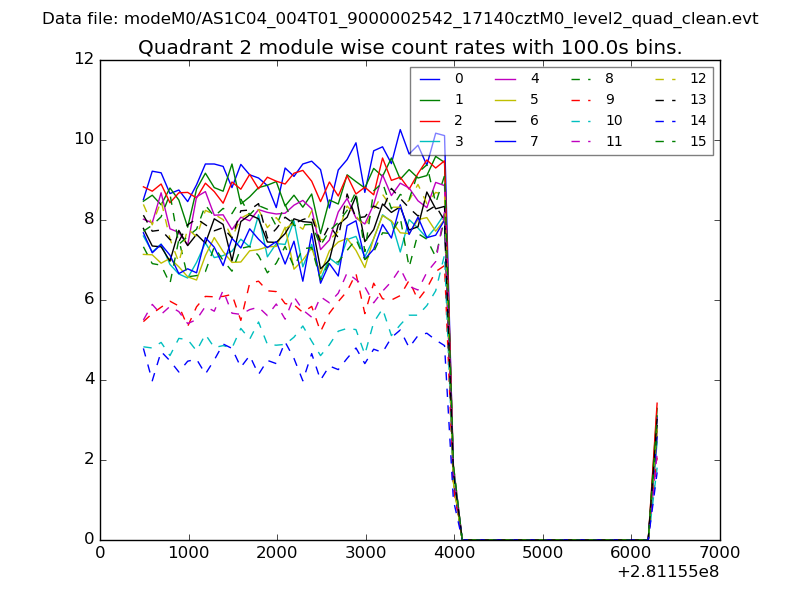
| Module-wise count rates for Quadrant B Data is divided into 100 sec bins |
 |
 |
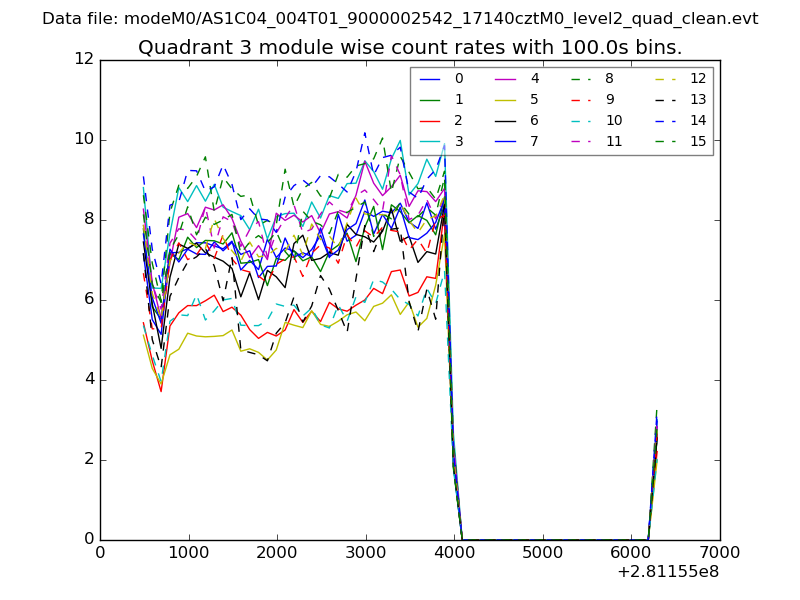
| Module-wise count rates for Quadrant C Data is divided into 100 sec bins |
 |
 |
| Module-wise count rates for Quadrant D Data is divided into 100 sec bins |
 |
 |
| Parameter | Plot |
|---|---|
| CZT HV Monitor | 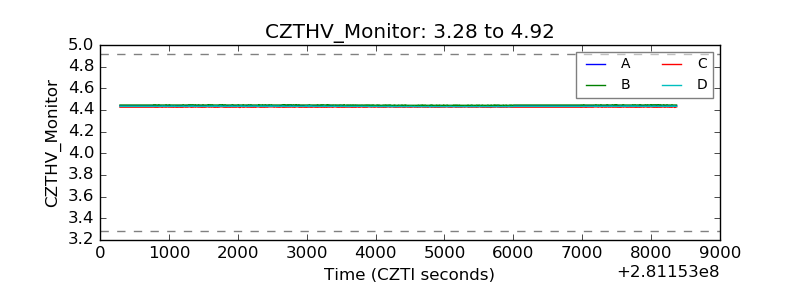 |
| D_VDD | 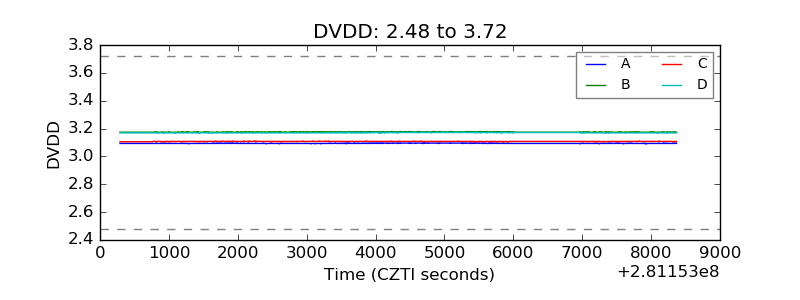 |
| Temperature 1 | 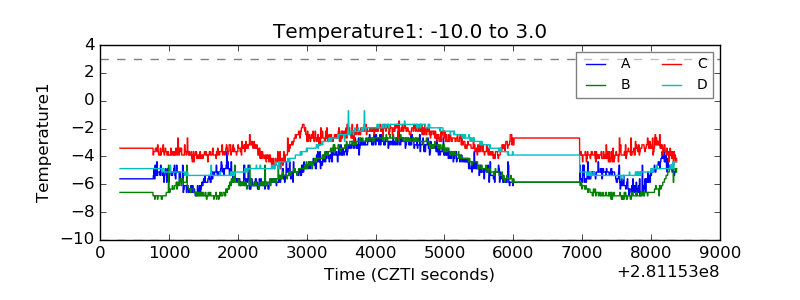 |
| Veto HV Monitor | 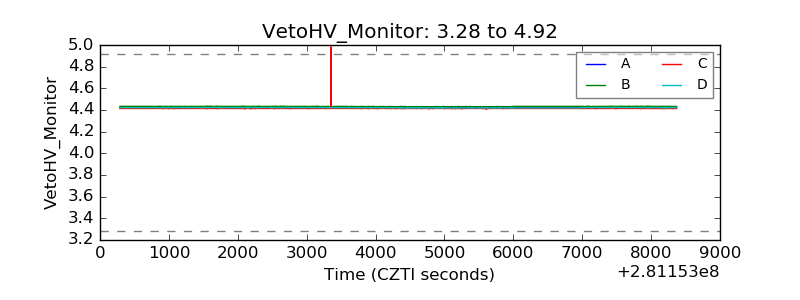 |
| Veto LLD | 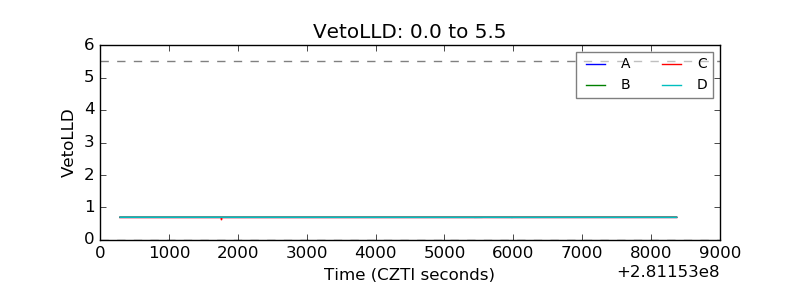 |
| Alpha Counter | 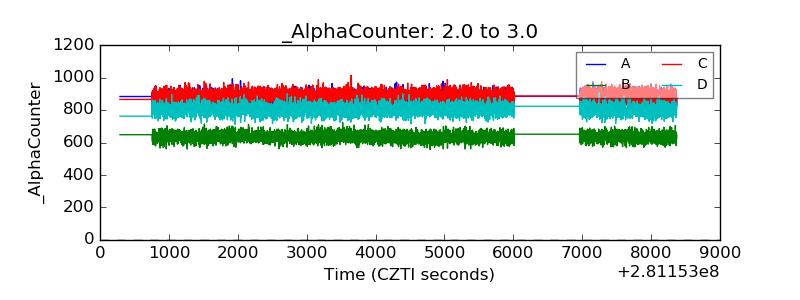 |
| _CPM_Rate | 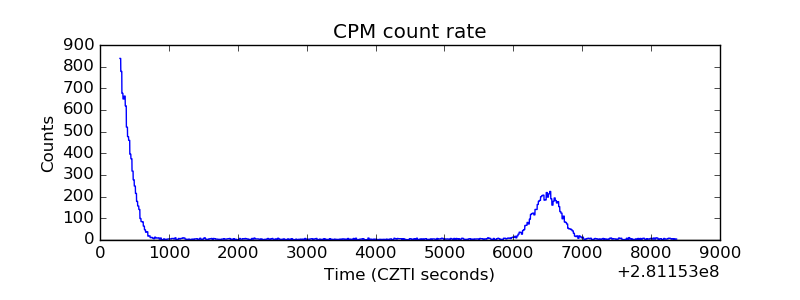 |
| CZT Counter | 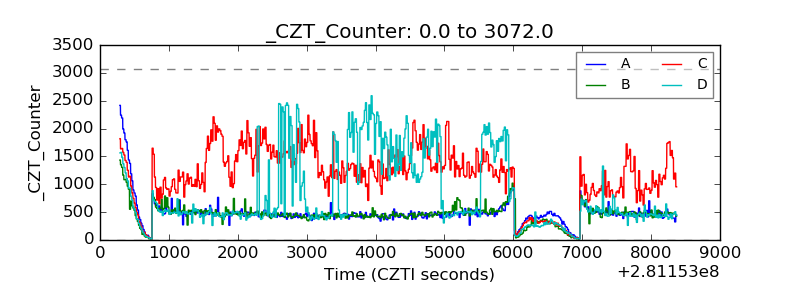 |
| +2.5 Volts monitor |  |
| +5 Volts monitor | 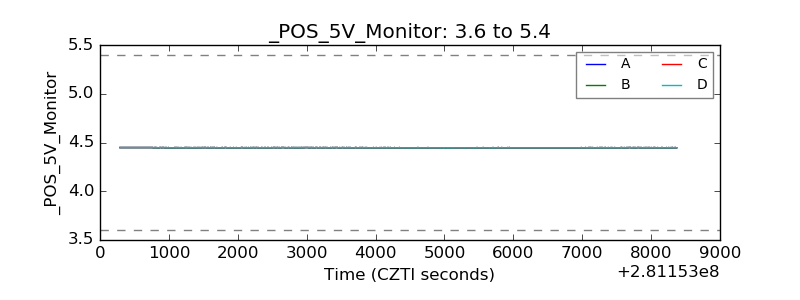 |
| _ROLL_ROT | 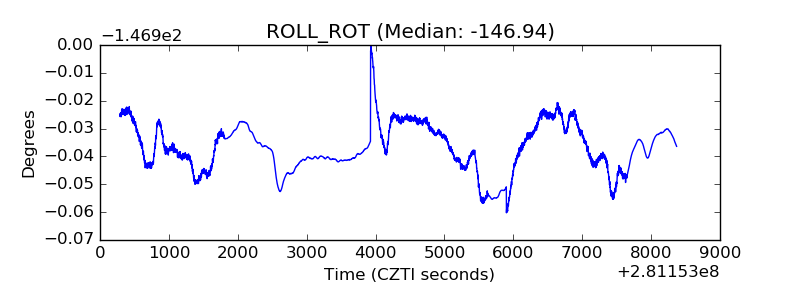 |
| _Roll_DEC | 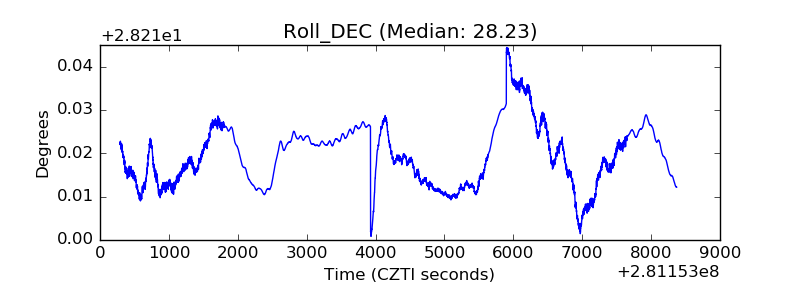 |
| _Roll_RA | 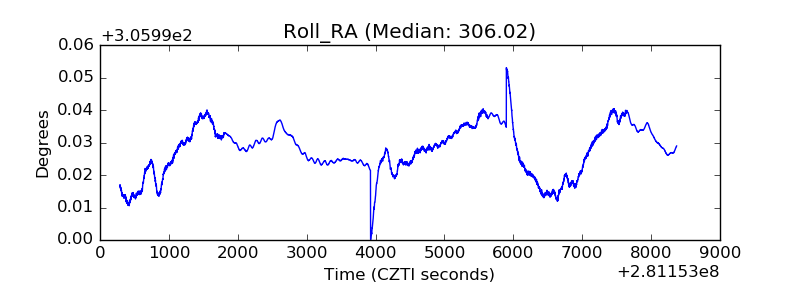 |
| Veto Counter | 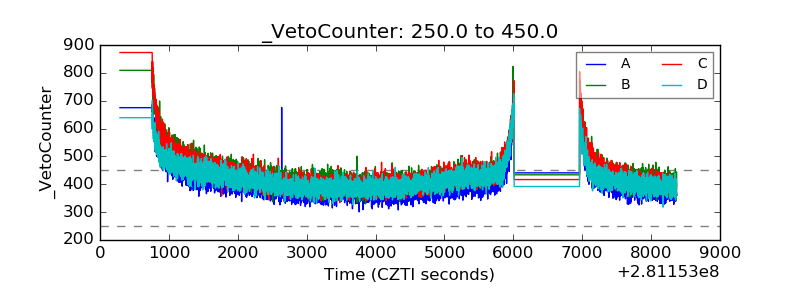 |