| Param | Original file | Final file |
|---|---|---|
| Filename | modeM0/AS1C04_004T01_9000002542_17141cztM0_level2.evt | modeM0/AS1C04_004T01_9000002542_17141cztM0_level2_quad_clean.evt |
| Size (bytes) | 533,897,280 | 82,877,760 |
| Size | 509.2 MB | 79.0 MB |
| Events in quadrant A | 3,296,836 | 512,490 |
| Events in quadrant B | 3,322,640 | 525,968 |
| Events in quadrant C | 5,828,624 | 492,301 |
| Events in quadrant D | 3,248,016 | 493,154 |
| Mode SS | |||
|---|---|---|---|
| Quadrant | BADHDUFLAG | Total packets | Discarded packets |
| A | 0 | 142 | 0 |
| B | 0 | 142 | 0 |
| C | 0 | 142 | 0 |
| D | 0 | 142 | 0 |
| Mode M0 | |||
|---|---|---|---|
| Quadrant | BADHDUFLAG | Total packets | Discarded packets |
| A | 0 | 14379 | 1 |
| B | 0 | 14377 | 1 |
| C | 0 | 22360 | 1 |
| D | 0 | 14594 | 1 |
| Mode M9 | |||
|---|---|---|---|
| Quadrant | BADHDUFLAG | Total packets | Discarded packets |
| A | 0 | 5 | 0 |
| B | 0 | 5 | 0 |
| C | 0 | 5 | 0 |
| D | 0 | 5 | 0 |
| Quadrant | Total seconds | Saturated seconds | Saturation percentage |
|---|---|---|---|
| A | 6978 | 115 | 1.648037% |
| B | 6978 | 143 | 2.049298% |
| C | 6978 | 271 | 3.883634% |
| D | 6979 | 100 | 1.432870% |
Noise dominated data is calculated using 1-second bins in cleaned event files. If a bin has >2000 counts, and if more than 50% of those come from <1% of pixels, then it is considered to be noise-dominated and hence unusable.
| Quadrant | # 1 sec bins | Bins with >0 counts | Bins with >2000 counts | High rate bins dominated by noise | Noise dominated (total time) | Noise dominated (detector-on time) | Marked lightcurve |
|---|---|---|---|---|---|---|---|
| A | 7463 | 6979 | 1 | 1 | 0.01% | 0.01% | 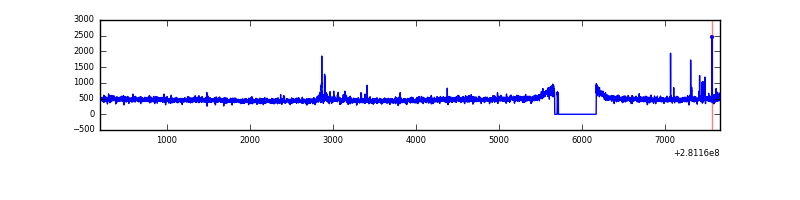 |
| B | 7463 | 6978 | 2 | 2 | 0.03% | 0.03% | 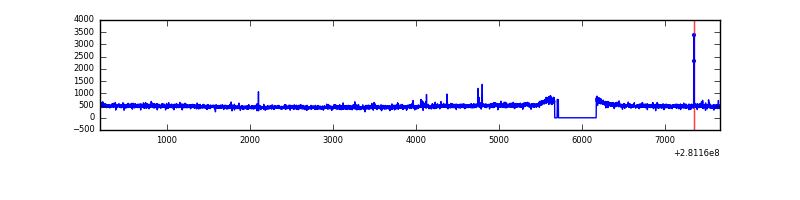 |
| C | 7463 | 6979 | 5 | 5 | 0.07% | 0.07% | 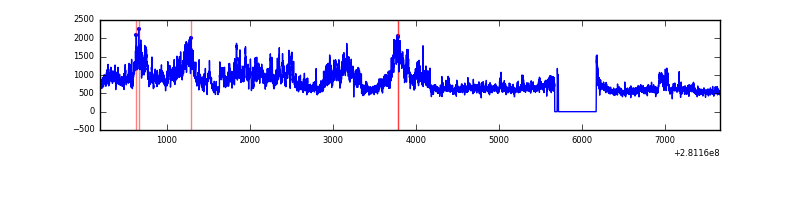 |
| D | 7464 | 6980 | 25 | 25 | 0.33% | 0.36% | 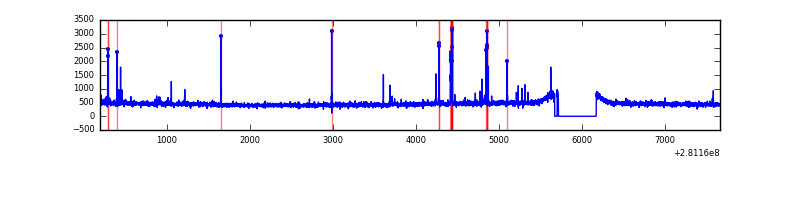 |
Top three noisy pixels from each quadrant. If the there are fewer than three noisy pixels in the level2.evt file, extra rows are filled as -1
| Pixel properties | Quadrant properties | ||||||
|---|---|---|---|---|---|---|---|
| Quadrant | DetID | PixID | Counts | Sigma | Mean | Median | Sigma |
| A | 12 | 189 | 46460 | 269.48 | 838 | 819 | 169.4 |
| A | 12 | 96 | 23189 | 132.08 | 838 | 819 | 169.4 |
| A | 0 | 226 | 7415 | 38.94 | 838 | 819 | 169.4 |
| B | 12 | 111 | 19833 | 116.85 | 840 | 818 | 162.7 |
| B | 11 | 111 | 17322 | 101.42 | 840 | 818 | 162.7 |
| B | 4 | 173 | 16779 | 98.08 | 840 | 818 | 162.7 |
| C | 3 | 233 | 2582737 | 13755.87 | 801 | 805 | 187.7 |
| C | 14 | 238 | 121825 | 644.76 | 801 | 805 | 187.7 |
| C | 13 | 61 | 5487 | 24.94 | 801 | 805 | 187.7 |
| D | 10 | 70 | 48647 | 241.77 | 816 | 793 | 197.9 |
| D | 13 | 249 | 43249 | 214.5 | 816 | 793 | 197.9 |
| D | 7 | 223 | 39277 | 194.43 | 816 | 793 | 197.9 |
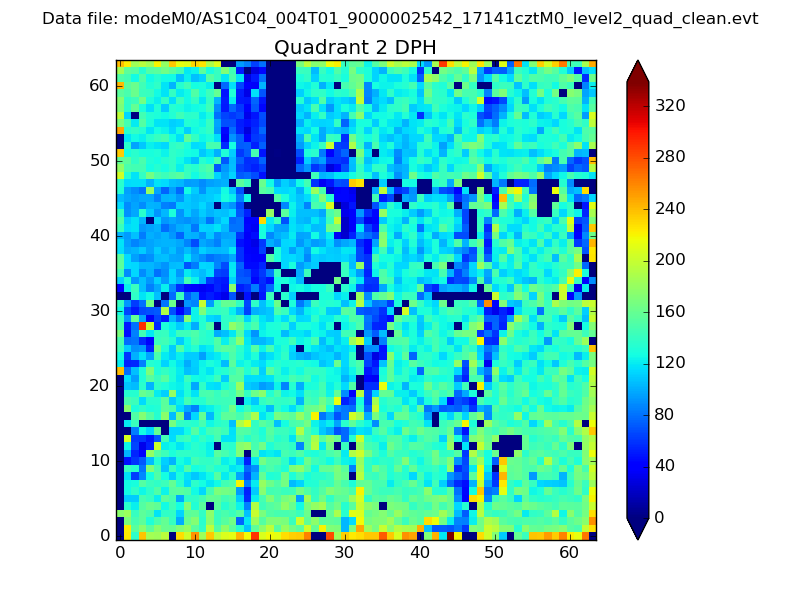
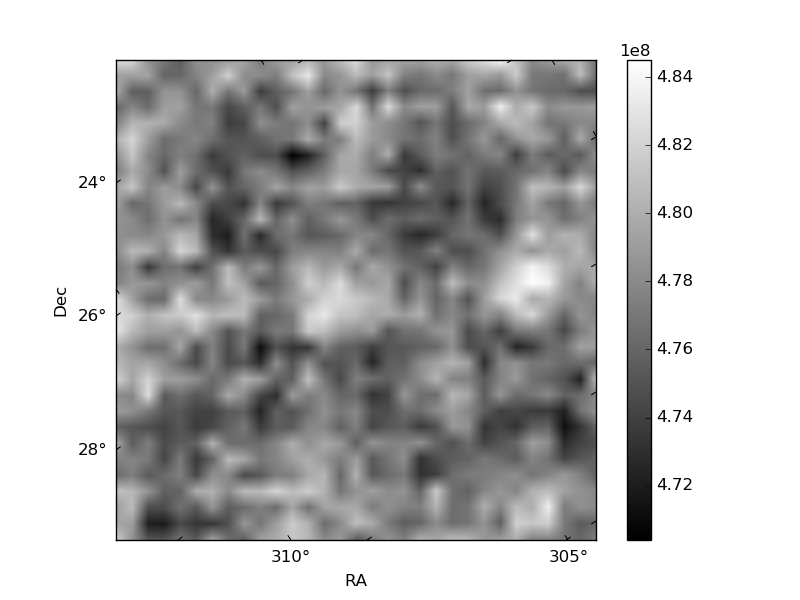
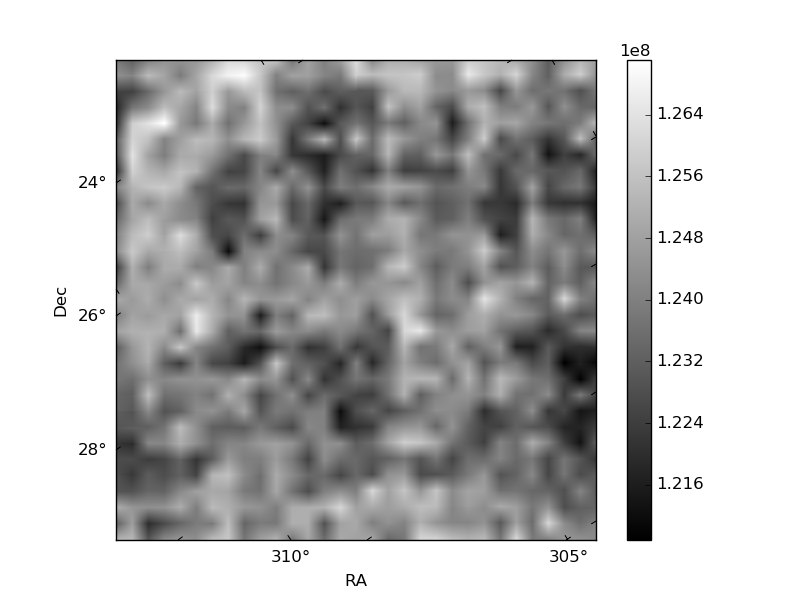
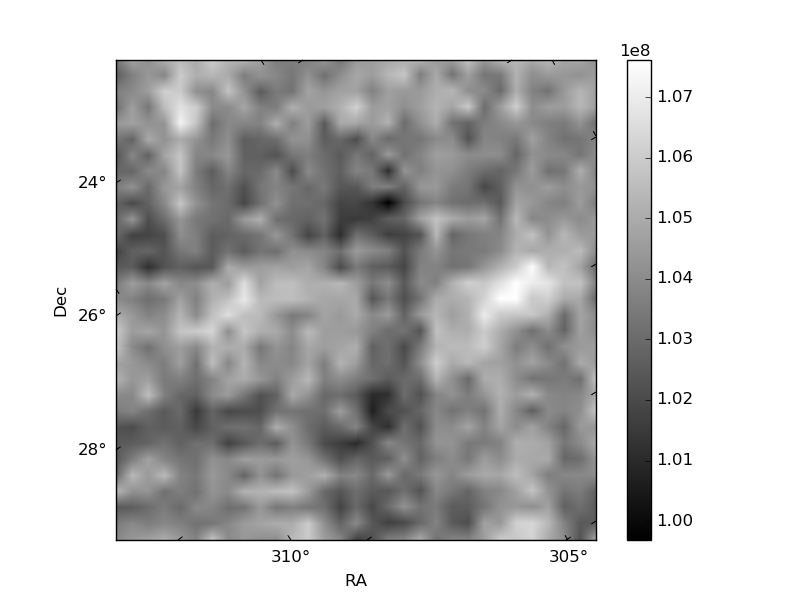
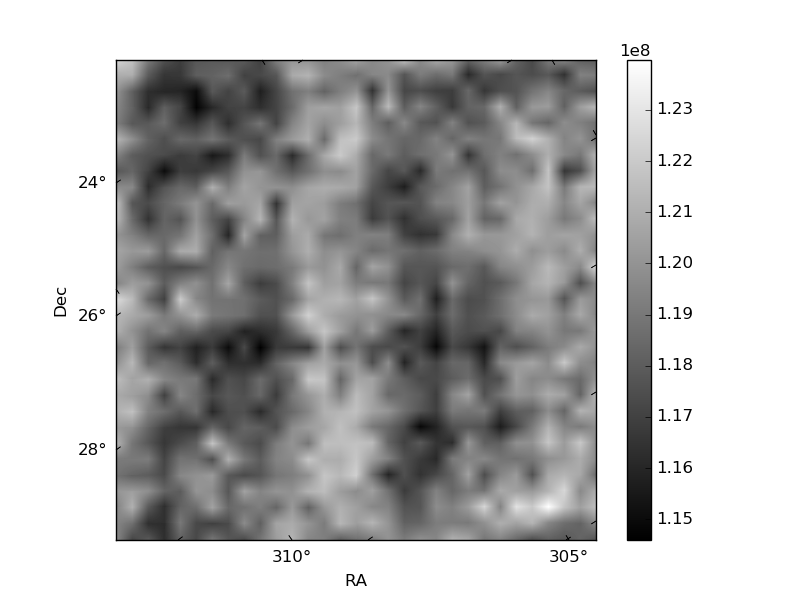
Histogram calculated using DETX and DETY for each event in the final _common_clean file
| Quadrant A | 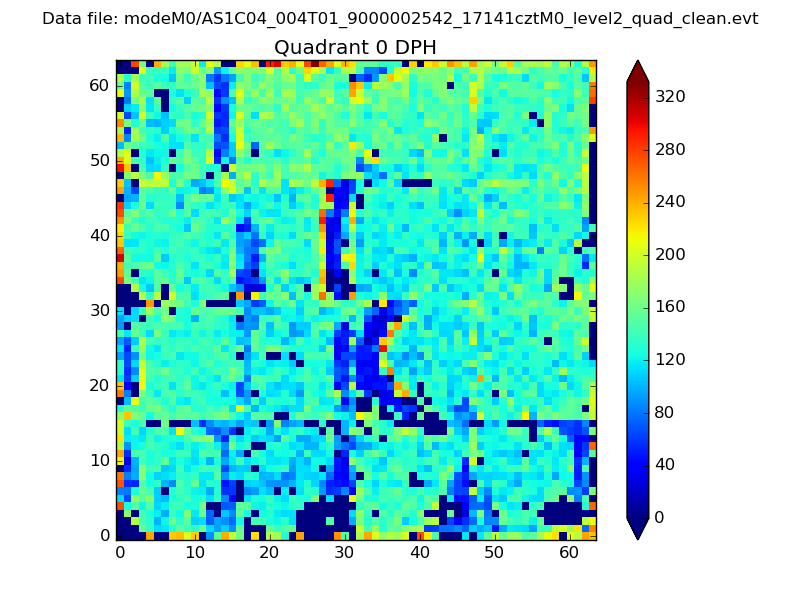 |
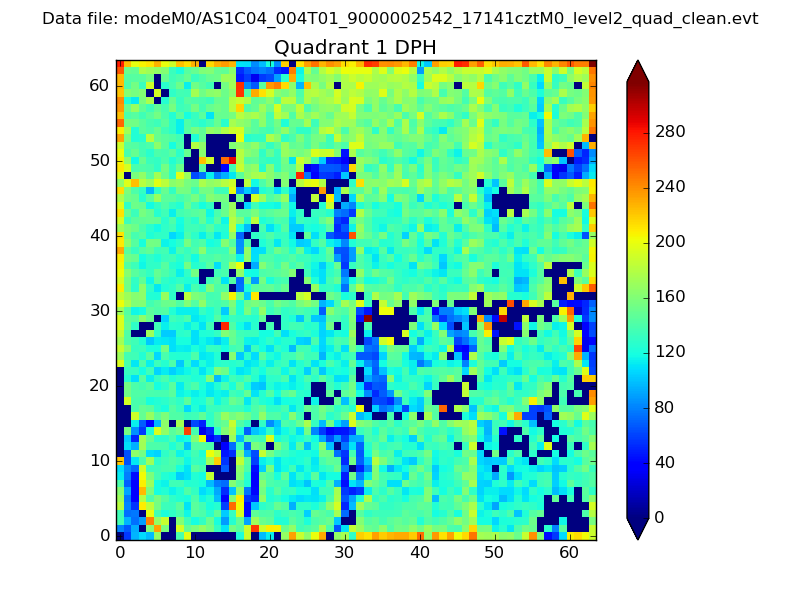 |
Quadrant B |
|---|---|---|---|
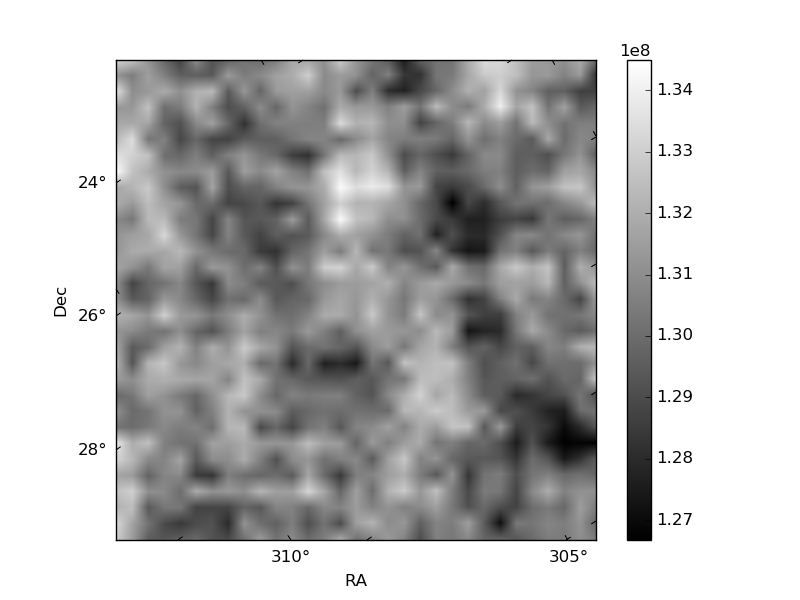
| Quadrant D | 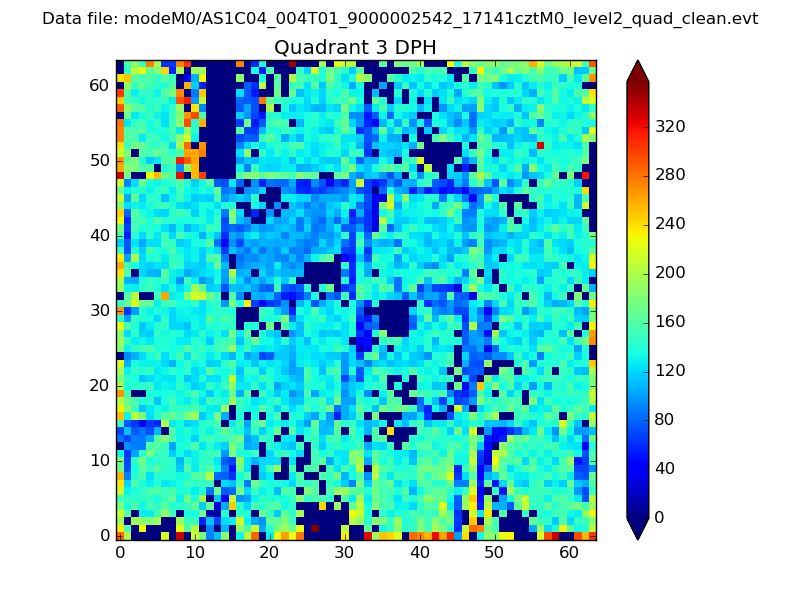 |
 |
Quadrant C |
| Plot type | Count rate plots | Images |
|---|---|---|
| Comparison with Poisson distribution Blue bars denote a histogram of data divided into 1 sec bins. Red curve is a Poisson curve with rate = median count rate of data. |
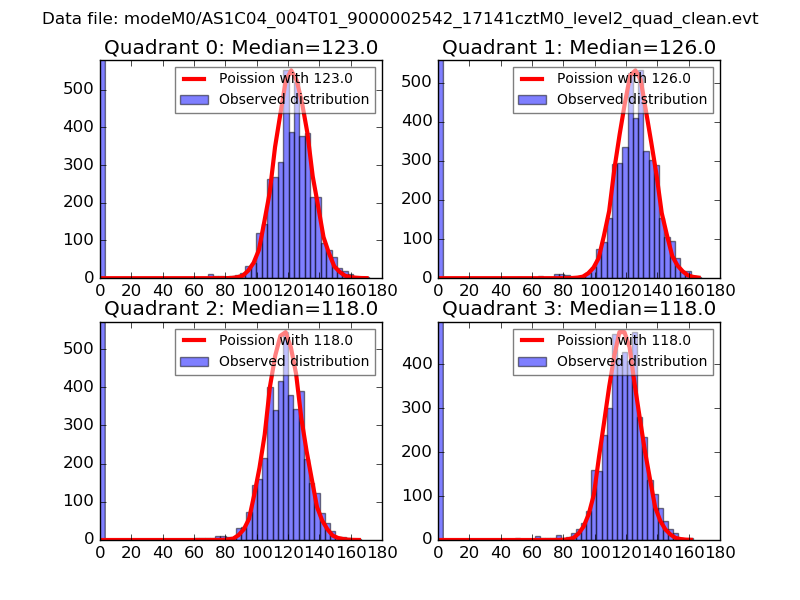 |
 |
| Quadrant-wise count rates Data is divided into 100 sec bins |
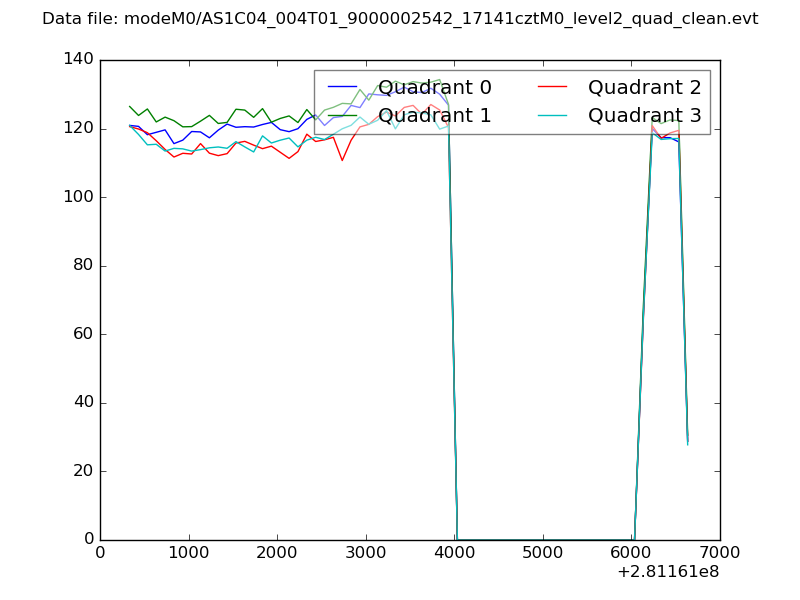 |
|
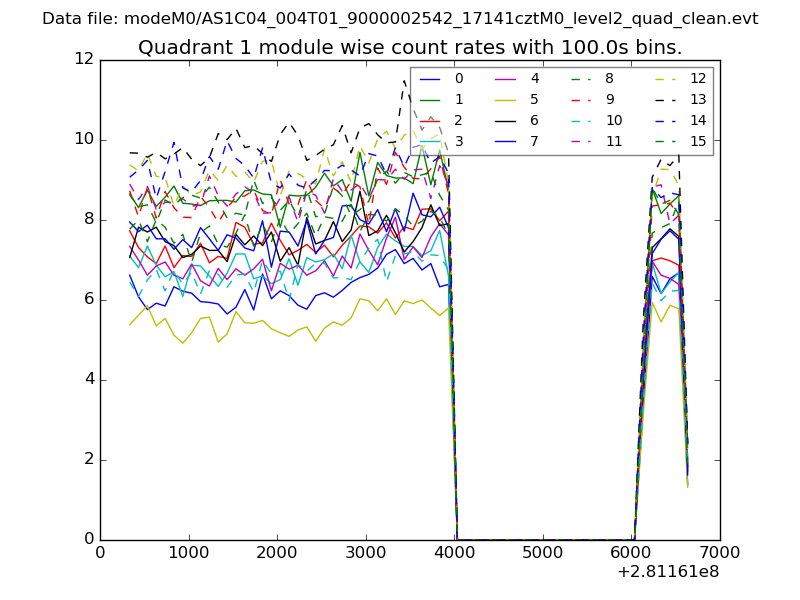
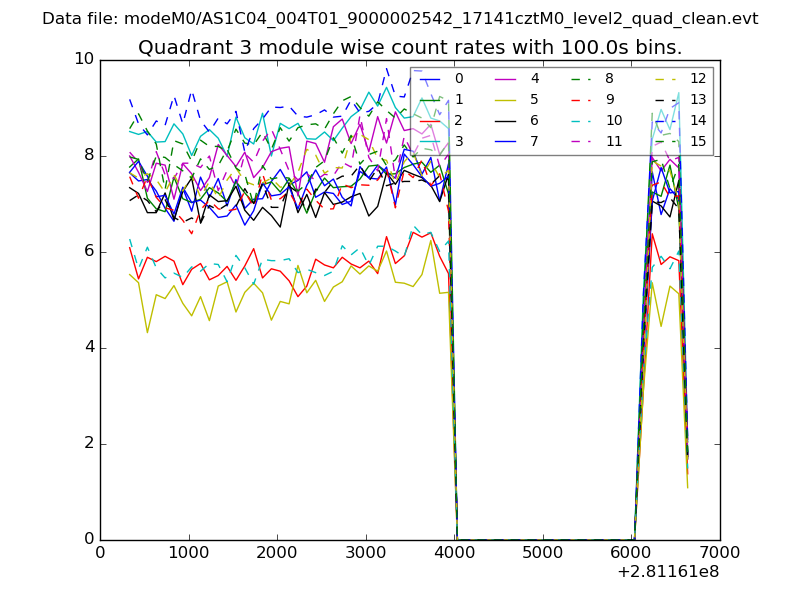
| Module-wise count rates for Quadrant A Data is divided into 100 sec bins |
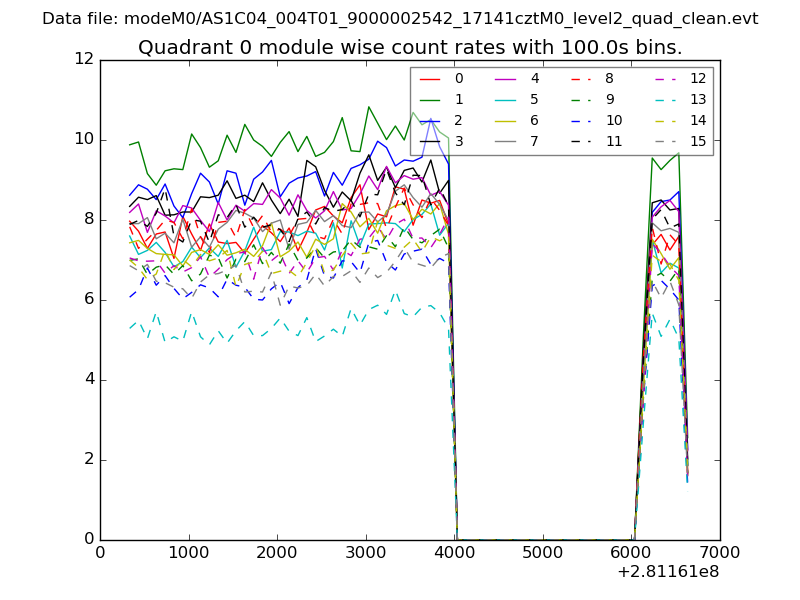 |
 |
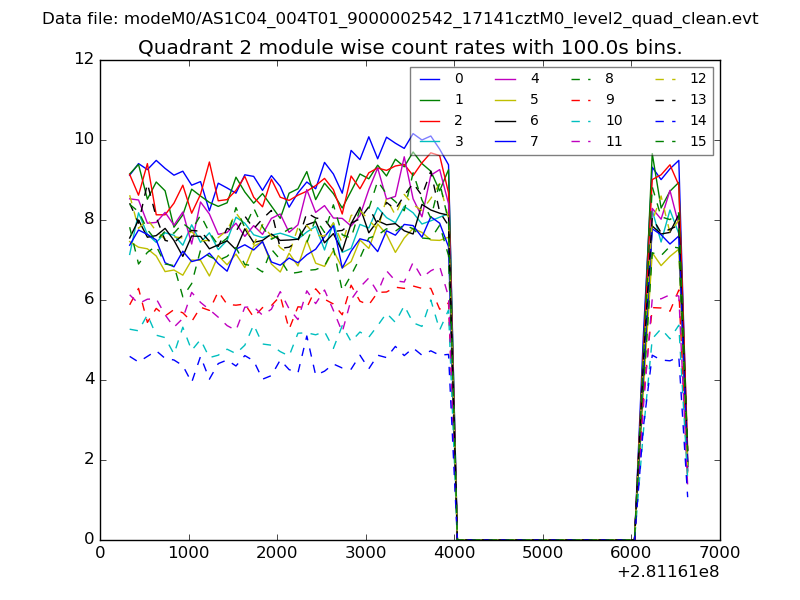
| Module-wise count rates for Quadrant B Data is divided into 100 sec bins |
 |
 |
| Module-wise count rates for Quadrant C Data is divided into 100 sec bins |
 |
 |
| Module-wise count rates for Quadrant D Data is divided into 100 sec bins |
 |
 |
| Parameter | Plot |
|---|---|
| CZT HV Monitor | 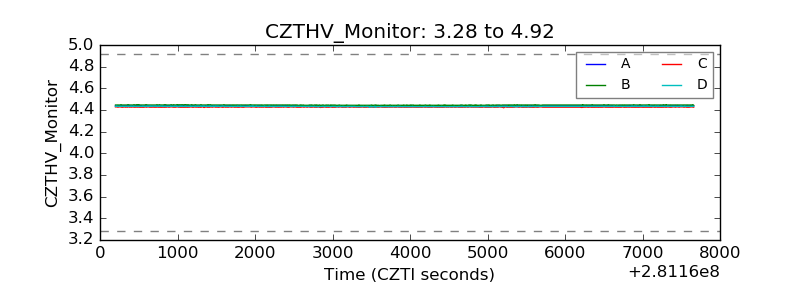 |
| D_VDD | 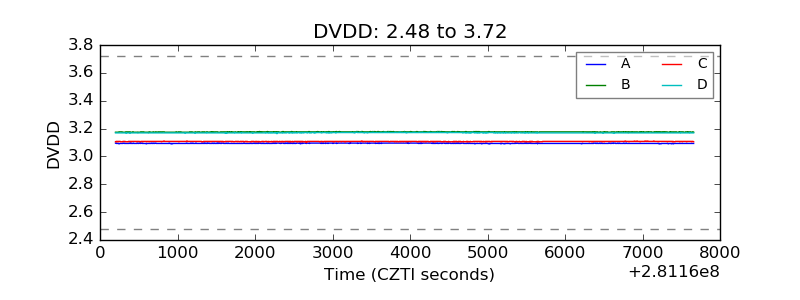 |
| Temperature 1 | 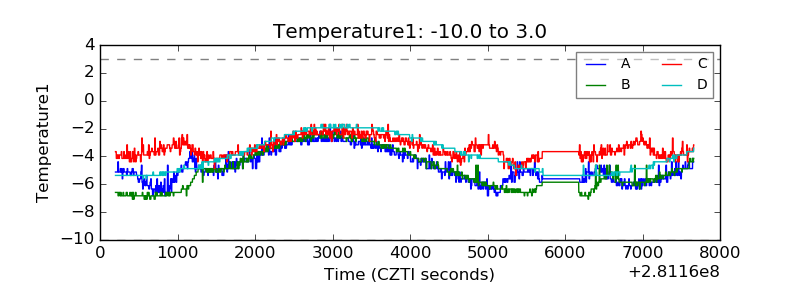 |
| Veto HV Monitor | 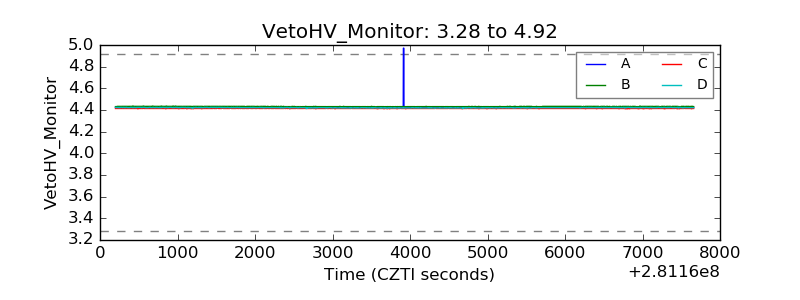 |
| Veto LLD | 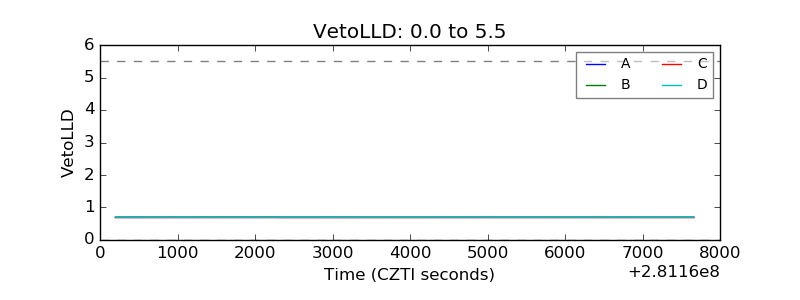 |
| Alpha Counter | 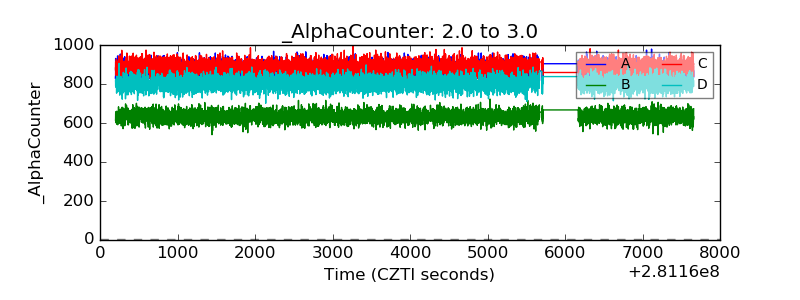 |
| _CPM_Rate | 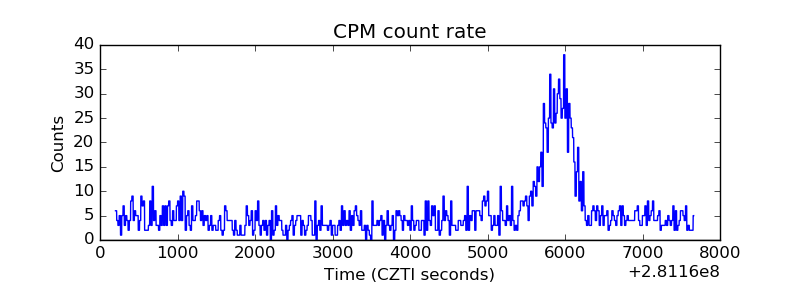 |
| CZT Counter | 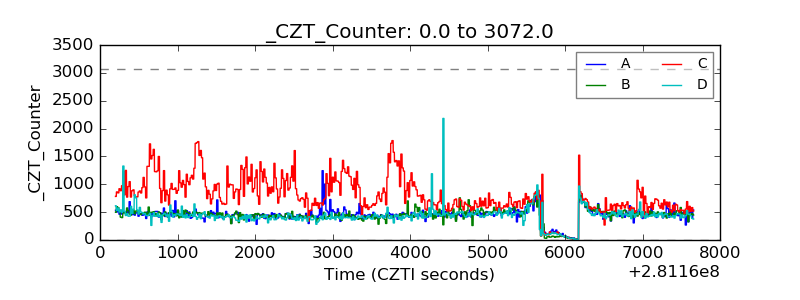 |
| +2.5 Volts monitor |  |
| +5 Volts monitor |  |
| _ROLL_ROT | 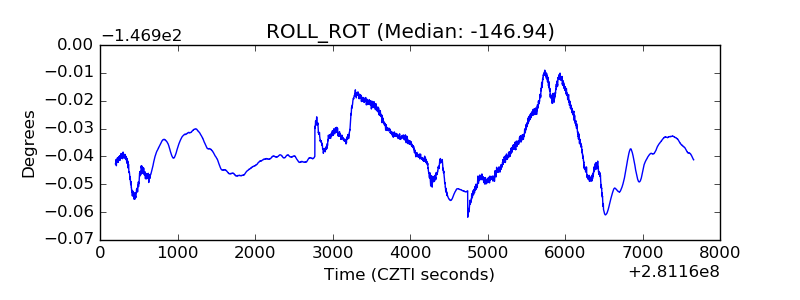 |
| _Roll_DEC | 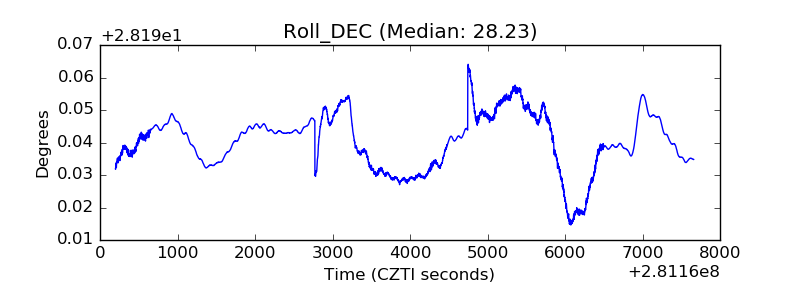 |
| _Roll_RA | 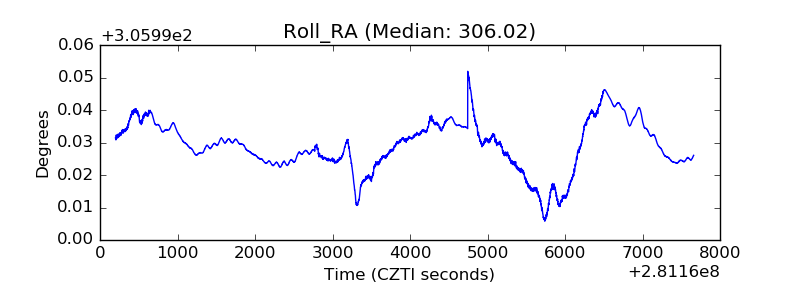 |
| Veto Counter |  |