| Param | Original file | Final file |
|---|---|---|
| Filename | modeM0/AS1C04_004T01_9000002542_17143cztM0_level2.evt | modeM0/AS1C04_004T01_9000002542_17143cztM0_level2_quad_clean.evt |
| Size (bytes) | 521,072,640 | 97,470,720 |
| Size | 496.9 MB | 93.0 MB |
| Events in quadrant A | 3,667,339 | 609,963 |
| Events in quadrant B | 3,722,210 | 623,632 |
| Events in quadrant C | 4,200,128 | 594,538 |
| Events in quadrant D | 3,666,891 | 587,102 |
| Mode SS | |||
|---|---|---|---|
| Quadrant | BADHDUFLAG | Total packets | Discarded packets |
| A | 0 | 160 | 0 |
| B | 0 | 160 | 0 |
| C | 0 | 160 | 0 |
| D | 0 | 160 | 0 |
| Mode M0 | |||
|---|---|---|---|
| Quadrant | BADHDUFLAG | Total packets | Discarded packets |
| A | 0 | 16033 | 3 |
| B | 0 | 16136 | 3 |
| C | 0 | 17507 | 3 |
| D | 0 | 16349 | 3 |
| Mode M9 | |||
|---|---|---|---|
| Quadrant | BADHDUFLAG | Total packets | Discarded packets |
| A | 0 | 4 | 0 |
| B | 0 | 4 | 0 |
| C | 0 | 4 | 0 |
| D | 0 | 4 | 0 |
| Quadrant | Total seconds | Saturated seconds | Saturation percentage |
|---|---|---|---|
| A | 7708 | 193 | 2.503892% |
| B | 7709 | 235 | 3.048385% |
| C | 7709 | 240 | 3.113244% |
| D | 7709 | 125 | 1.621481% |
Noise dominated data is calculated using 1-second bins in cleaned event files. If a bin has >2000 counts, and if more than 50% of those come from <1% of pixels, then it is considered to be noise-dominated and hence unusable.
| Quadrant | # 1 sec bins | Bins with >0 counts | Bins with >2000 counts | High rate bins dominated by noise | Noise dominated (total time) | Noise dominated (detector-on time) | Marked lightcurve |
|---|---|---|---|---|---|---|---|
| A | 8123 | 7711 | 1 | 1 | 0.01% | 0.01% | 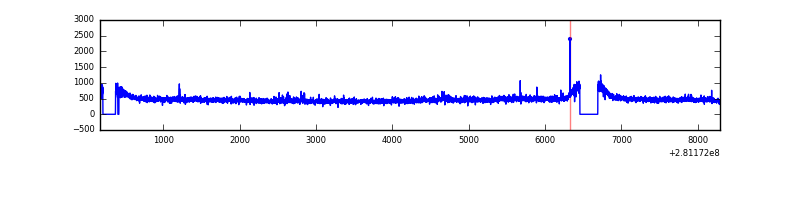 |
| B | 8124 | 7712 | 0 | 0 | 0.00% | 0.00% | 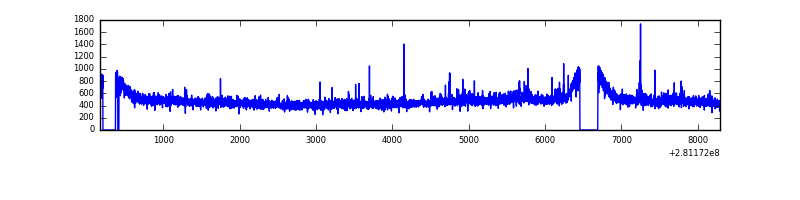 |
| C | 8124 | 7712 | 0 | 0 | 0.00% | 0.00% | 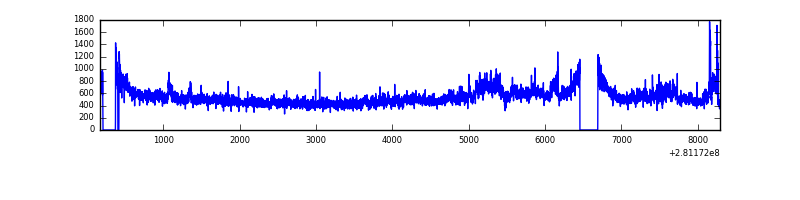 |
| D | 8124 | 7712 | 20 | 20 | 0.25% | 0.26% | 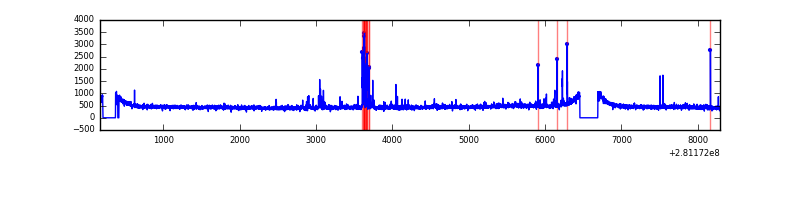 |
Top three noisy pixels from each quadrant. If the there are fewer than three noisy pixels in the level2.evt file, extra rows are filled as -1
| Pixel properties | Quadrant properties | ||||||
|---|---|---|---|---|---|---|---|
| Quadrant | DetID | PixID | Counts | Sigma | Mean | Median | Sigma |
| A | 12 | 189 | 32303 | 163.79 | 941 | 919 | 191.6 |
| A | 3 | 254 | 11989 | 57.77 | 941 | 919 | 191.6 |
| A | 0 | 226 | 8141 | 37.69 | 941 | 919 | 191.6 |
| B | 4 | 173 | 38253 | 204.12 | 938 | 912 | 182.9 |
| B | 12 | 111 | 22253 | 116.66 | 938 | 912 | 182.9 |
| B | 11 | 111 | 19388 | 101.0 | 938 | 912 | 182.9 |
| C | 3 | 233 | 557606 | 2631.79 | 896 | 899 | 211.5 |
| C | 14 | 238 | 137495 | 645.75 | 896 | 899 | 211.5 |
| C | 13 | 61 | 6356 | 25.8 | 896 | 899 | 211.5 |
| D | 1 | 52 | 97991 | 432.52 | 916 | 888 | 224.5 |
| D | 10 | 70 | 35224 | 152.94 | 916 | 888 | 224.5 |
| D | 13 | 249 | 32312 | 139.97 | 916 | 888 | 224.5 |
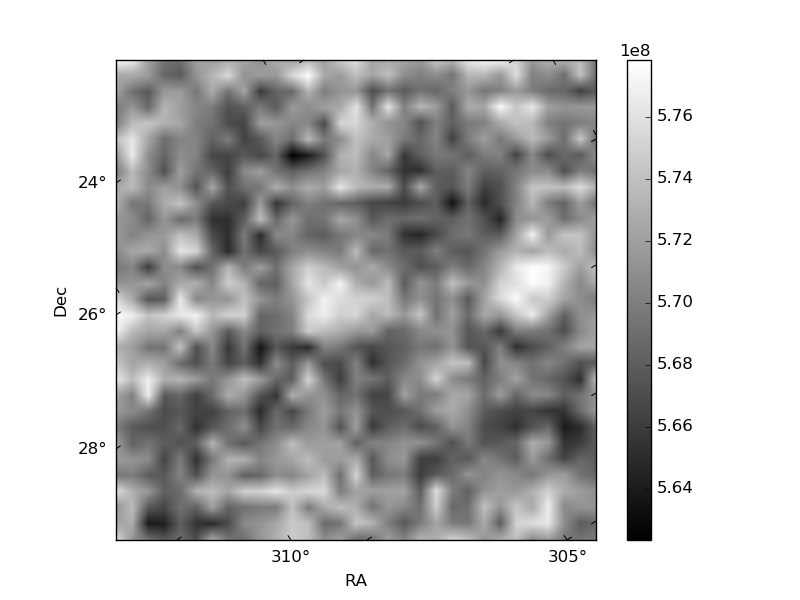
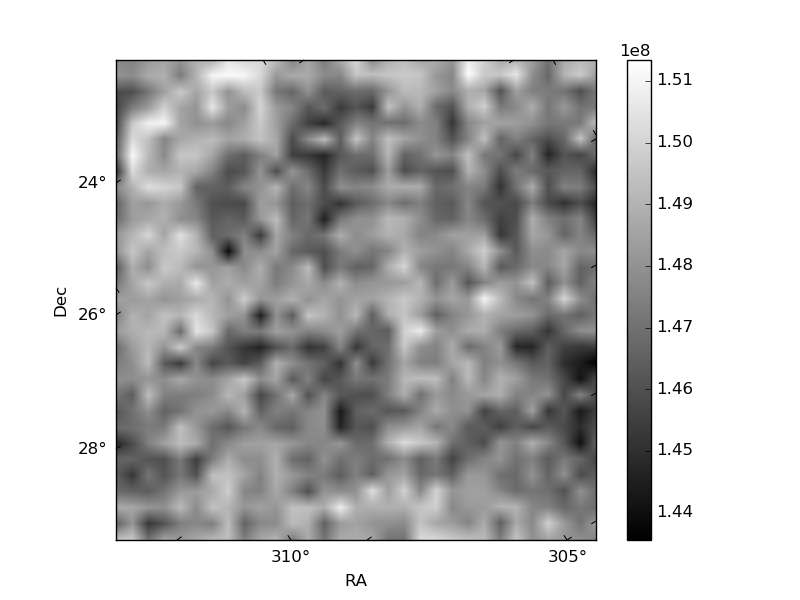
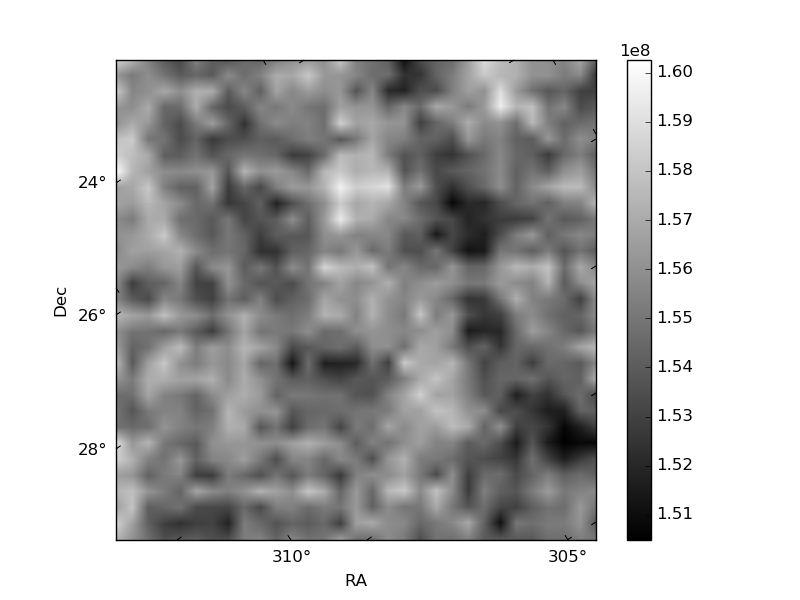
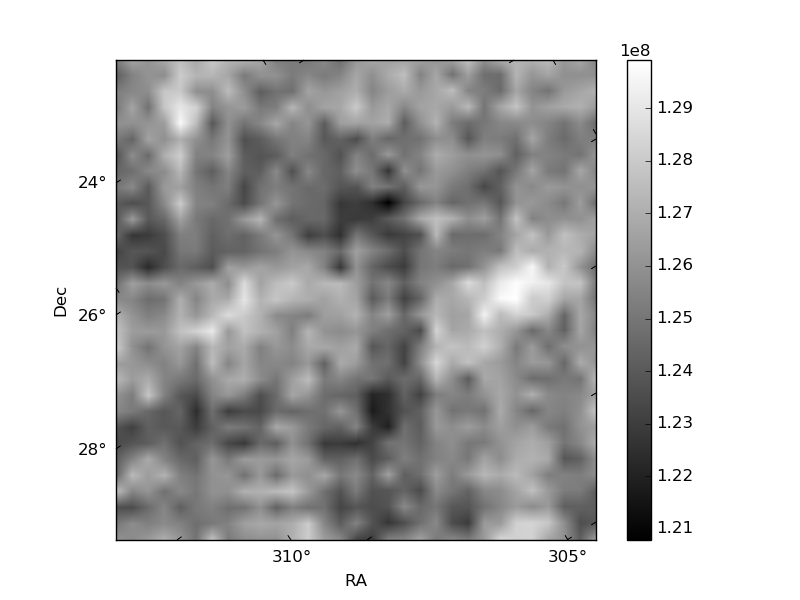
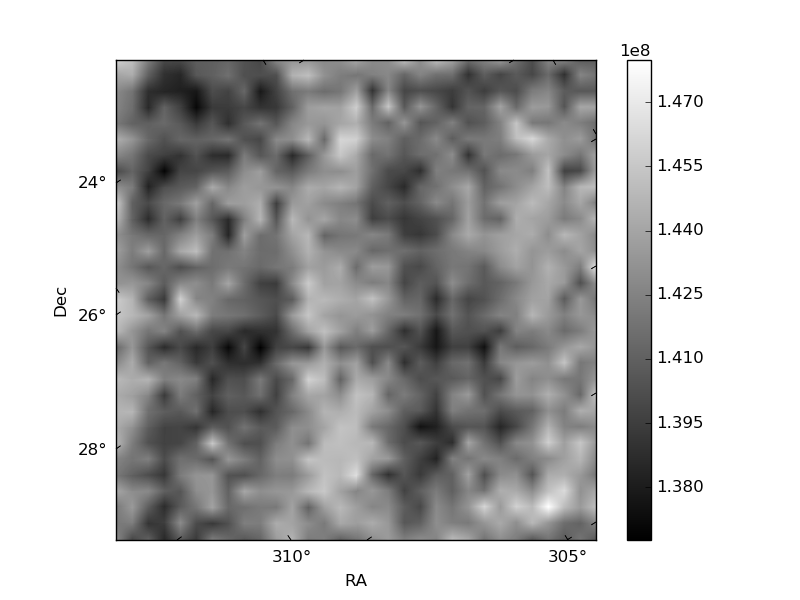
Histogram calculated using DETX and DETY for each event in the final _common_clean file
| Quadrant A | 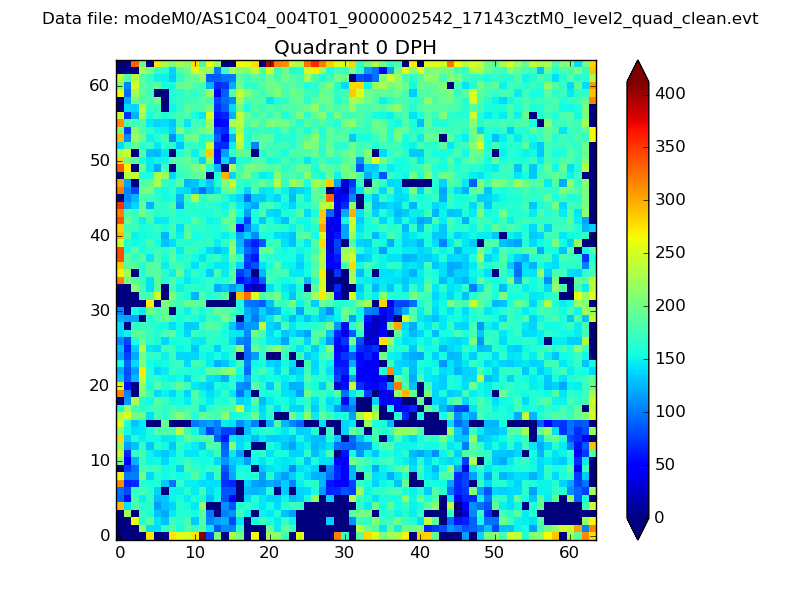 |
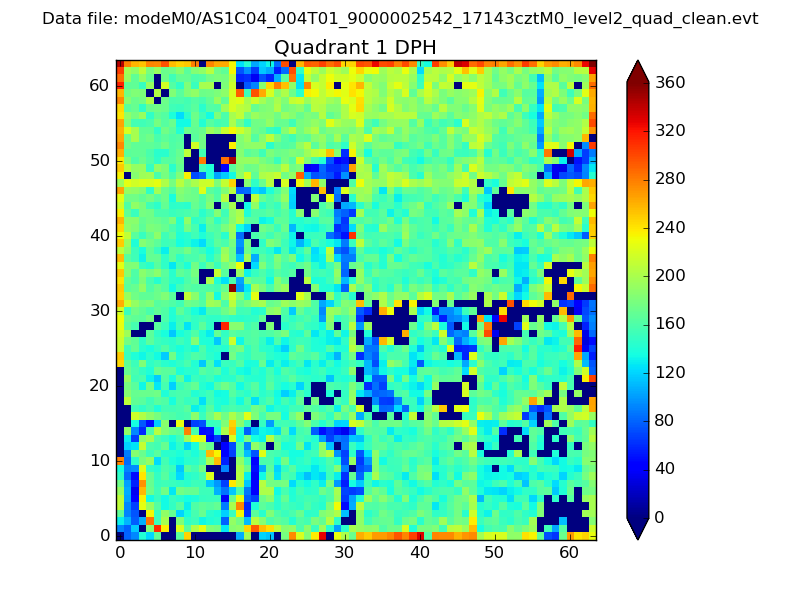 |
Quadrant B |
|---|---|---|---|
| Quadrant D | 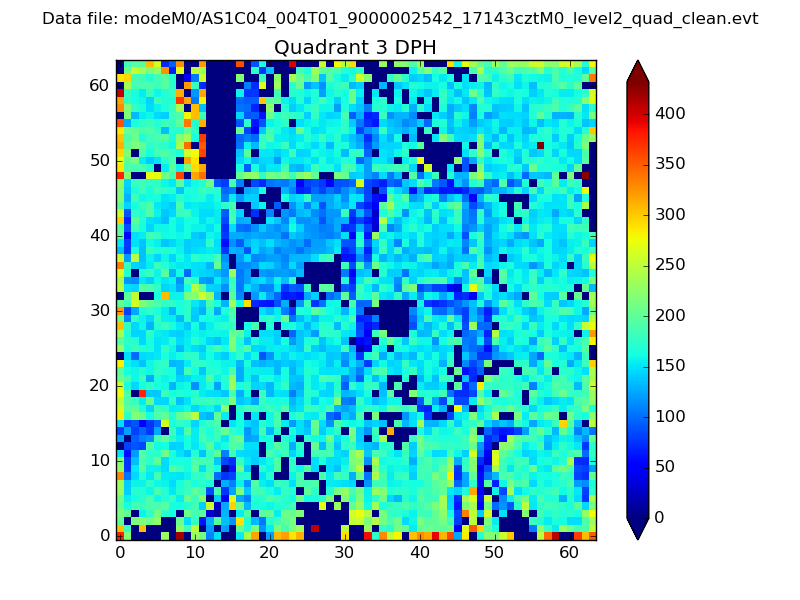 |
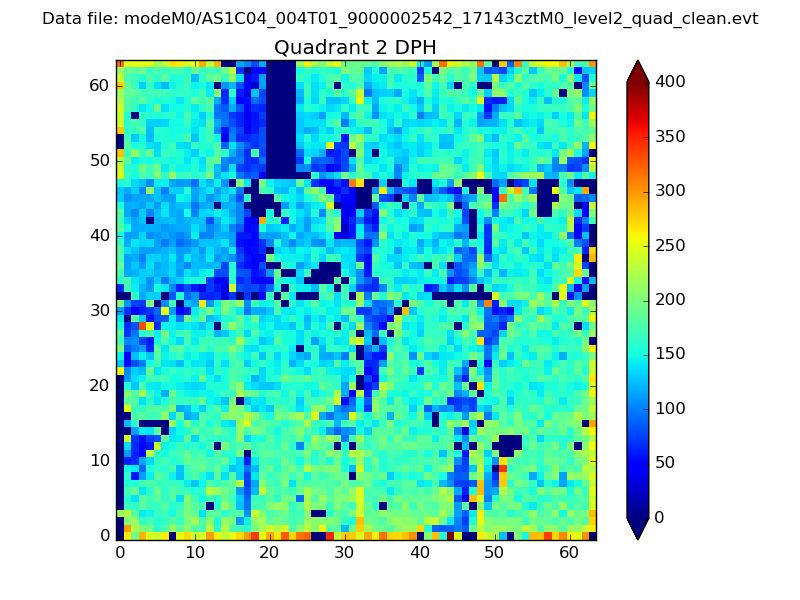 |
Quadrant C |
| Plot type | Count rate plots | Images |
|---|---|---|
| Comparison with Poisson distribution Blue bars denote a histogram of data divided into 1 sec bins. Red curve is a Poisson curve with rate = median count rate of data. |
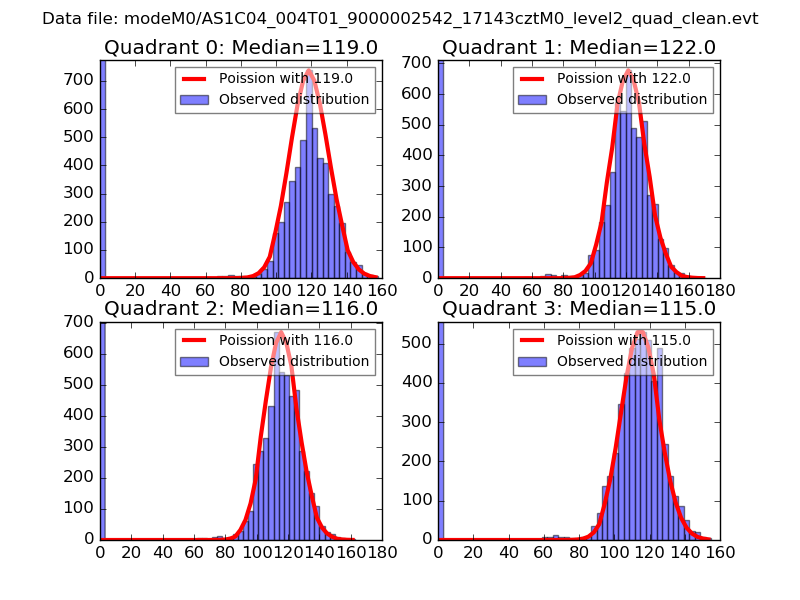 |
 |
| Quadrant-wise count rates Data is divided into 100 sec bins |
 |
|
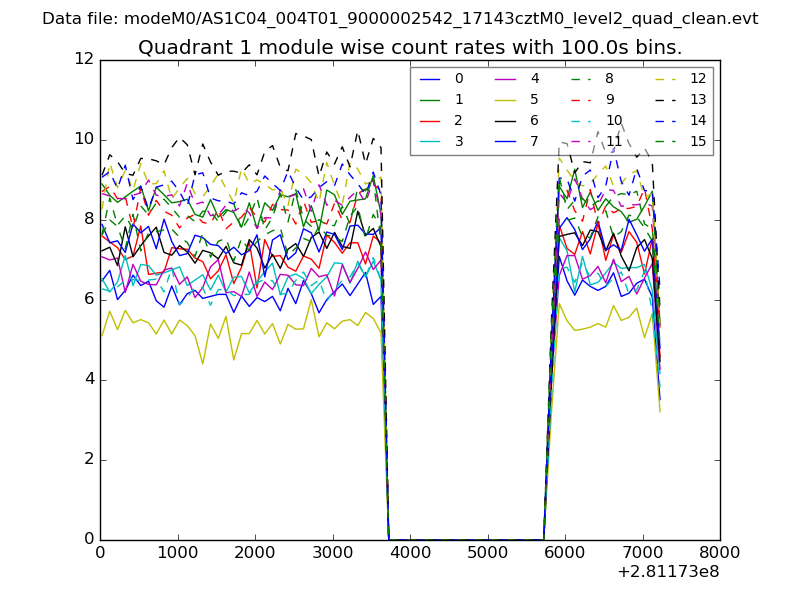
| Module-wise count rates for Quadrant A Data is divided into 100 sec bins |
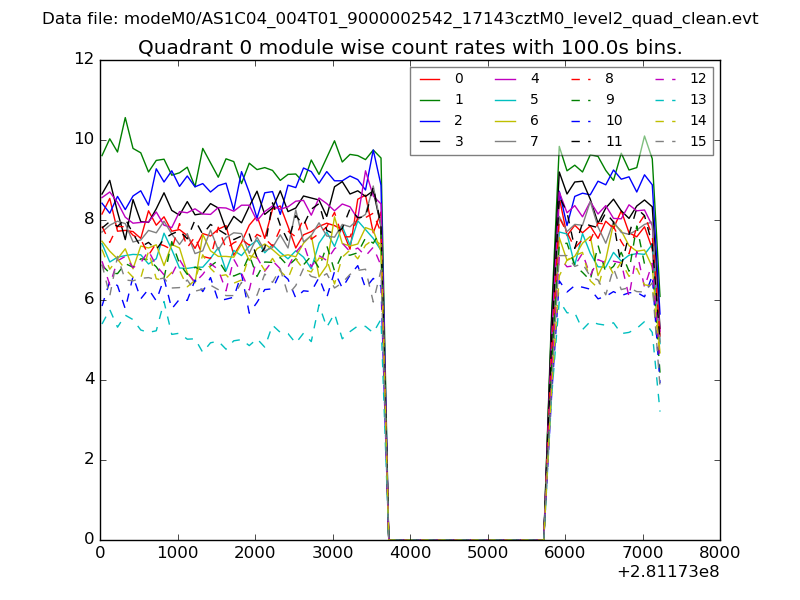 |
 |
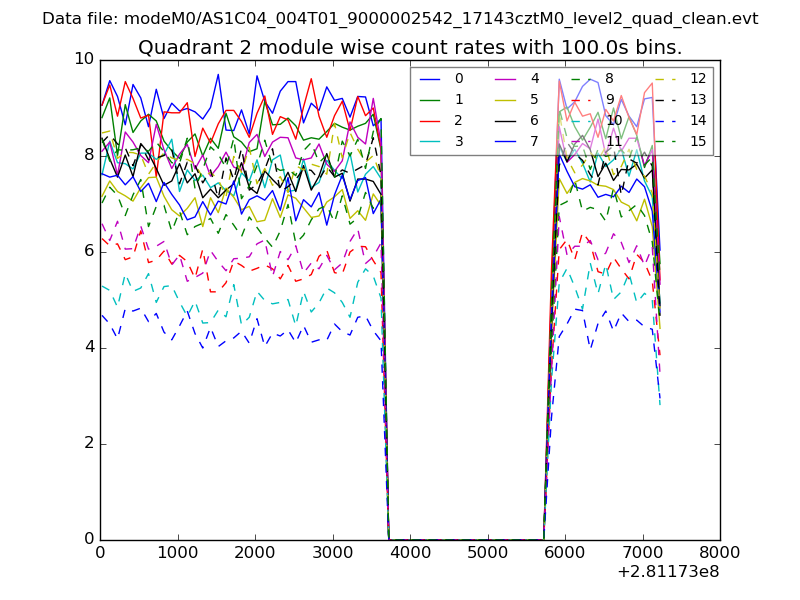
| Module-wise count rates for Quadrant B Data is divided into 100 sec bins |
 |
 |
| Module-wise count rates for Quadrant C Data is divided into 100 sec bins |
 |
 |
| Module-wise count rates for Quadrant D Data is divided into 100 sec bins |
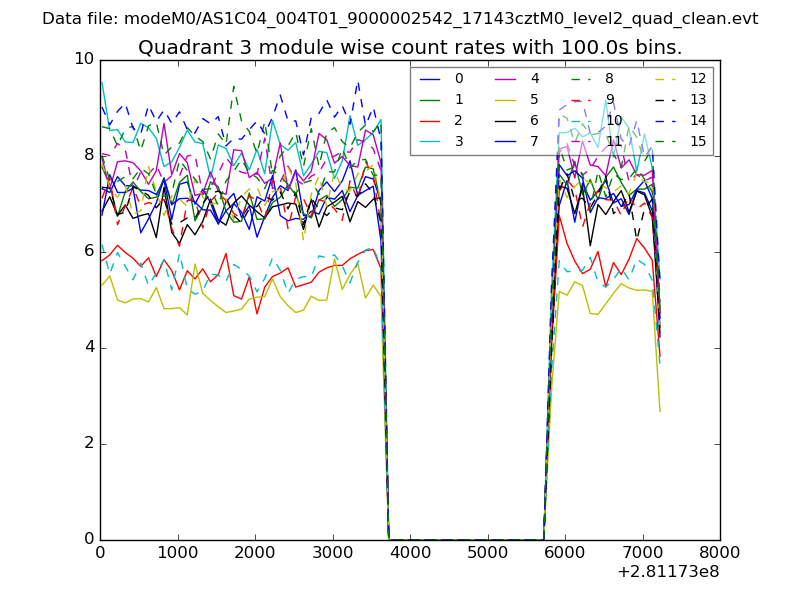 |
 |
| Parameter | Plot |
|---|---|
| CZT HV Monitor | 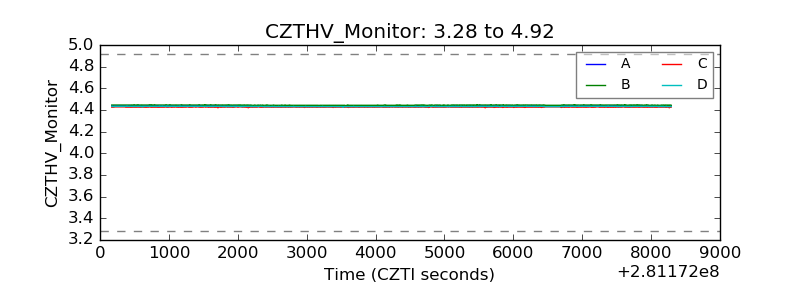 |
| D_VDD | 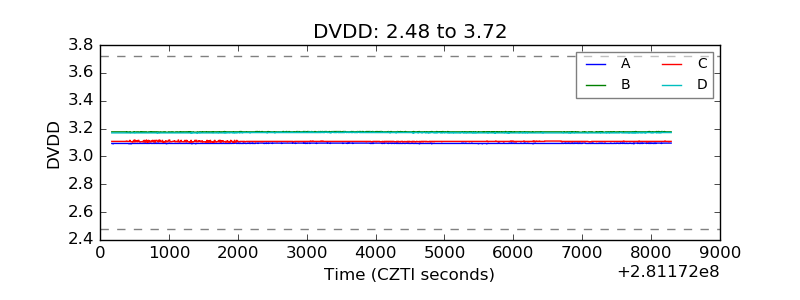 |
| Temperature 1 | 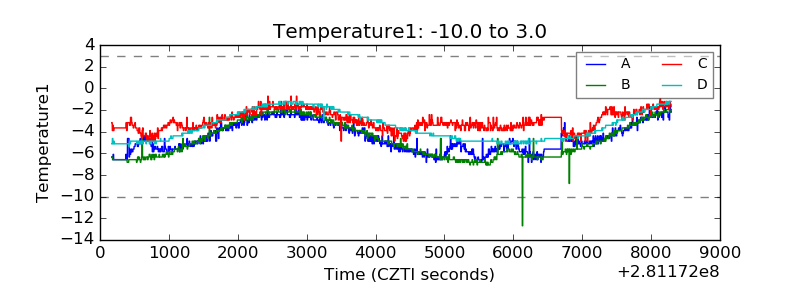 |
| Veto HV Monitor | 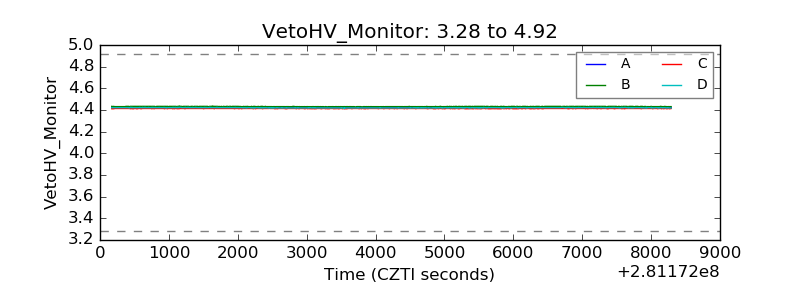 |
| Veto LLD | 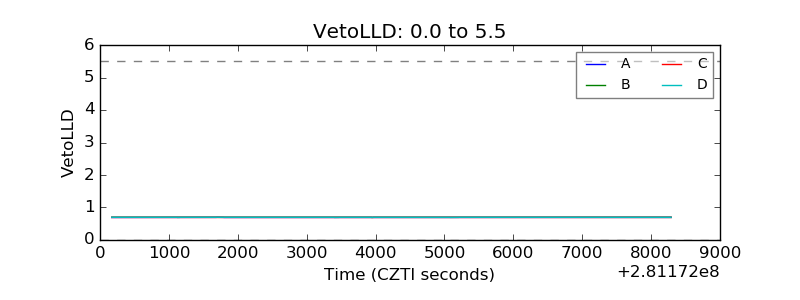 |
| Alpha Counter | 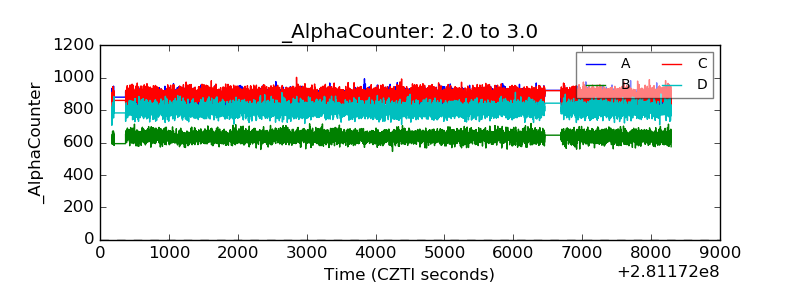 |
| _CPM_Rate | 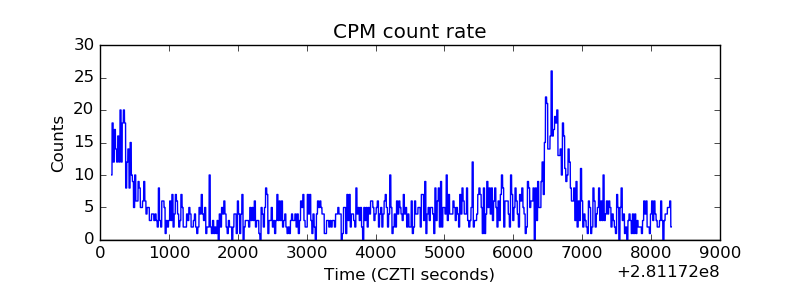 |
| CZT Counter | 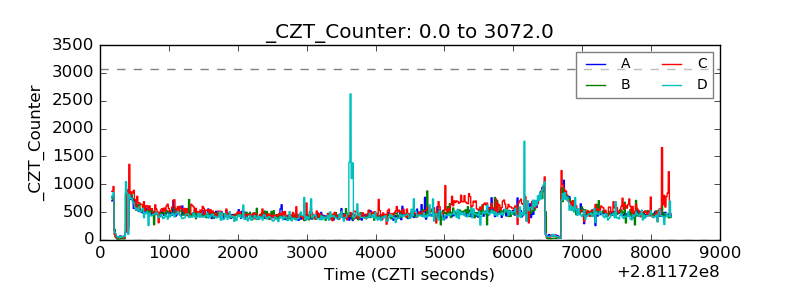 |
| +2.5 Volts monitor | 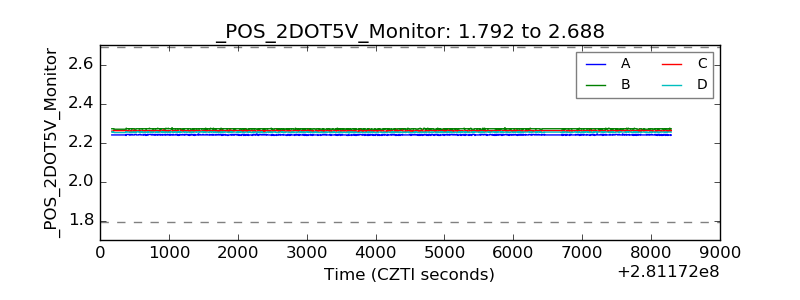 |
| +5 Volts monitor |  |
| _ROLL_ROT | 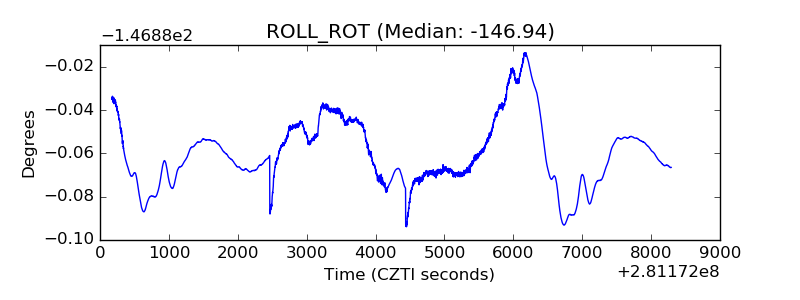 |
| _Roll_DEC | 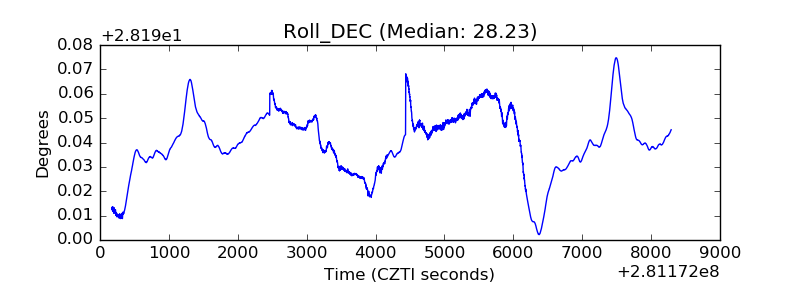 |
| _Roll_RA | 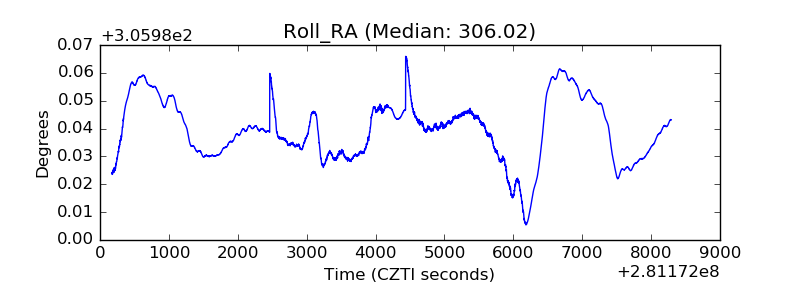 |
| Veto Counter | 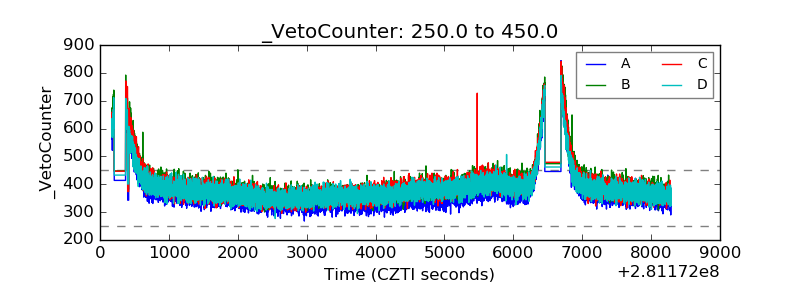 |