| Param | Original file | Final file |
|---|---|---|
| Filename | modeM0/AS1T03_059T01_9000002546cztM0_level2.fits | modeM0/AS1T03_059T01_9000002546cztM0_level2_quad_clean.evt |
| Size (bytes) | 712,728,000 | 632,672,640 |
| Size | 679.7 MB | 603.4 MB |
| Events in quadrant A | 4,347,558 | 3,721,107 |
| Events in quadrant B | 4,233,740 | 3,729,847 |
| Events in quadrant C | 4,224,050 | 3,432,144 |
| Events in quadrant D | 3,723,632 | 3,221,268 |
| Mode M0 | |||
|---|---|---|---|
| Quadrant | BADHDUFLAG | Total packets | Discarded packets |
| A | 0 | 154083 | 0 |
| B | 0 | 152507 | 0 |
| C | 0 | 171445 | 0 |
| D | 0 | 159917 | 0 |
| Mode M9 | |||
|---|---|---|---|
| Quadrant | BADHDUFLAG | Total packets | Discarded packets |
| A | 0 | 113 | 0 |
| B | 0 | 113 | 0 |
| C | 0 | 113 | 0 |
| D | 0 | 113 | 0 |
| Mode SS | |||
|---|---|---|---|
| Quadrant | BADHDUFLAG | Total packets | Discarded packets |
| A | 0 | 1504 | 0 |
| B | 0 | 1504 | 0 |
| C | 0 | 1504 | 0 |
| D | 0 | 1504 | 0 |
| Quadrant | Total seconds | Saturated seconds | Saturation percentage |
|---|---|---|---|
| A | 73702 | 1016 | 1.378524% |
| B | 73702 | 1093 | 1.482999% |
| C | 73702 | 1906 | 2.586090% |
| D | 73702 | 1496 | 2.029796% |
Noise dominated data is calculated using 1-second bins in cleaned event files. If a bin has >2000 counts, and if more than 50% of those come from <1% of pixels, then it is considered to be noise-dominated and hence unusable.
| Quadrant | # 1 sec bins | Bins with >0 counts | Bins with >2000 counts | High rate bins dominated by noise | Noise dominated (total time) | Noise dominated (detector-on time) | Marked lightcurve |
|---|---|---|---|---|---|---|---|
| A | 84611 | 73695 | 0 | 0 | 0.00% | 0.00% |  |
| B | 84611 | 73694 | 0 | 0 | 0.00% | 0.00% |  |
| C | 84611 | 73668 | 0 | 0 | 0.00% | 0.00% |  |
| D | 84611 | 73689 | 0 | 0 | 0.00% | 0.00% |  |
Top three noisy pixels from each quadrant. If the there are fewer than three noisy pixels in the level2.evt file, extra rows are filled as -1
| Pixel properties | Quadrant properties | ||||||
|---|---|---|---|---|---|---|---|
| Quadrant | DetID | PixID | Counts | Sigma | Mean | Median | Sigma |
| A | 0 | 29 | 4060 | 10.58 | 1129 | 1055 | 284.1 |
| A | 7 | 110 | 3489 | 8.57 | 1129 | 1055 | 284.1 |
| A | 0 | 30 | 3288 | 7.86 | 1129 | 1055 | 284.1 |
| B | 2 | 9 | 3468 | 10.68 | 1117 | 1062 | 225.2 |
| B | 2 | 8 | 2899 | 8.16 | 1117 | 1062 | 225.2 |
| B | 5 | 128 | 2823 | 7.82 | 1117 | 1062 | 225.2 |
| C | 1 | 80 | 3261 | 7.69 | 1115 | 1037 | 289.2 |
| C | 1 | 81 | 3164 | 7.35 | 1115 | 1037 | 289.2 |
| C | 12 | 241 | 2957 | 6.64 | 1115 | 1037 | 289.2 |
| D | 3 | 14 | 2824 | 6.5 | 1062 | 967 | 285.6 |
| D | 6 | 231 | 2710 | 6.1 | 1062 | 967 | 285.6 |
| D | 6 | 67 | 2608 | 5.75 | 1062 | 967 | 285.6 |
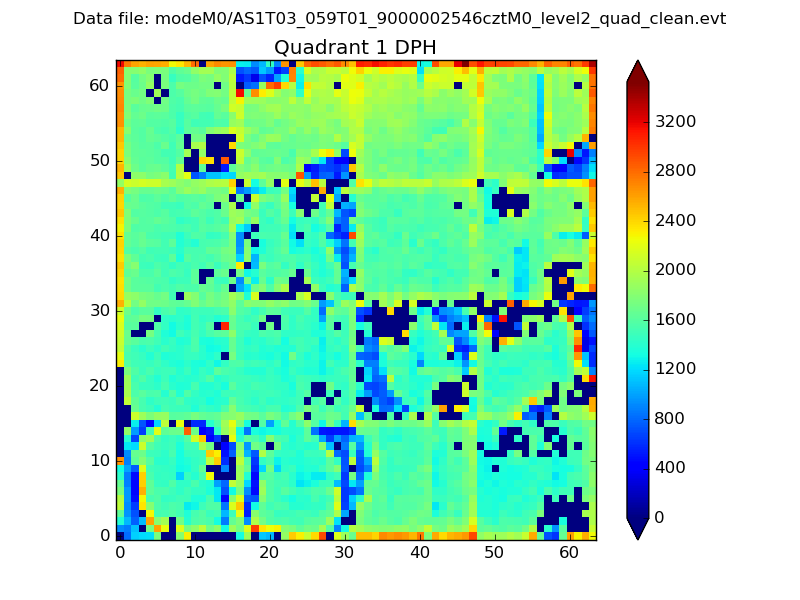
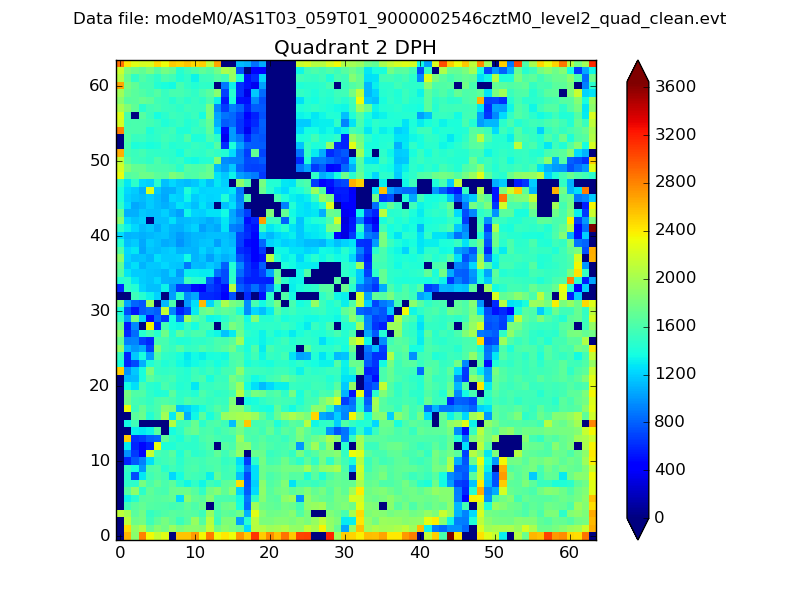
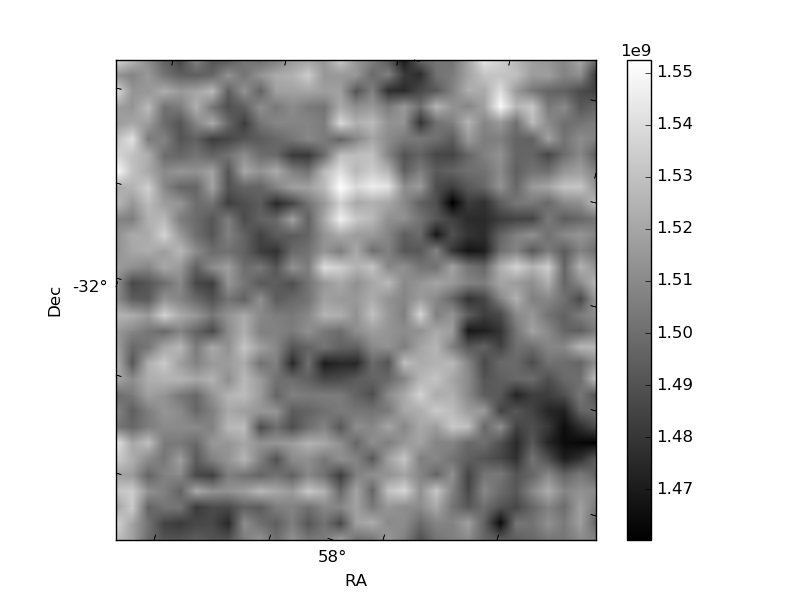
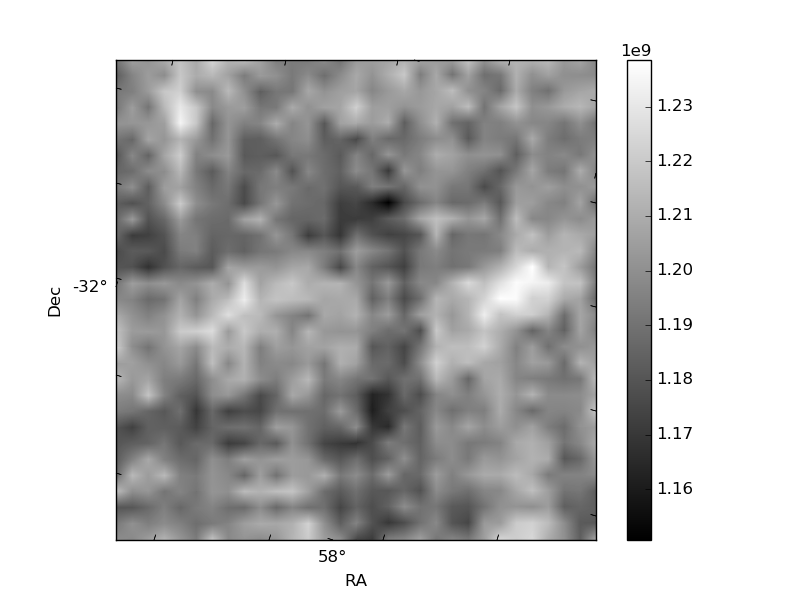
Histogram calculated using DETX and DETY for each event in the final _common_clean file
| Quadrant A |  |
 |
Quadrant B |
|---|---|---|---|
| Quadrant D |  |
 |
Quadrant C |
| Plot type | Count rate plots | Images |
|---|---|---|
| Comparison with Poisson distribution Blue bars denote a histogram of data divided into 1 sec bins. Red curve is a Poisson curve with rate = median count rate of data. |
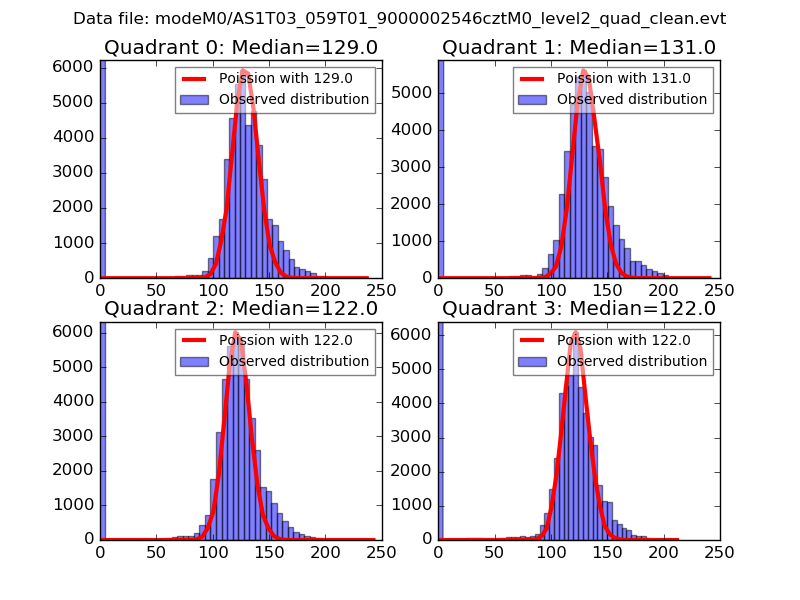 |
 |
| Quadrant-wise count rates Data is divided into 100 sec bins |
 |
|
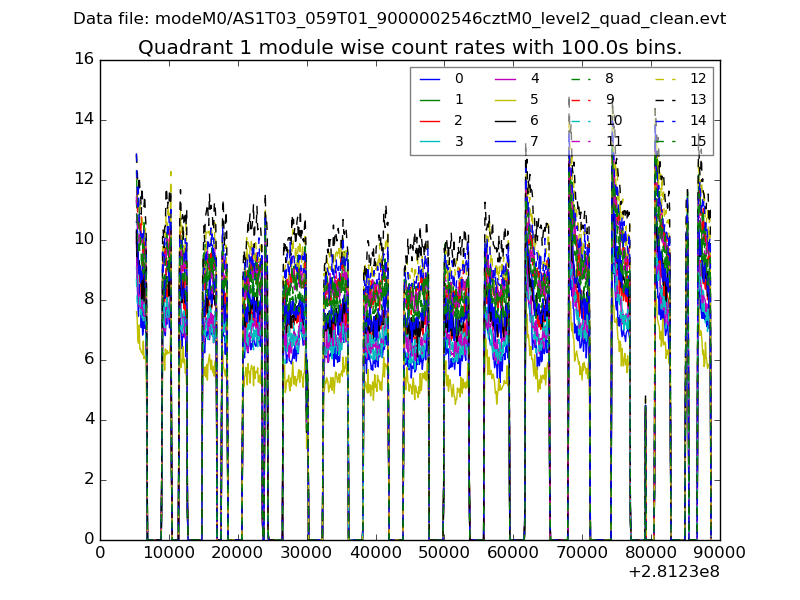
| Module-wise count rates for Quadrant A Data is divided into 100 sec bins |
 |
 |
| Module-wise count rates for Quadrant B Data is divided into 100 sec bins |
 |
 |
| Module-wise count rates for Quadrant C Data is divided into 100 sec bins |
 |
 |
| Module-wise count rates for Quadrant D Data is divided into 100 sec bins |
 |
 |
| Parameter | Plot |
|---|---|
| CZT HV Monitor |  |
| D_VDD |  |
| Temperature 1 |  |
| Veto HV Monitor |  |
| Veto LLD | 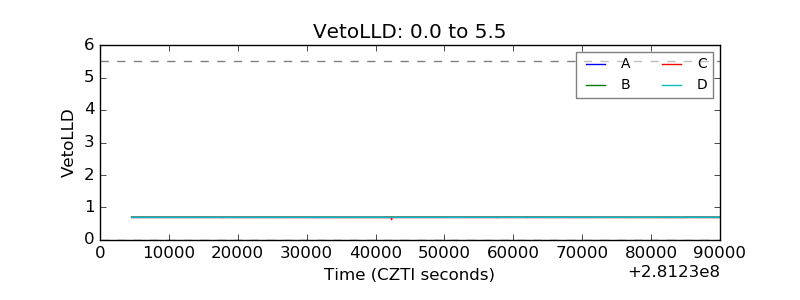 |
| Alpha Counter |  |
| _CPM_Rate |  |
| CZT Counter |  |
| +2.5 Volts monitor |  |
| +5 Volts monitor |  |
| _ROLL_ROT | 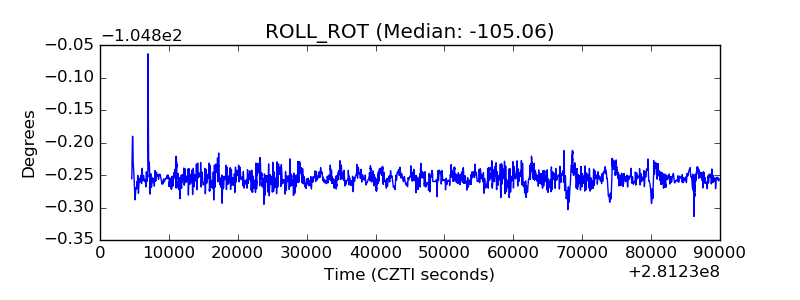 |
| _Roll_DEC |  |
| _Roll_RA |  |
| Veto Counter |  |