| Param | Original file | Final file |
|---|---|---|
| Filename | modeM0/AS1T03_059T01_9000002546_17153cztM0_level2.evt | modeM0/AS1T03_059T01_9000002546_17153cztM0_level2_quad_clean.evt |
| Size (bytes) | 114,122,880 | 31,351,680 |
| Size | 108.8 MB | 29.9 MB |
| Events in quadrant A | 717,452 | 214,153 |
| Events in quadrant B | 744,707 | 220,410 |
| Events in quadrant C | 1,172,422 | 202,529 |
| Events in quadrant D | 717,596 | 201,536 |
| Mode M0 | |||
|---|---|---|---|
| Quadrant | BADHDUFLAG | Total packets | Discarded packets |
| A | 0 | 3045 | 1 |
| B | 0 | 3108 | 1 |
| C | 0 | 4656 | 1 |
| D | 0 | 3113 | 1 |
| Mode M9 | |||
|---|---|---|---|
| Quadrant | BADHDUFLAG | Total packets | Discarded packets |
| A | 0 | 7 | 0 |
| B | 0 | 7 | 0 |
| C | 0 | 7 | 0 |
| D | 0 | 7 | 0 |
| Mode SS | |||
|---|---|---|---|
| Quadrant | BADHDUFLAG | Total packets | Discarded packets |
| A | 0 | 30 | 0 |
| B | 0 | 30 | 0 |
| C | 0 | 30 | 0 |
| D | 0 | 30 | 0 |
| Quadrant | Total seconds | Saturated seconds | Saturation percentage |
|---|---|---|---|
| A | 1488 | 1 | 0.067204% |
| B | 1488 | 3 | 0.201613% |
| C | 1488 | 32 | 2.150538% |
| D | 1488 | 7 | 0.470430% |
Noise dominated data is calculated using 1-second bins in cleaned event files. If a bin has >2000 counts, and if more than 50% of those come from <1% of pixels, then it is considered to be noise-dominated and hence unusable.
| Quadrant | # 1 sec bins | Bins with >0 counts | Bins with >2000 counts | High rate bins dominated by noise | Noise dominated (total time) | Noise dominated (detector-on time) | Marked lightcurve |
|---|---|---|---|---|---|---|---|
| A | 1488 | 1488 | 0 | 0 | 0.00% | 0.00% | 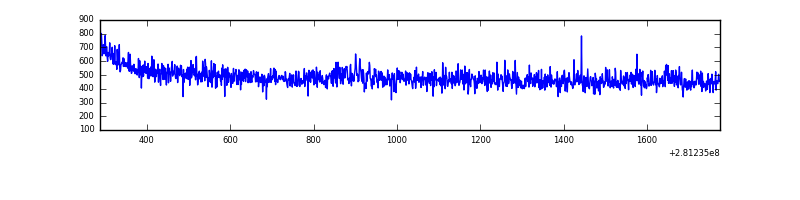 |
| B | 1488 | 1488 | 0 | 0 | 0.00% | 0.00% | 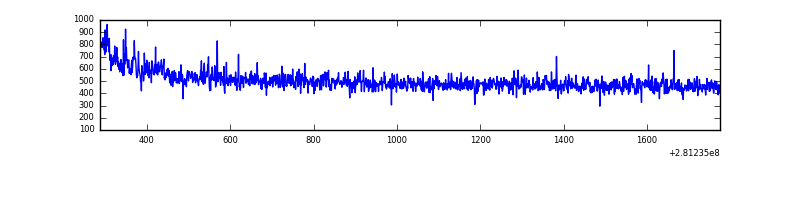 |
| C | 1488 | 1488 | 1 | 1 | 0.07% | 0.07% | 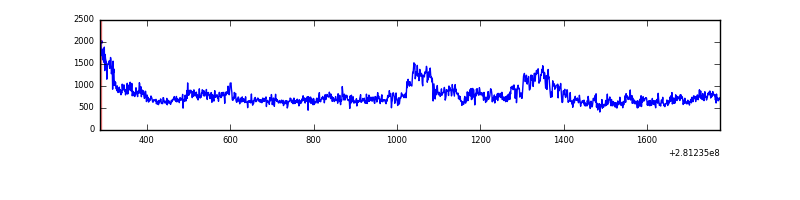 |
| D | 1488 | 1488 | 5 | 5 | 0.34% | 0.34% | 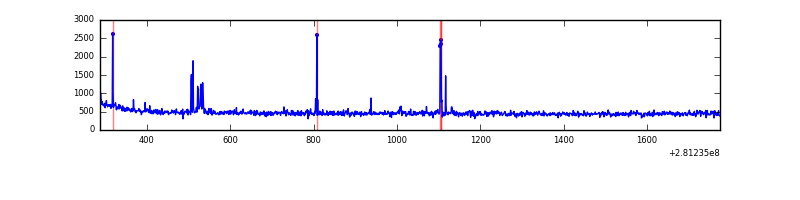 |
Top three noisy pixels from each quadrant. If the there are fewer than three noisy pixels in the level2.evt file, extra rows are filled as -1
| Pixel properties | Quadrant properties | ||||||
|---|---|---|---|---|---|---|---|
| Quadrant | DetID | PixID | Counts | Sigma | Mean | Median | Sigma |
| A | 12 | 189 | 6819 | 170.9 | 184 | 181 | 38.8 |
| A | 12 | 96 | 1857 | 43.15 | 184 | 181 | 38.8 |
| A | 4 | 2 | 1581 | 36.04 | 184 | 181 | 38.8 |
| B | 0 | 197 | 5259 | 137.19 | 188 | 183 | 37.0 |
| B | 12 | 111 | 4121 | 106.43 | 188 | 183 | 37.0 |
| B | 11 | 111 | 3260 | 83.16 | 188 | 183 | 37.0 |
| C | 3 | 233 | 447277 | 10321.88 | 178 | 179 | 43.3 |
| C | 14 | 238 | 27615 | 633.4 | 178 | 179 | 43.3 |
| C | 9 | 160 | 1733 | 35.88 | 178 | 179 | 43.3 |
| D | 10 | 70 | 24007 | 536.5 | 179 | 174 | 44.4 |
| D | 2 | 234 | 5193 | 112.98 | 179 | 174 | 44.4 |
| D | 7 | 223 | 3446 | 73.66 | 179 | 174 | 44.4 |
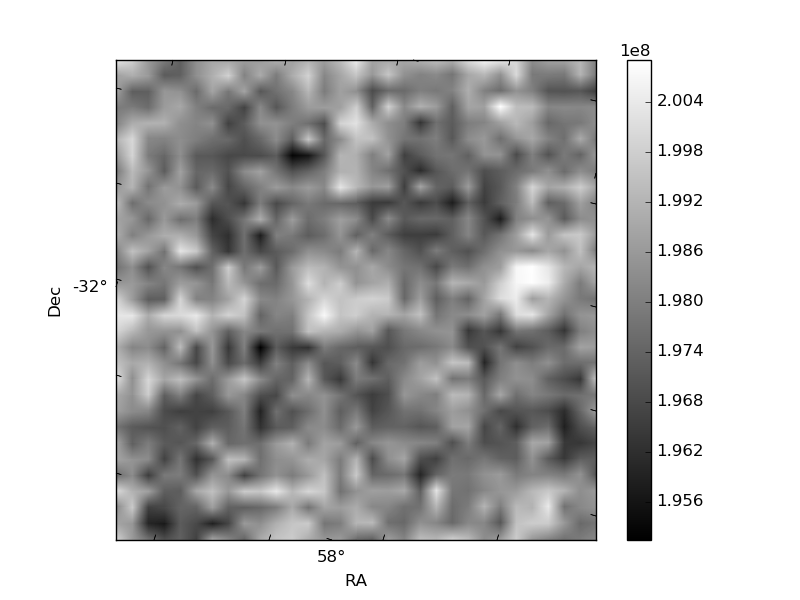
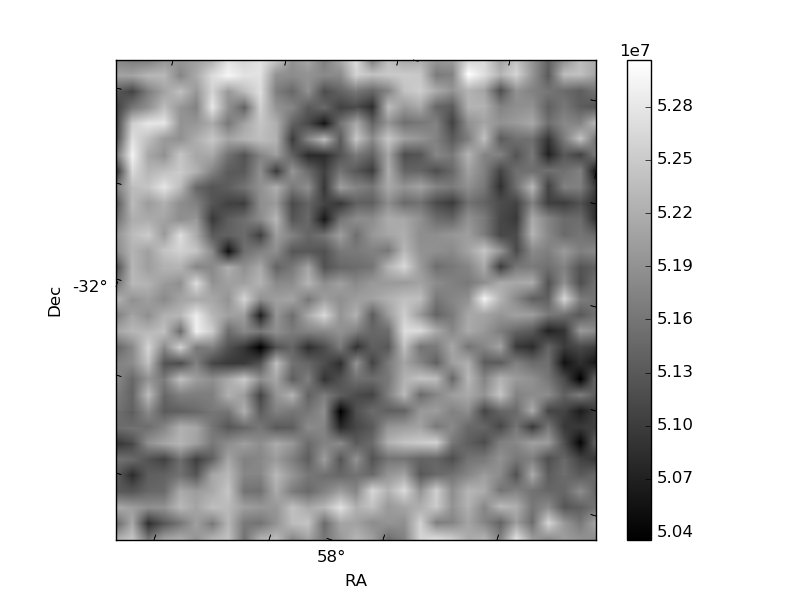
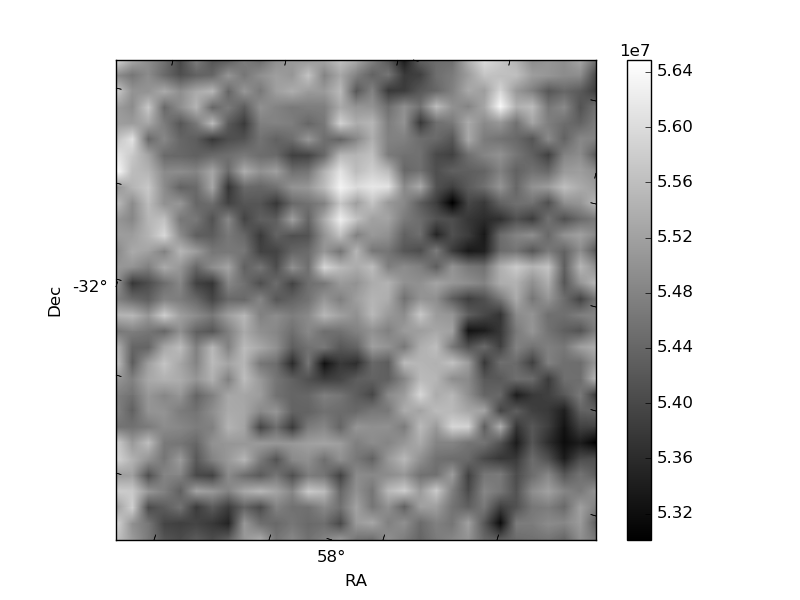
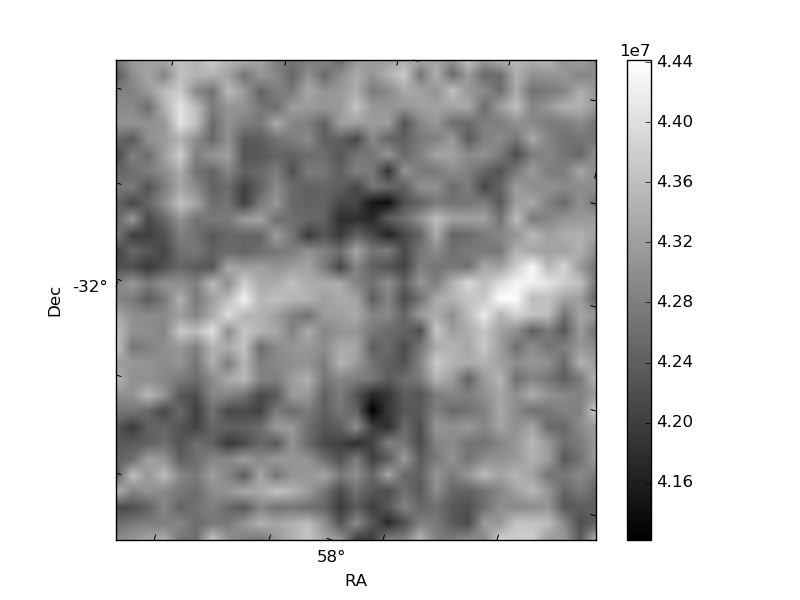
Histogram calculated using DETX and DETY for each event in the final _common_clean file
| Quadrant A | 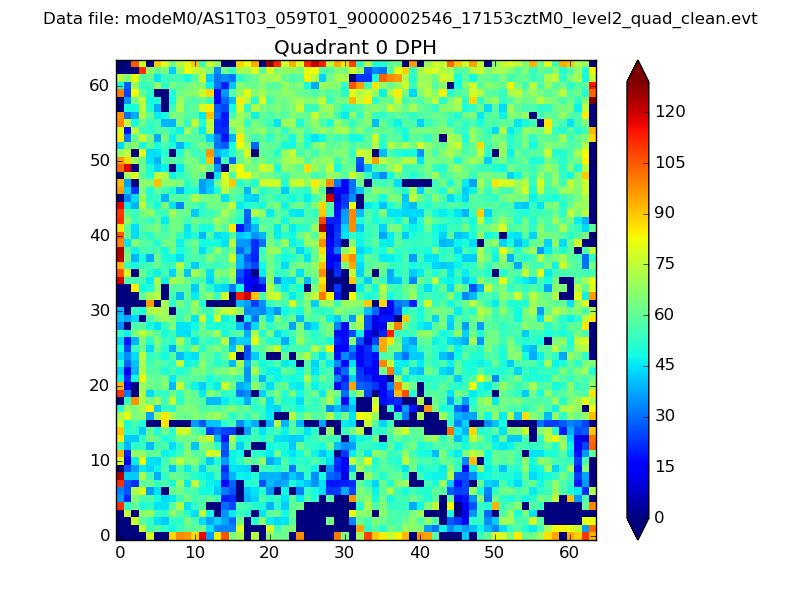 |
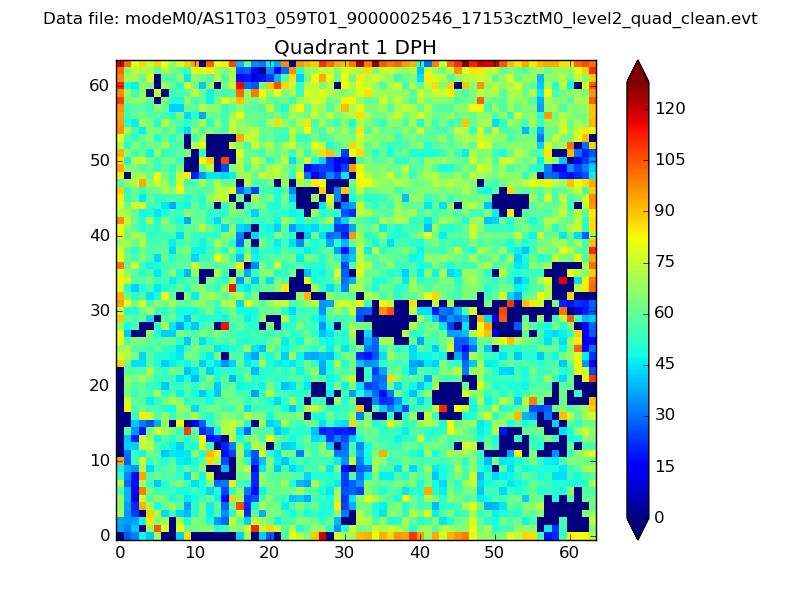 |
Quadrant B |
|---|---|---|---|
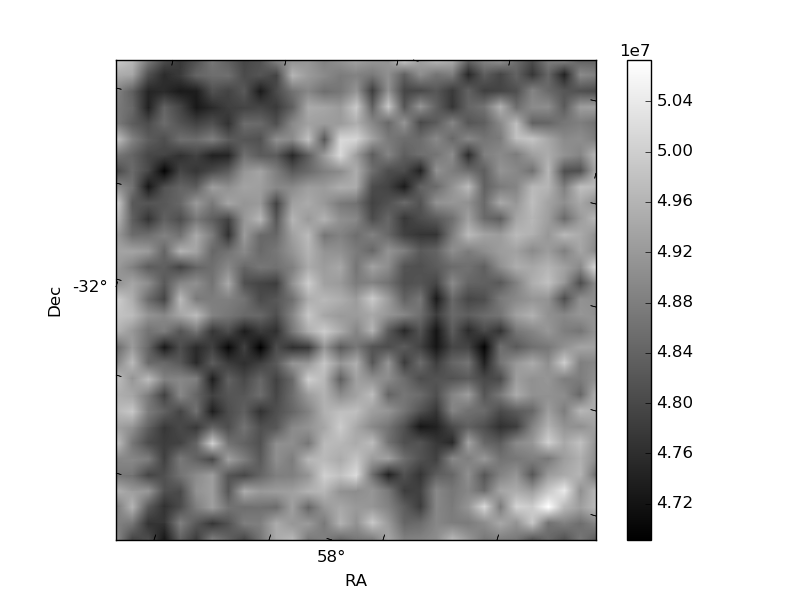
| Quadrant D |  |
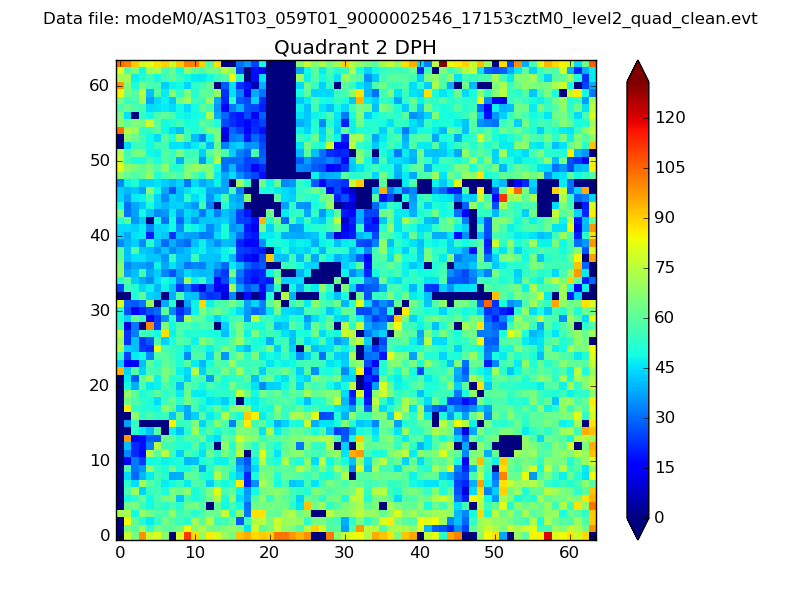 |
Quadrant C |
| Plot type | Count rate plots | Images |
|---|---|---|
| Comparison with Poisson distribution Blue bars denote a histogram of data divided into 1 sec bins. Red curve is a Poisson curve with rate = median count rate of data. |
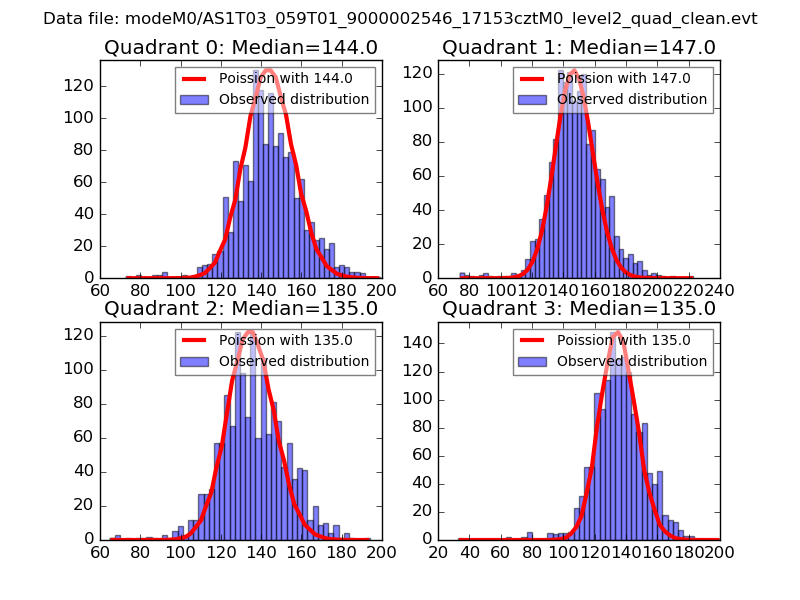 |
 |
| Quadrant-wise count rates Data is divided into 100 sec bins |
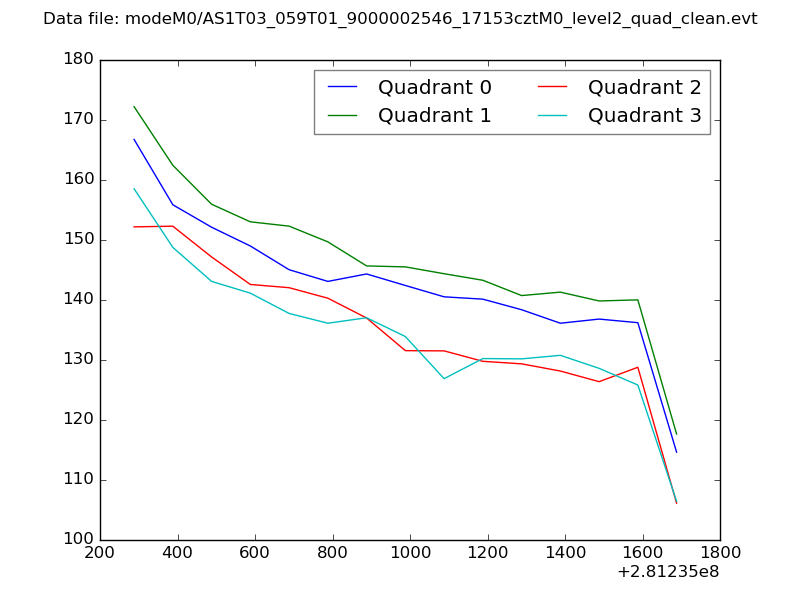 |
|
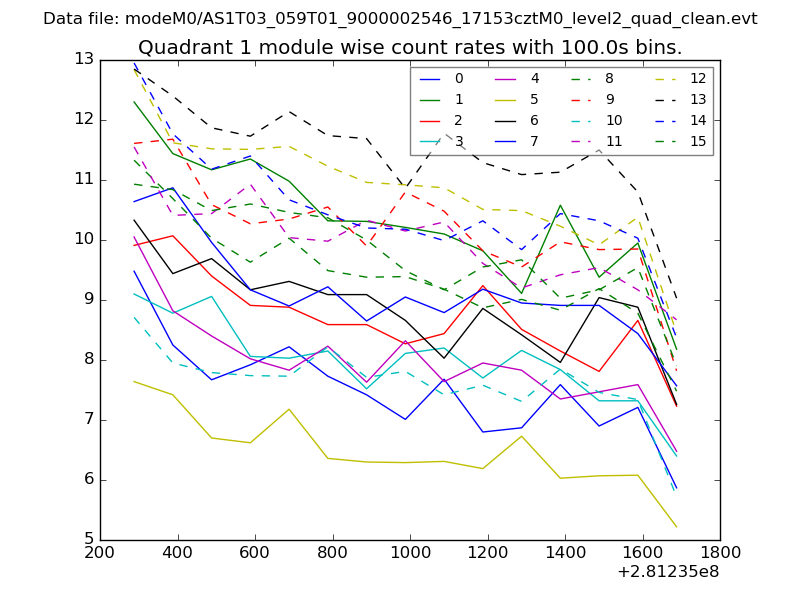
| Module-wise count rates for Quadrant A Data is divided into 100 sec bins |
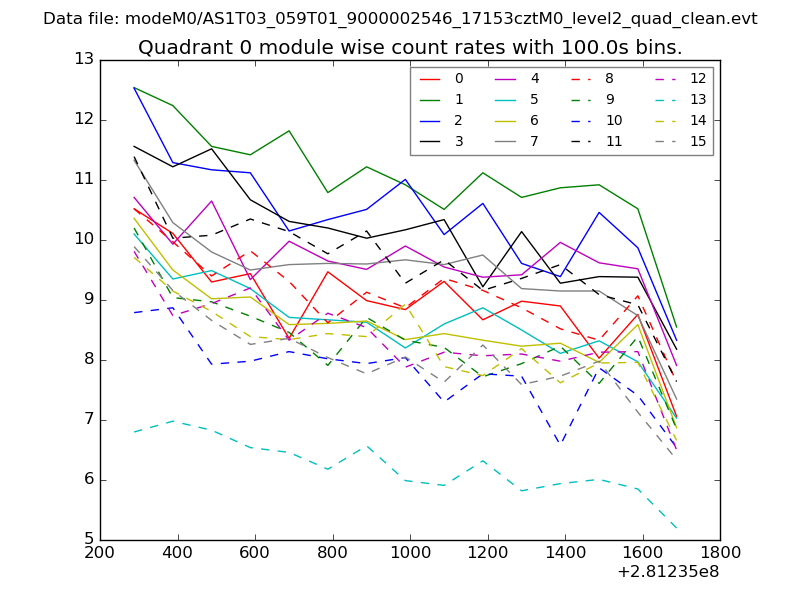 |
 |
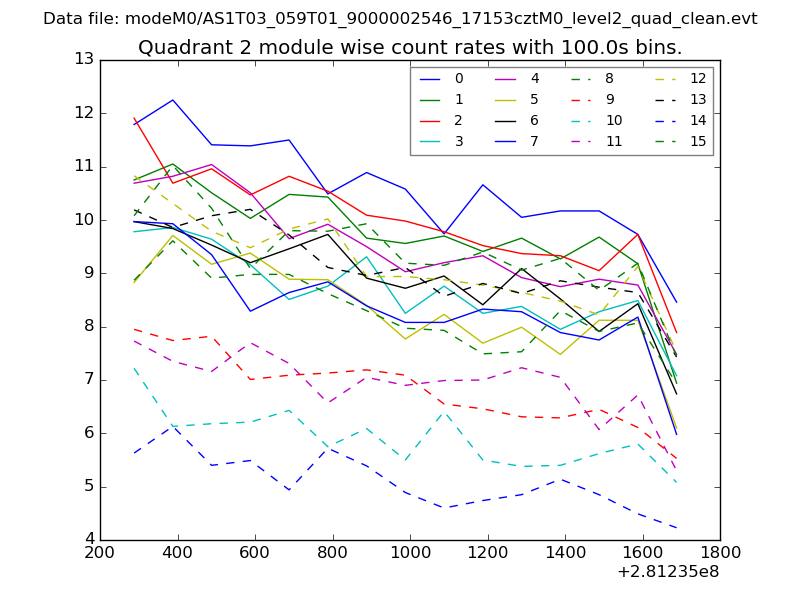
| Module-wise count rates for Quadrant B Data is divided into 100 sec bins |
 |
 |
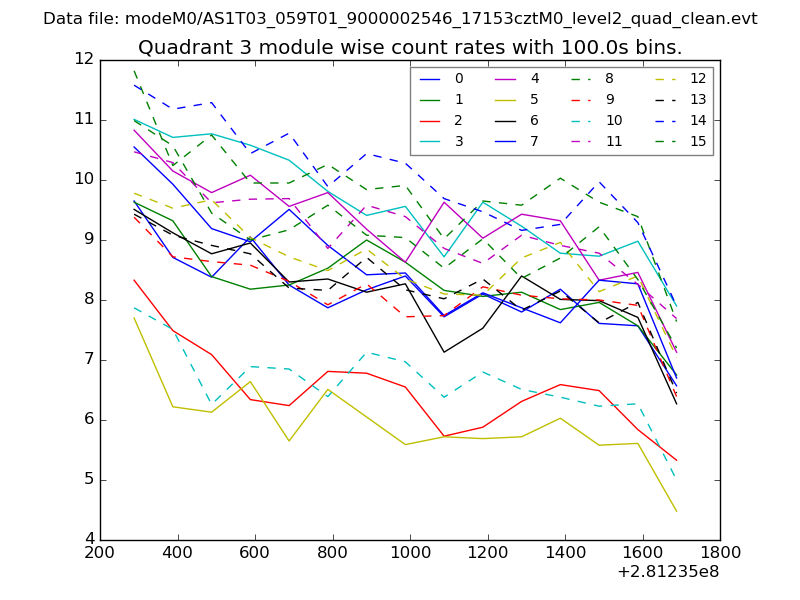
| Module-wise count rates for Quadrant C Data is divided into 100 sec bins |
 |
 |
| Module-wise count rates for Quadrant D Data is divided into 100 sec bins |
 |
 |
| Parameter | Plot |
|---|---|
| CZT HV Monitor | 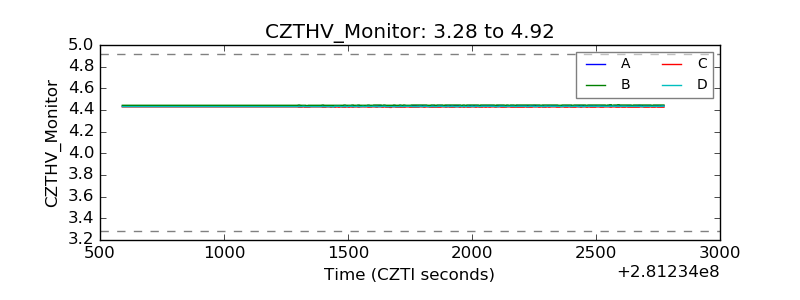 |
| D_VDD | 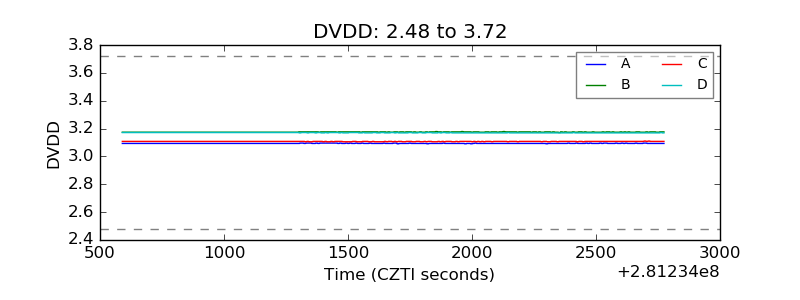 |
| Temperature 1 | 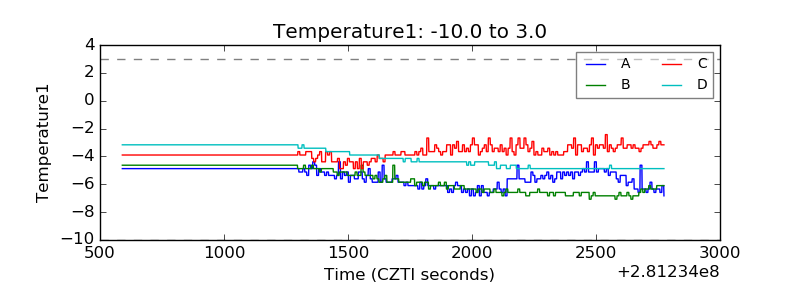 |
| Veto HV Monitor | 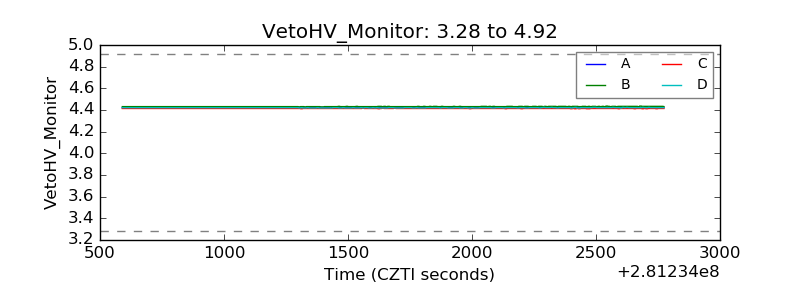 |
| Veto LLD | 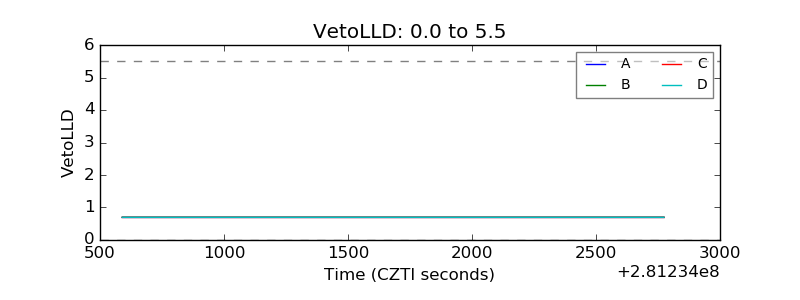 |
| Alpha Counter | 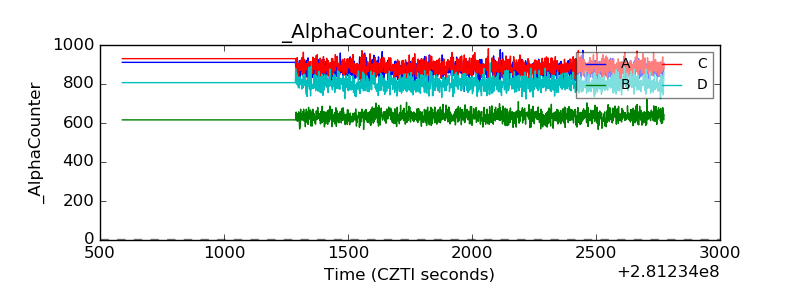 |
| _CPM_Rate | 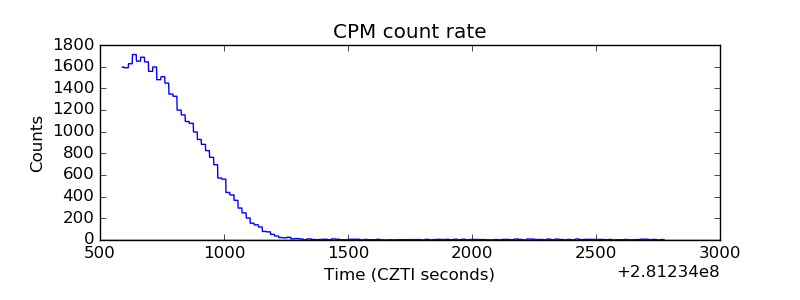 |
| CZT Counter |  |
| +2.5 Volts monitor | 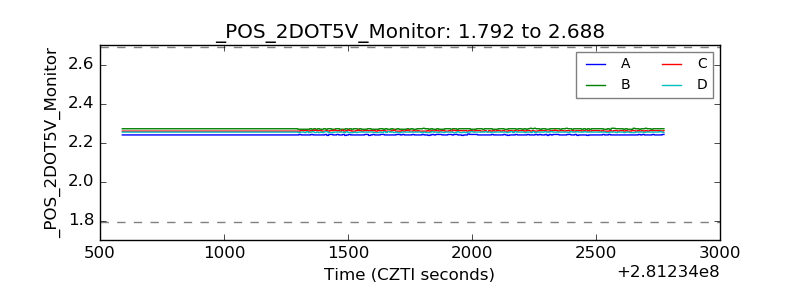 |
| +5 Volts monitor |  |
| _ROLL_ROT | 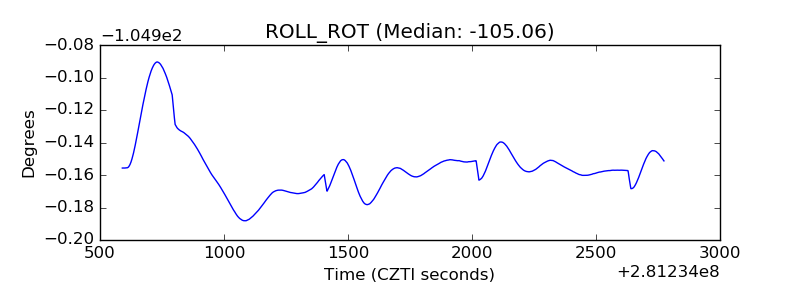 |
| _Roll_DEC |  |
| _Roll_RA | 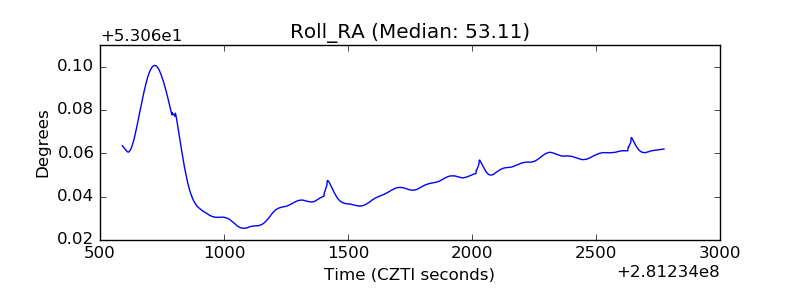 |
| Veto Counter | 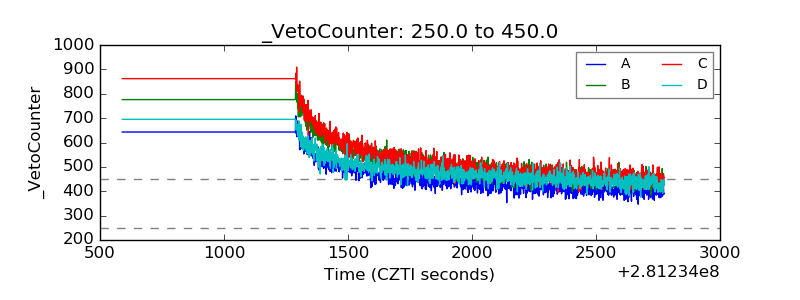 |