| Param | Original file | Final file |
|---|---|---|
| Filename | modeM0/AS1T03_059T01_9000002546_17154cztM0_level2.evt | modeM0/AS1T03_059T01_9000002546_17154cztM0_level2_quad_clean.evt |
| Size (bytes) | 500,690,880 | 88,945,920 |
| Size | 477.5 MB | 84.8 MB |
| Events in quadrant A | 3,487,798 | 571,725 |
| Events in quadrant B | 3,162,951 | 586,187 |
| Events in quadrant C | 4,954,983 | 542,813 |
| Events in quadrant D | 3,118,494 | 541,096 |
| Mode M0 | |||
|---|---|---|---|
| Quadrant | BADHDUFLAG | Total packets | Discarded packets |
| A | 0 | 14457 | 2 |
| B | 0 | 13398 | 2 |
| C | 0 | 19602 | 2 |
| D | 0 | 13611 | 2 |
| Mode M9 | |||
|---|---|---|---|
| Quadrant | BADHDUFLAG | Total packets | Discarded packets |
| A | 0 | 18 | 0 |
| B | 0 | 18 | 0 |
| C | 0 | 18 | 0 |
| D | 0 | 18 | 0 |
| Mode SS | |||
|---|---|---|---|
| Quadrant | BADHDUFLAG | Total packets | Discarded packets |
| A | 0 | 132 | 0 |
| B | 0 | 132 | 0 |
| C | 0 | 132 | 0 |
| D | 0 | 132 | 0 |
| Quadrant | Total seconds | Saturated seconds | Saturation percentage |
|---|---|---|---|
| A | 6475 | 74 | 1.142857% |
| B | 6475 | 42 | 0.648649% |
| C | 6474 | 168 | 2.594995% |
| D | 6474 | 40 | 0.617856% |
Noise dominated data is calculated using 1-second bins in cleaned event files. If a bin has >2000 counts, and if more than 50% of those come from <1% of pixels, then it is considered to be noise-dominated and hence unusable.
| Quadrant | # 1 sec bins | Bins with >0 counts | Bins with >2000 counts | High rate bins dominated by noise | Noise dominated (total time) | Noise dominated (detector-on time) | Marked lightcurve |
|---|---|---|---|---|---|---|---|
| A | 7585 | 6476 | 42 | 42 | 0.55% | 0.65% | 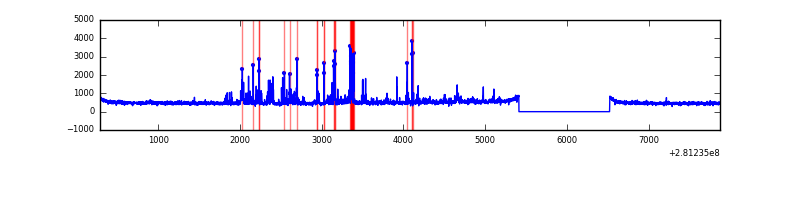 |
| B | 7585 | 6476 | 0 | 0 | 0.00% | 0.00% | 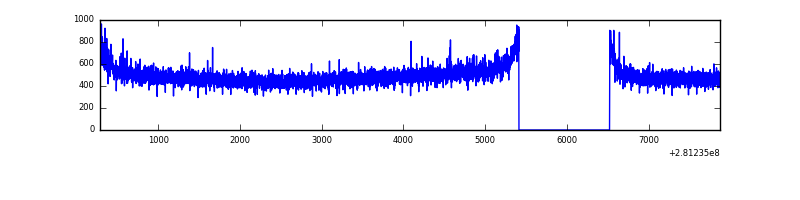 |
| C | 7584 | 6475 | 4 | 4 | 0.05% | 0.06% | 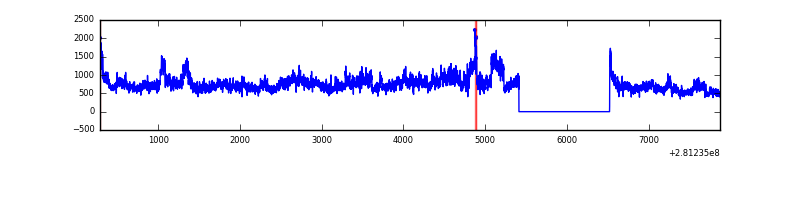 |
| D | 7584 | 6475 | 17 | 17 | 0.22% | 0.26% | 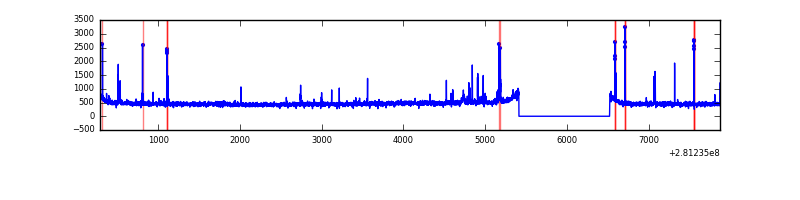 |
Top three noisy pixels from each quadrant. If the there are fewer than three noisy pixels in the level2.evt file, extra rows are filled as -1
| Pixel properties | Quadrant properties | ||||||
|---|---|---|---|---|---|---|---|
| Quadrant | DetID | PixID | Counts | Sigma | Mean | Median | Sigma |
| A | 12 | 96 | 352526 | 2197.29 | 797 | 780 | 160.1 |
| A | 12 | 189 | 71680 | 442.9 | 797 | 780 | 160.1 |
| A | 0 | 226 | 6862 | 37.99 | 797 | 780 | 160.1 |
| B | 12 | 111 | 18418 | 114.99 | 808 | 786 | 153.3 |
| B | 11 | 111 | 15586 | 96.52 | 808 | 786 | 153.3 |
| B | 14 | 111 | 13261 | 81.36 | 808 | 786 | 153.3 |
| C | 3 | 233 | 1809707 | 9979.95 | 775 | 780 | 181.3 |
| C | 14 | 238 | 119612 | 655.6 | 775 | 780 | 181.3 |
| C | 13 | 61 | 5402 | 25.5 | 775 | 780 | 181.3 |
| D | 1 | 52 | 59942 | 311.01 | 783 | 762 | 190.3 |
| D | 10 | 70 | 58649 | 304.21 | 783 | 762 | 190.3 |
| D | 2 | 234 | 22620 | 114.87 | 783 | 762 | 190.3 |
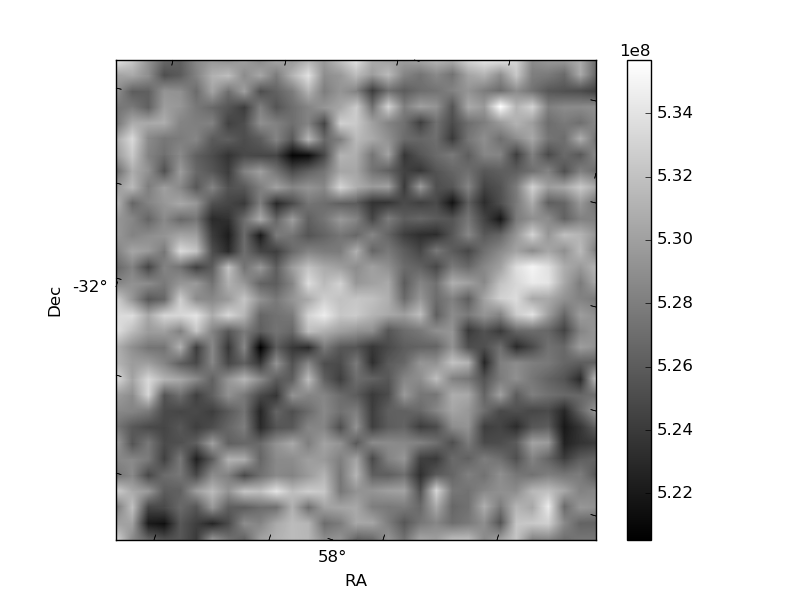
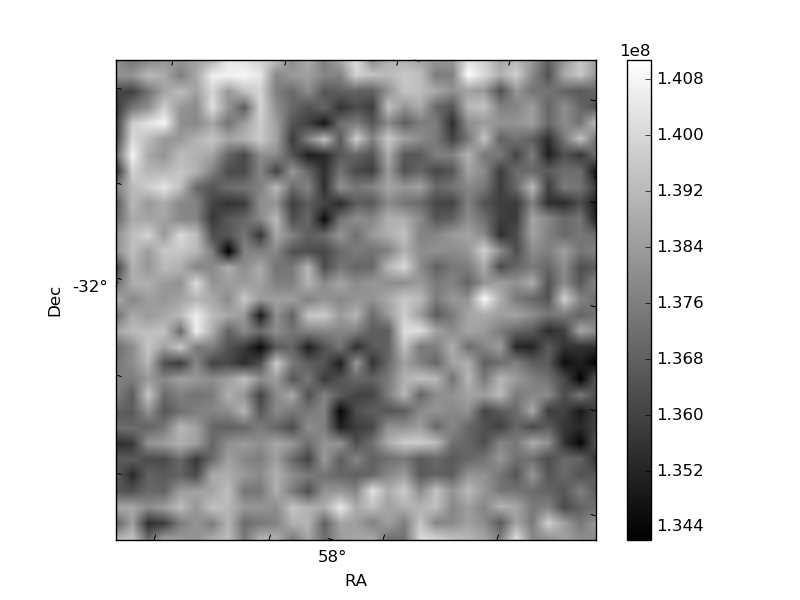
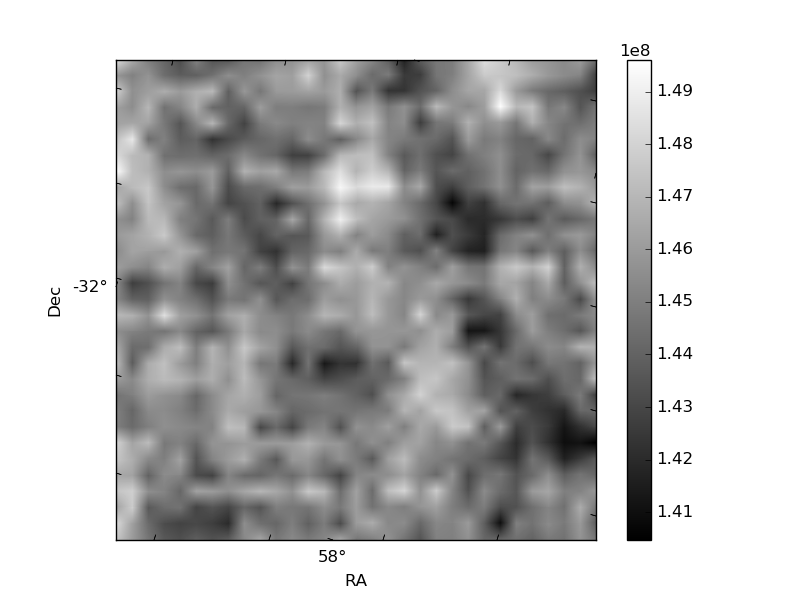
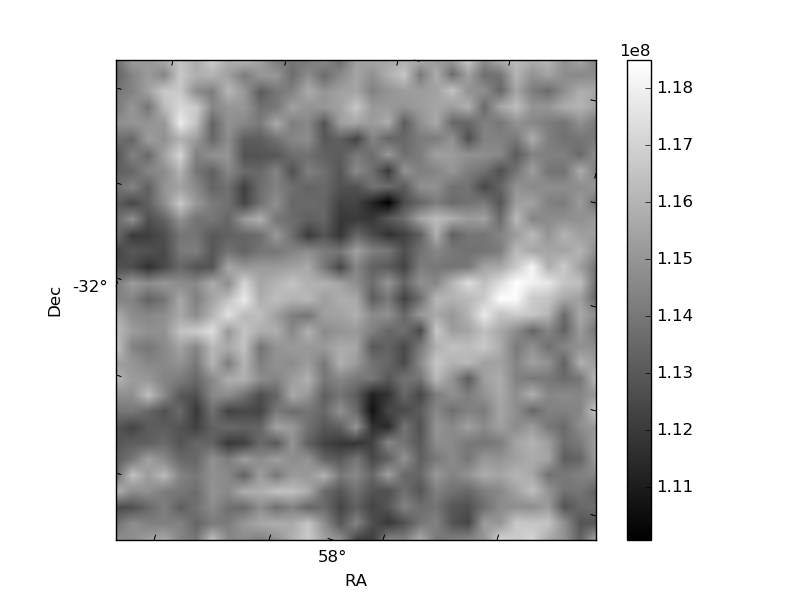
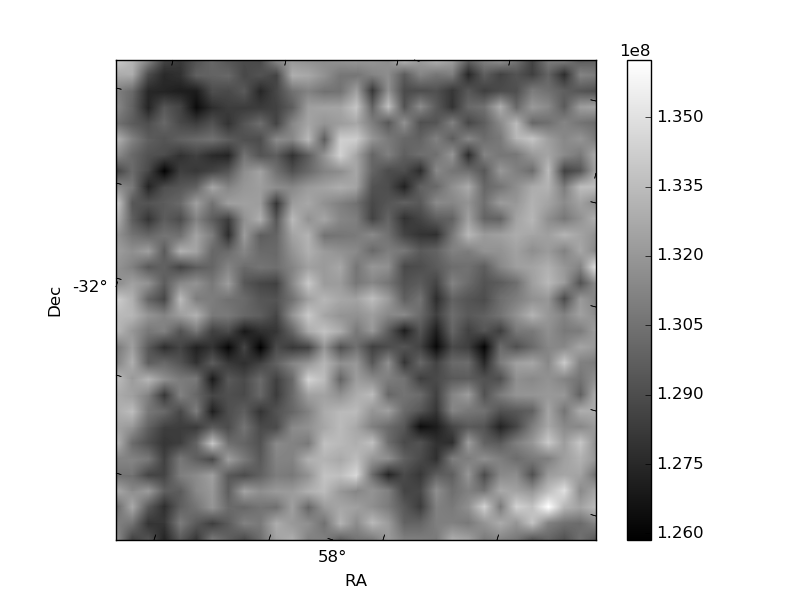
Histogram calculated using DETX and DETY for each event in the final _common_clean file
| Quadrant A | 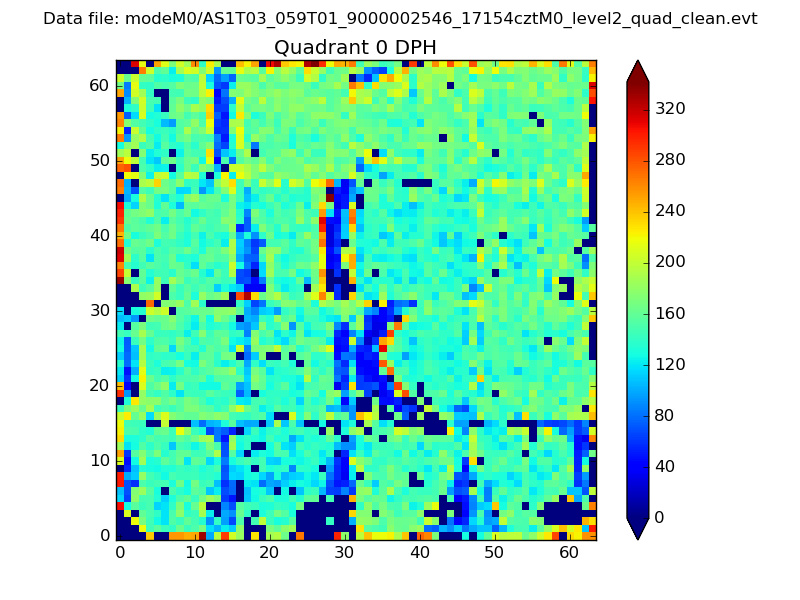 |
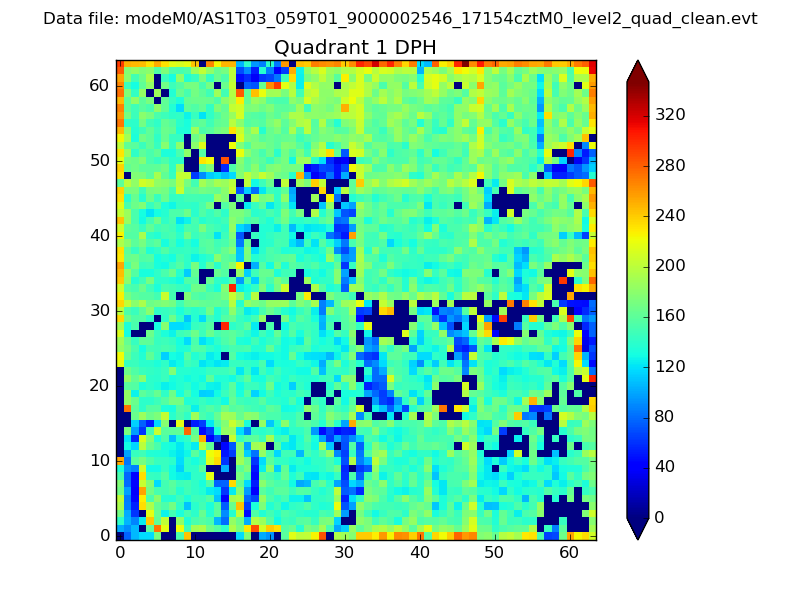 |
Quadrant B |
|---|---|---|---|
| Quadrant D | 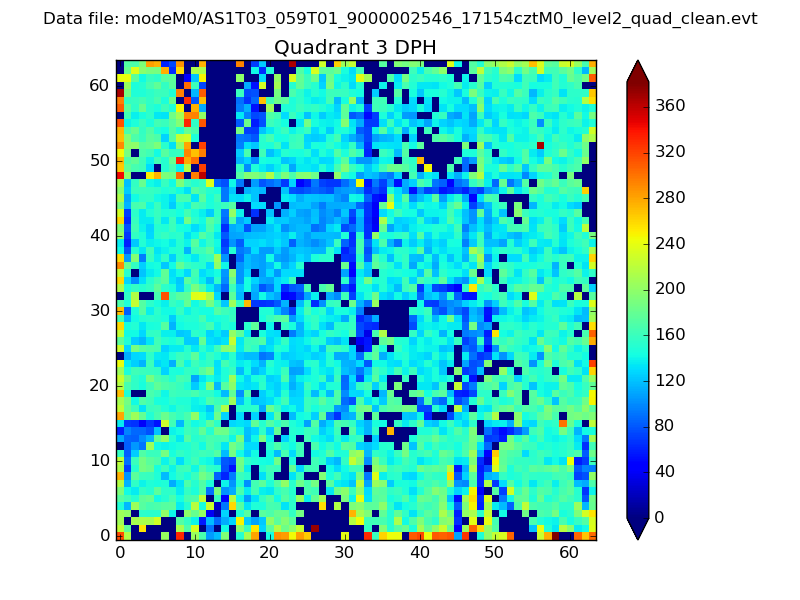 |
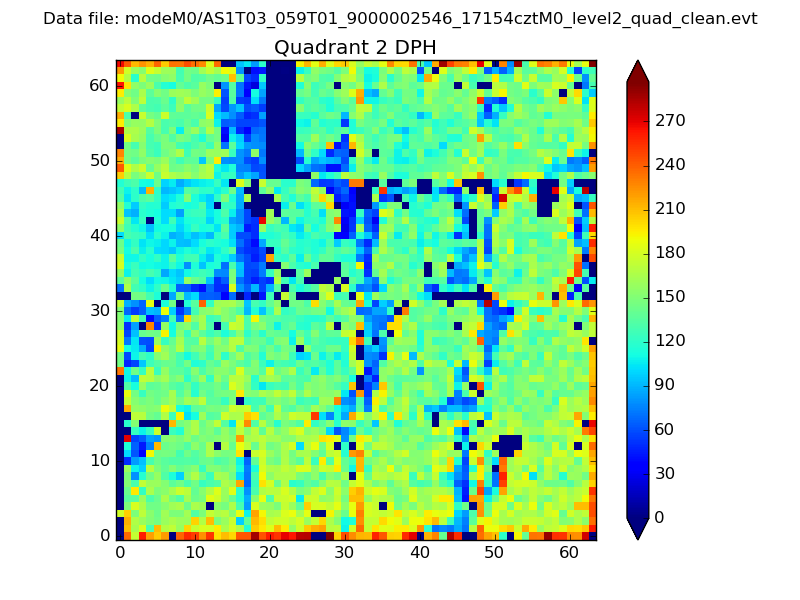 |
Quadrant C |
| Plot type | Count rate plots | Images |
|---|---|---|
| Comparison with Poisson distribution Blue bars denote a histogram of data divided into 1 sec bins. Red curve is a Poisson curve with rate = median count rate of data. |
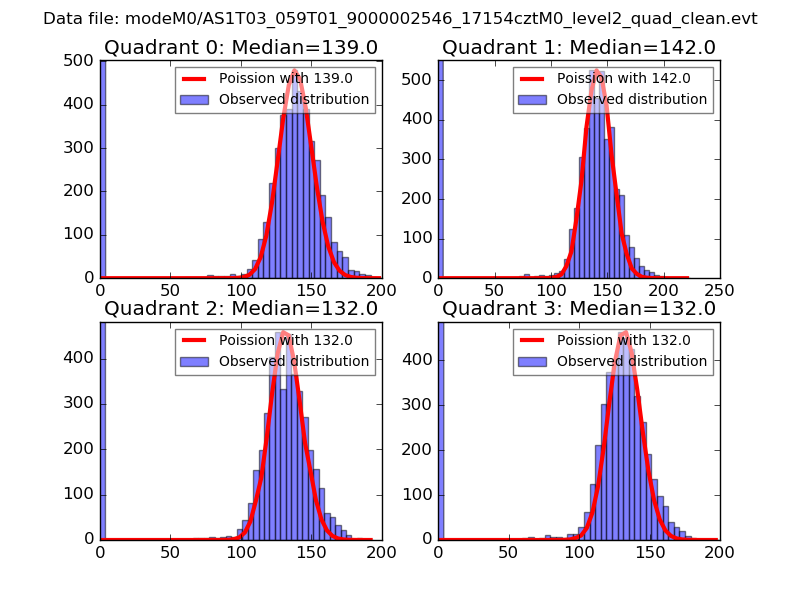 |
 |
| Quadrant-wise count rates Data is divided into 100 sec bins |
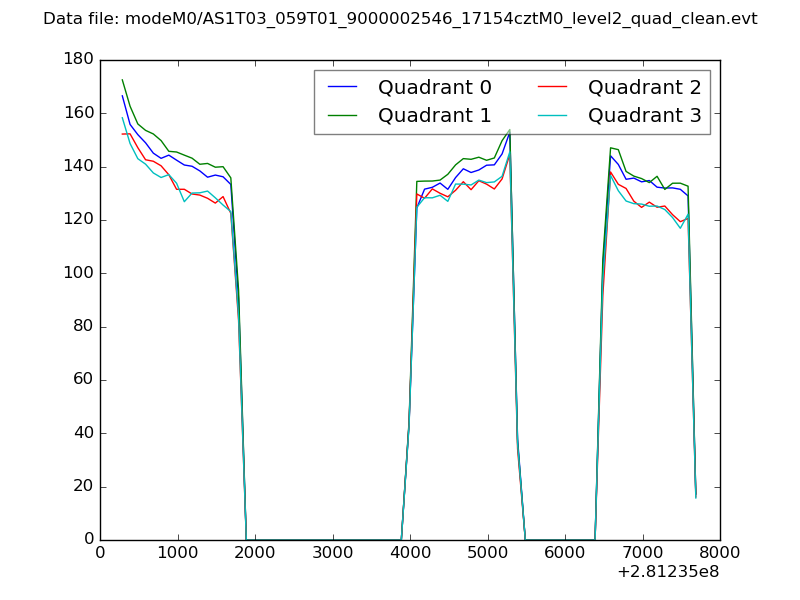 |
|
| Module-wise count rates for Quadrant A Data is divided into 100 sec bins |
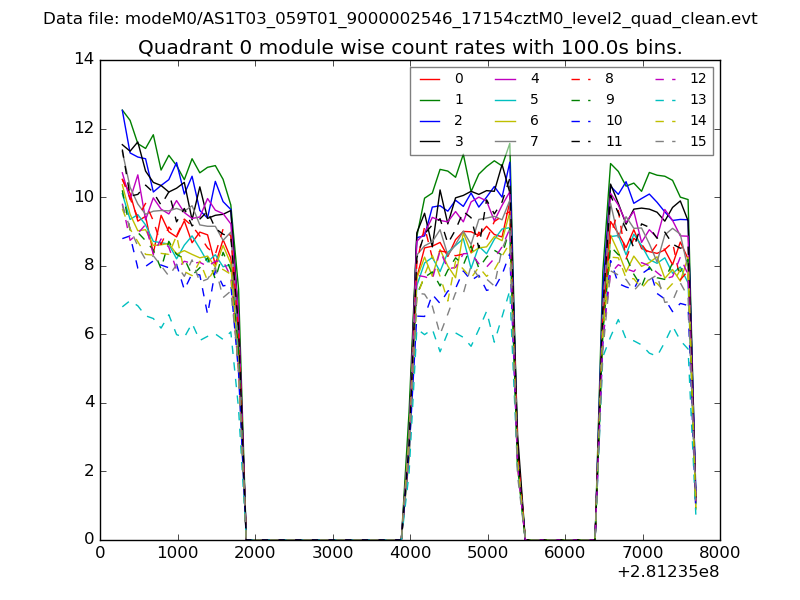 |
 |
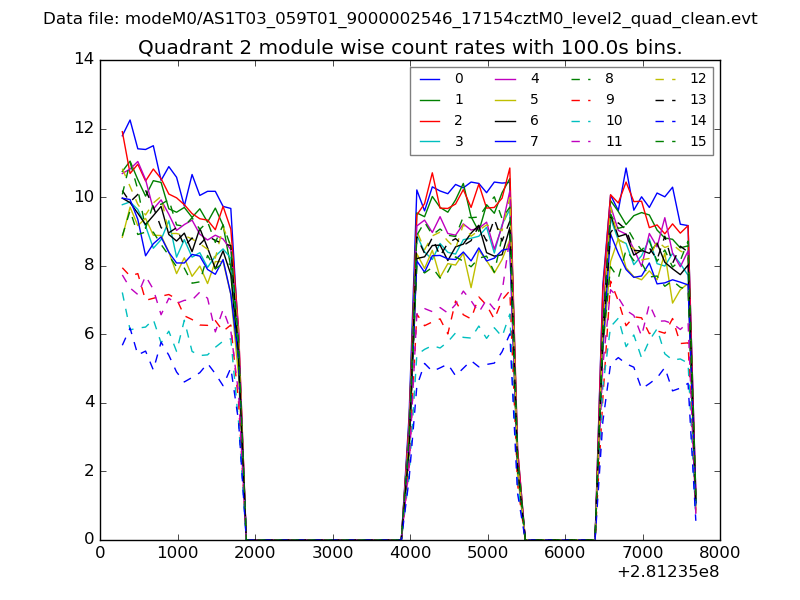
| Module-wise count rates for Quadrant B Data is divided into 100 sec bins |
 |
 |
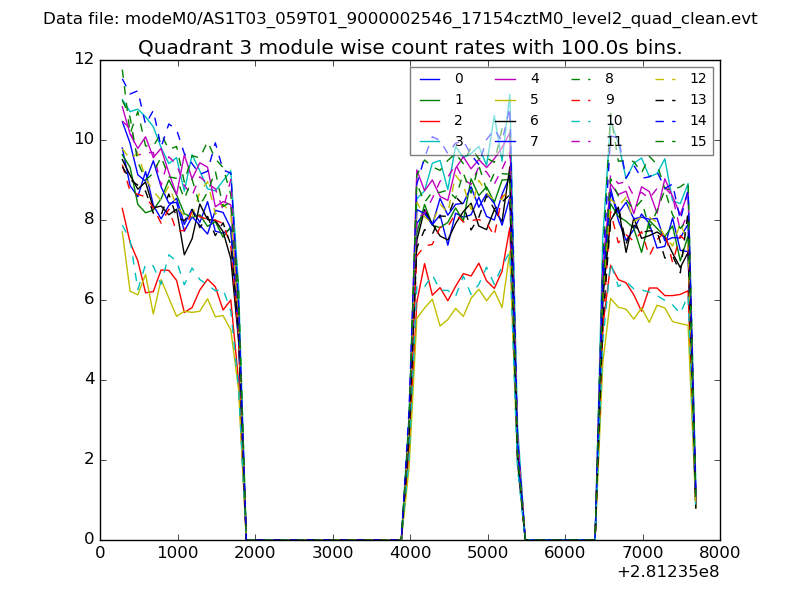
| Module-wise count rates for Quadrant C Data is divided into 100 sec bins |
 |
 |
| Module-wise count rates for Quadrant D Data is divided into 100 sec bins |
 |
 |
| Parameter | Plot |
|---|---|
| CZT HV Monitor | 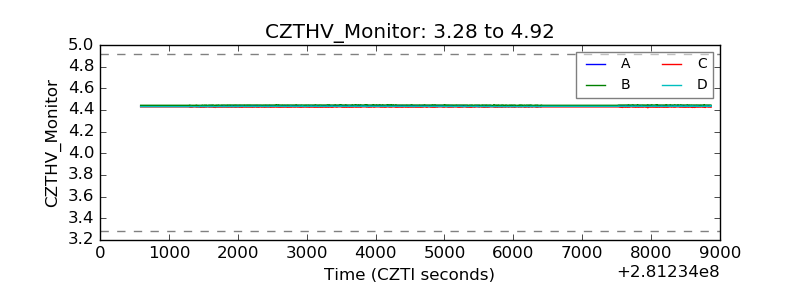 |
| D_VDD | 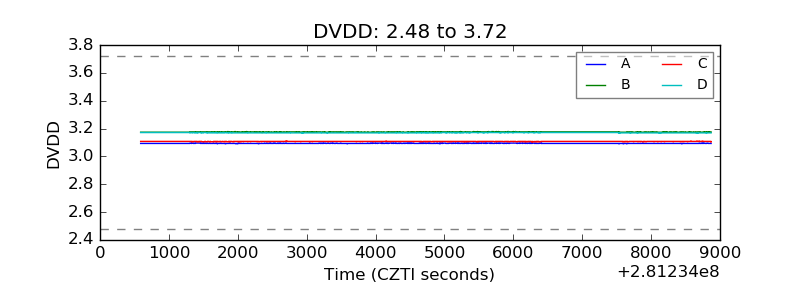 |
| Temperature 1 | 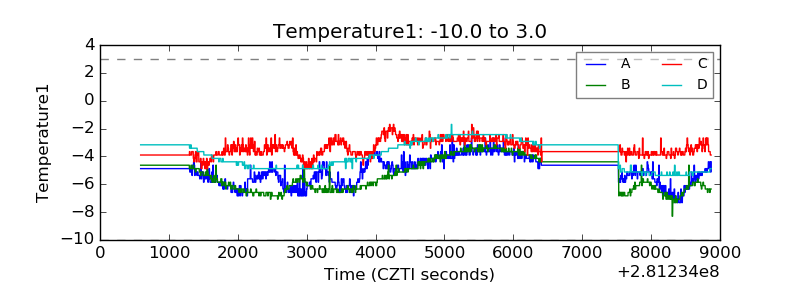 |
| Veto HV Monitor |  |
| Veto LLD | 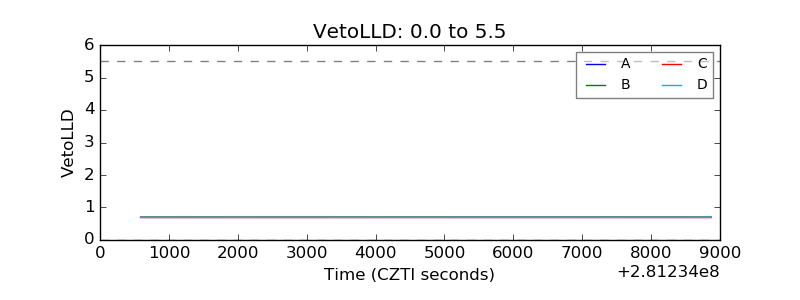 |
| Alpha Counter |  |
| _CPM_Rate | 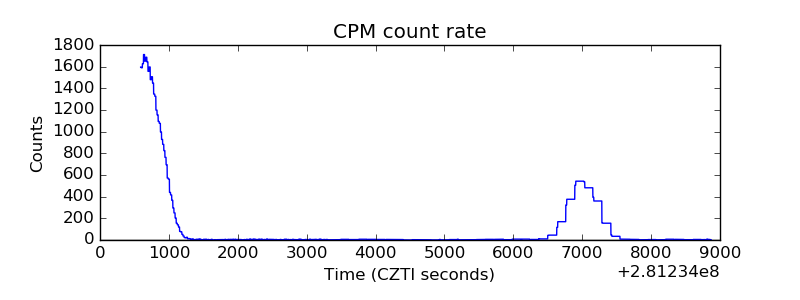 |
| CZT Counter | 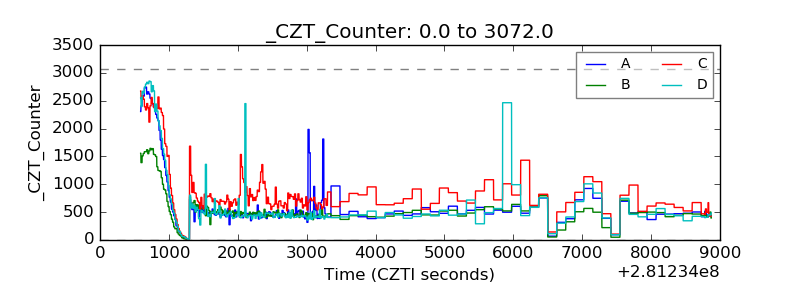 |
| +2.5 Volts monitor |  |
| +5 Volts monitor |  |
| _ROLL_ROT | 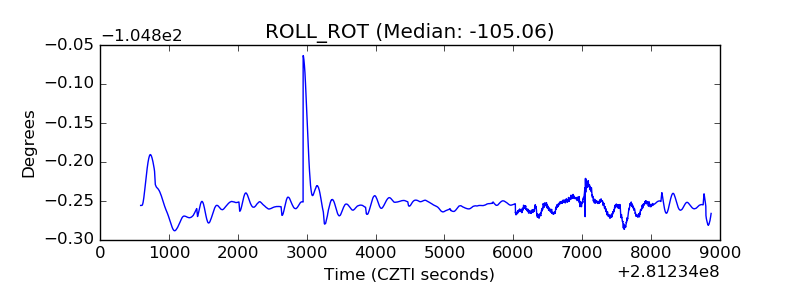 |
| _Roll_DEC | 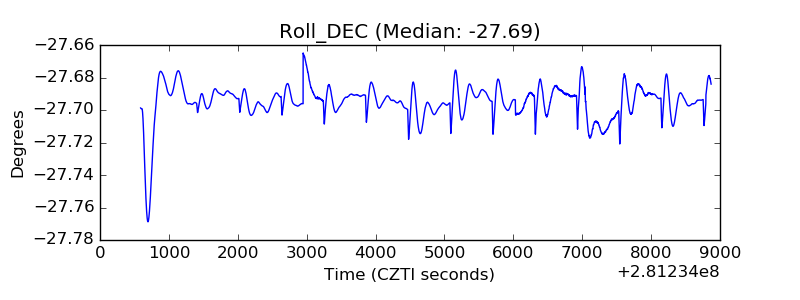 |
| _Roll_RA | 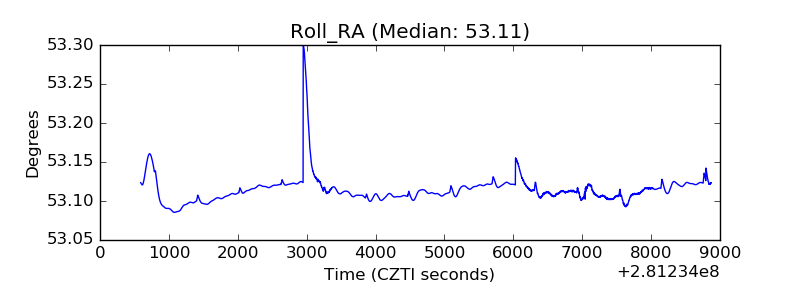 |
| Veto Counter | 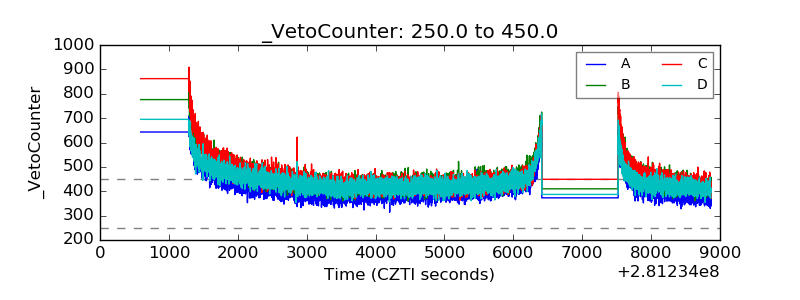 |