| Param | Original file | Final file |
|---|---|---|
| Filename | modeM0/AS1T03_059T01_9000002546_17155cztM0_level2.evt | modeM0/AS1T03_059T01_9000002546_17155cztM0_level2_quad_clean.evt |
| Size (bytes) | 562,345,920 | 96,762,240 |
| Size | 536.3 MB | 92.3 MB |
| Events in quadrant A | 3,606,768 | 631,183 |
| Events in quadrant B | 3,598,891 | 644,930 |
| Events in quadrant C | 4,979,329 | 577,579 |
| Events in quadrant D | 4,340,940 | 558,695 |
| Mode M0 | |||
|---|---|---|---|
| Quadrant | BADHDUFLAG | Total packets | Discarded packets |
| A | 0 | 15460 | 2 |
| B | 0 | 15399 | 2 |
| C | 0 | 19668 | 2 |
| D | 0 | 18037 | 2 |
| Mode M9 | |||
|---|---|---|---|
| Quadrant | BADHDUFLAG | Total packets | Discarded packets |
| A | 0 | 19 | 0 |
| B | 0 | 19 | 0 |
| C | 0 | 19 | 0 |
| D | 0 | 19 | 0 |
| Mode SS | |||
|---|---|---|---|
| Quadrant | BADHDUFLAG | Total packets | Discarded packets |
| A | 0 | 152 | 0 |
| B | 0 | 152 | 0 |
| C | 0 | 152 | 0 |
| D | 0 | 152 | 0 |
| Quadrant | Total seconds | Saturated seconds | Saturation percentage |
|---|---|---|---|
| A | 7437 | 62 | 0.833669% |
| B | 7438 | 99 | 1.331003% |
| C | 7438 | 513 | 6.897015% |
| D | 7438 | 602 | 8.093574% |
Noise dominated data is calculated using 1-second bins in cleaned event files. If a bin has >2000 counts, and if more than 50% of those come from <1% of pixels, then it is considered to be noise-dominated and hence unusable.
| Quadrant | # 1 sec bins | Bins with >0 counts | Bins with >2000 counts | High rate bins dominated by noise | Noise dominated (total time) | Noise dominated (detector-on time) | Marked lightcurve |
|---|---|---|---|---|---|---|---|
| A | 9287 | 7439 | 1 | 1 | 0.01% | 0.01% | 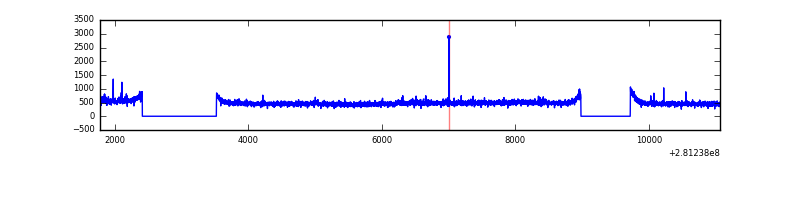 |
| B | 9288 | 7439 | 0 | 0 | 0.00% | 0.00% | 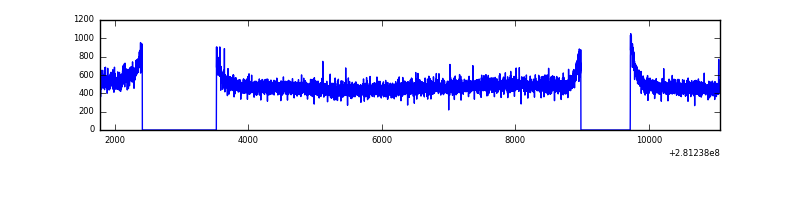 |
| C | 9288 | 7440 | 185 | 185 | 1.99% | 2.49% | 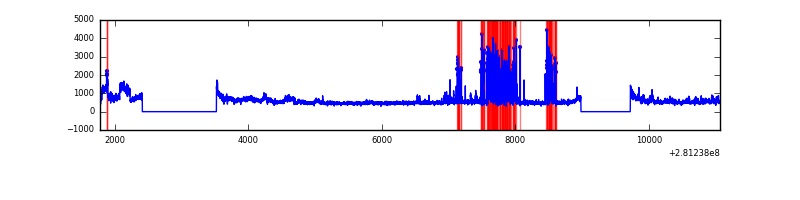 |
| D | 9288 | 7440 | 135 | 135 | 1.45% | 1.81% | 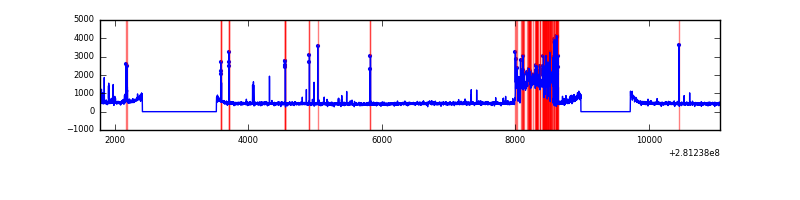 |
Top three noisy pixels from each quadrant. If the there are fewer than three noisy pixels in the level2.evt file, extra rows are filled as -1
| Pixel properties | Quadrant properties | ||||||
|---|---|---|---|---|---|---|---|
| Quadrant | DetID | PixID | Counts | Sigma | Mean | Median | Sigma |
| A | 12 | 189 | 74702 | 398.3 | 917 | 898 | 185.3 |
| A | 0 | 226 | 7959 | 38.11 | 917 | 898 | 185.3 |
| A | 3 | 137 | 6860 | 32.18 | 917 | 898 | 185.3 |
| B | 12 | 111 | 21885 | 118.1 | 921 | 899 | 177.7 |
| B | 11 | 111 | 18654 | 99.92 | 921 | 899 | 177.7 |
| B | 14 | 111 | 15948 | 84.69 | 921 | 899 | 177.7 |
| C | 4 | 254 | 778536 | 3826.3 | 865 | 869 | 203.2 |
| C | 3 | 233 | 695251 | 3416.52 | 865 | 869 | 203.2 |
| C | 14 | 238 | 131199 | 641.25 | 865 | 869 | 203.2 |
| D | 1 | 52 | 988601 | 4770.14 | 857 | 834 | 207.1 |
| D | 13 | 232 | 38041 | 179.68 | 857 | 834 | 207.1 |
| D | 10 | 70 | 32900 | 154.85 | 857 | 834 | 207.1 |
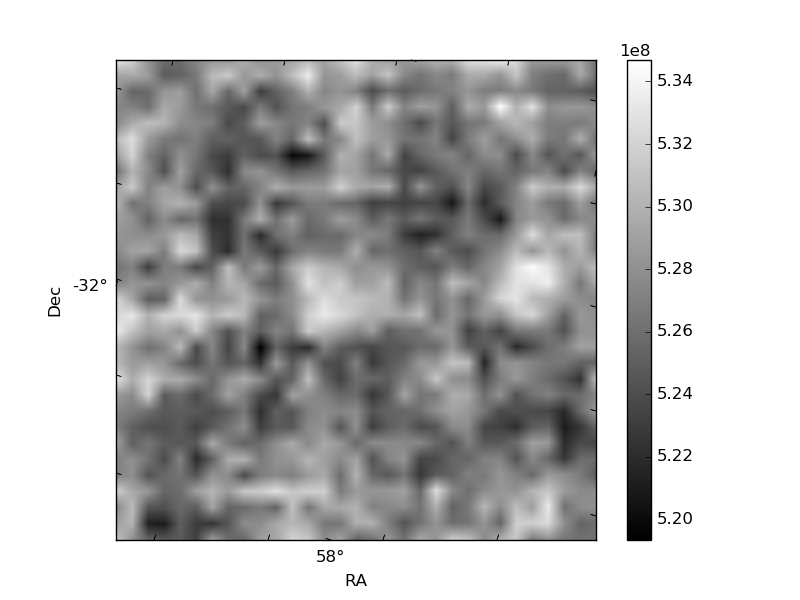
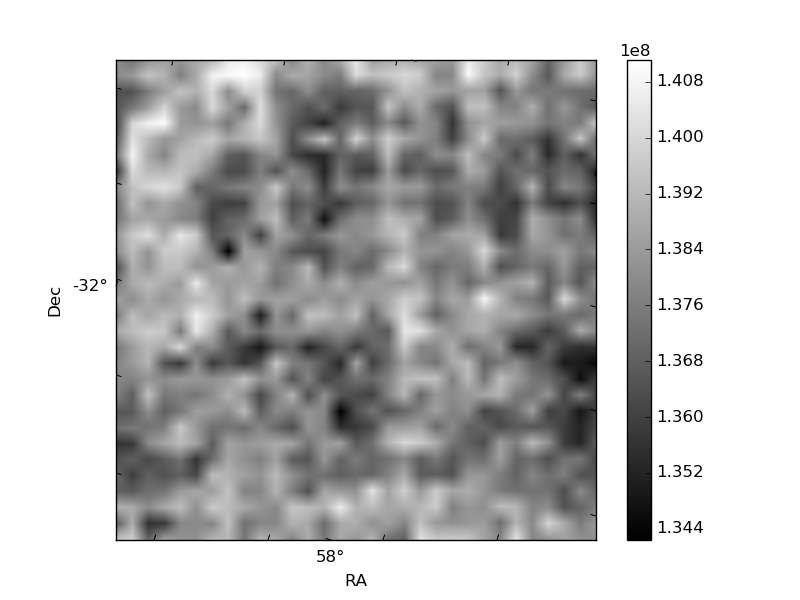
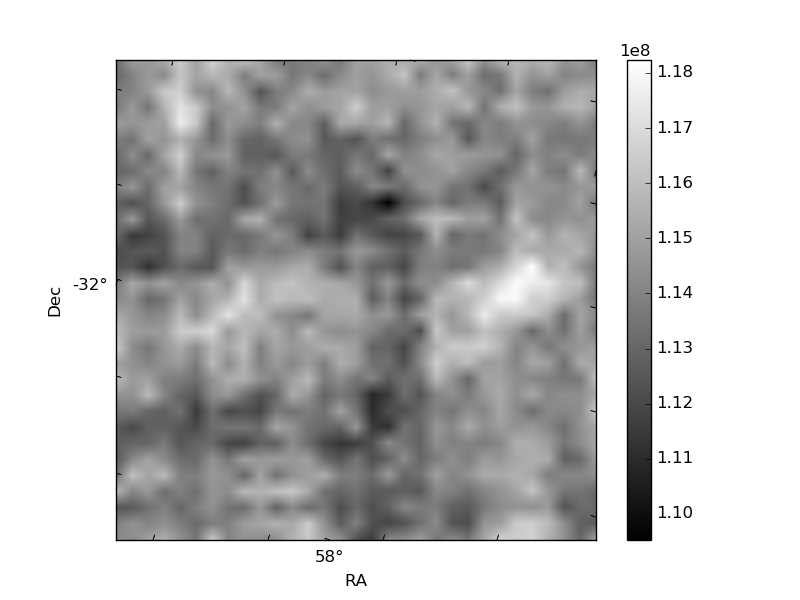
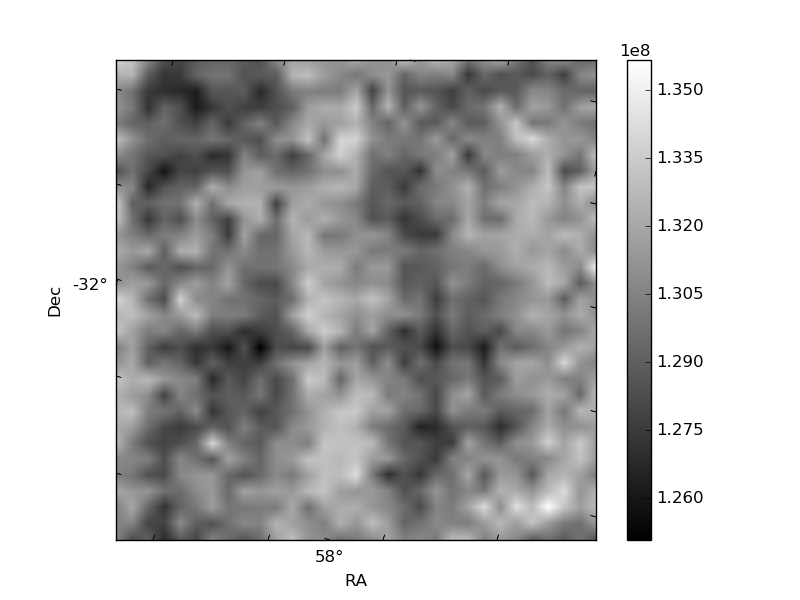
Histogram calculated using DETX and DETY for each event in the final _common_clean file
| Quadrant A | 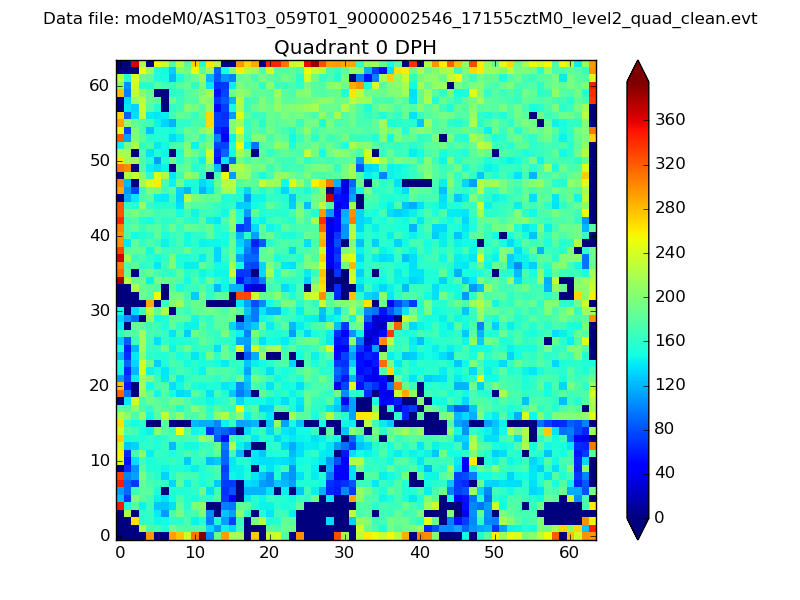 |
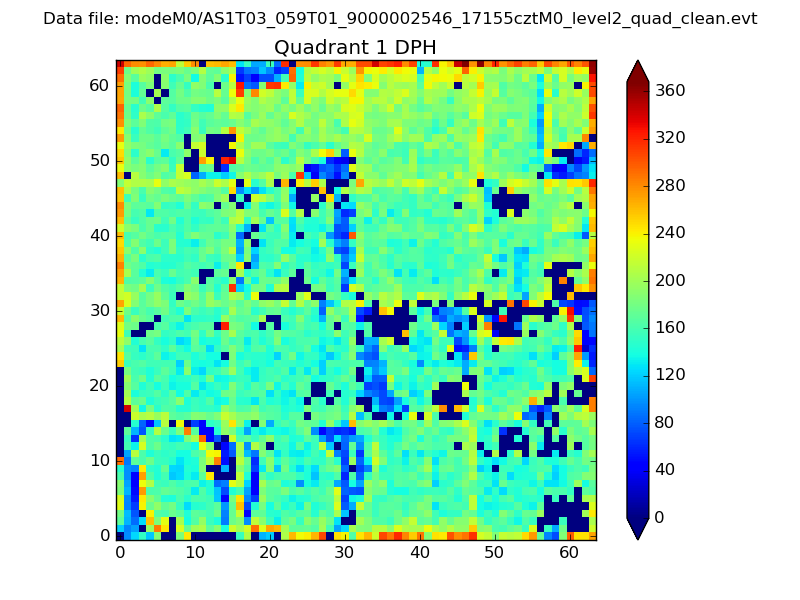 |
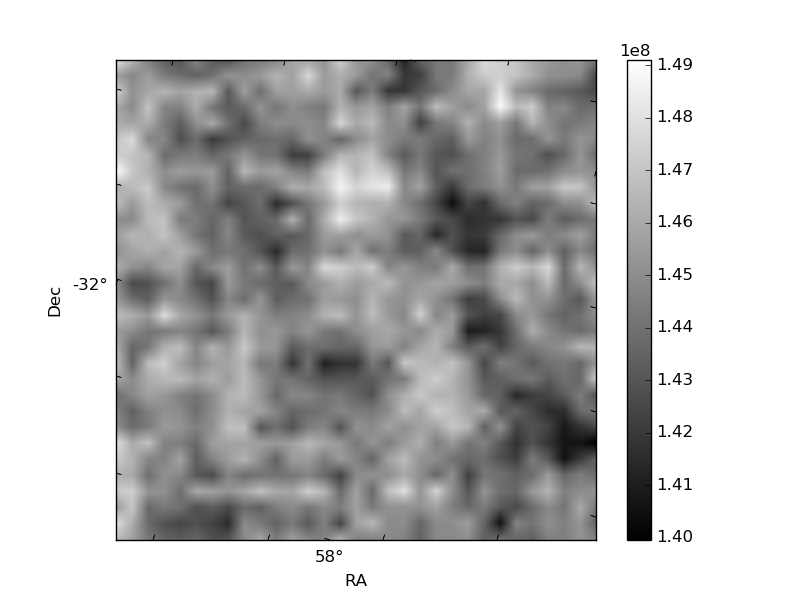
Quadrant B |
|---|---|---|---|
| Quadrant D | 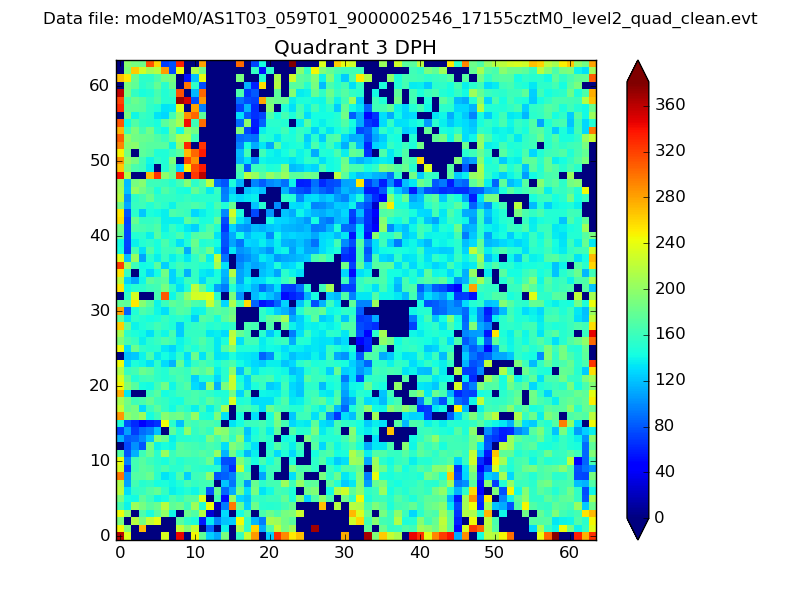 |
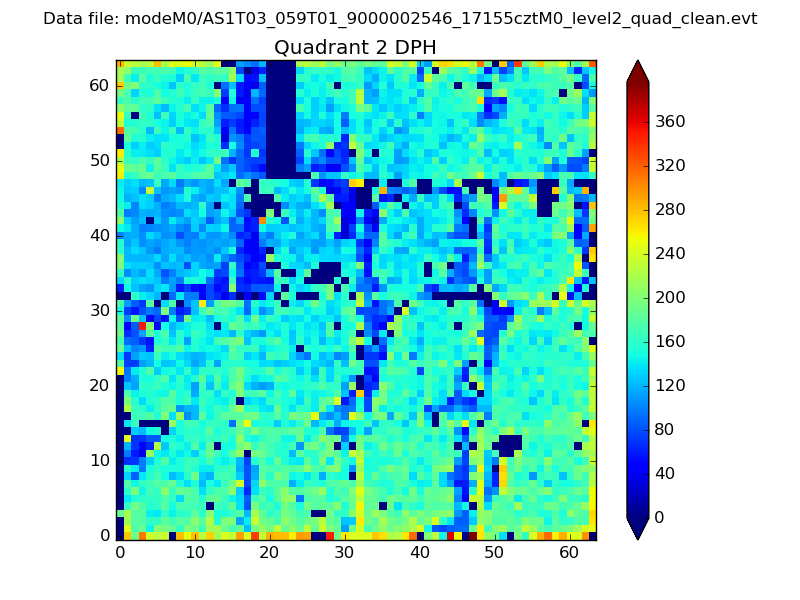 |
Quadrant C |
| Plot type | Count rate plots | Images |
|---|---|---|
| Comparison with Poisson distribution Blue bars denote a histogram of data divided into 1 sec bins. Red curve is a Poisson curve with rate = median count rate of data. |
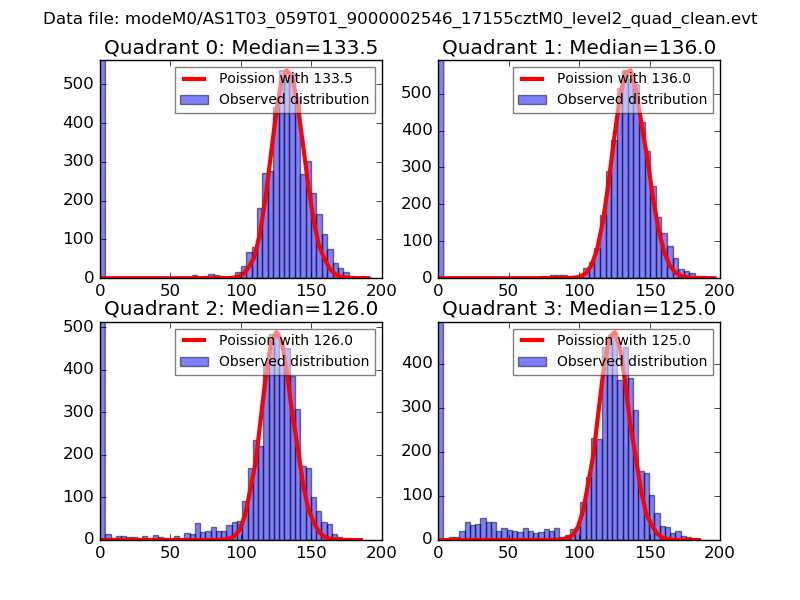 |
 |
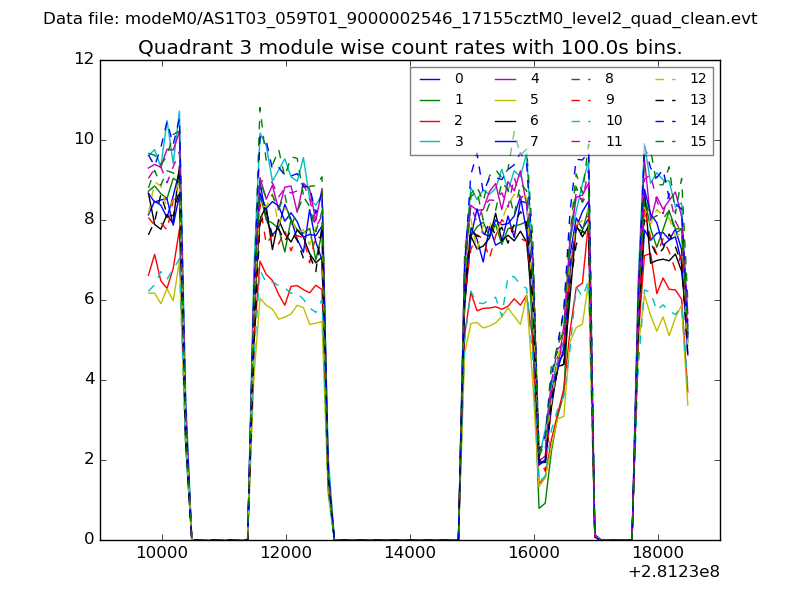
| Quadrant-wise count rates Data is divided into 100 sec bins |
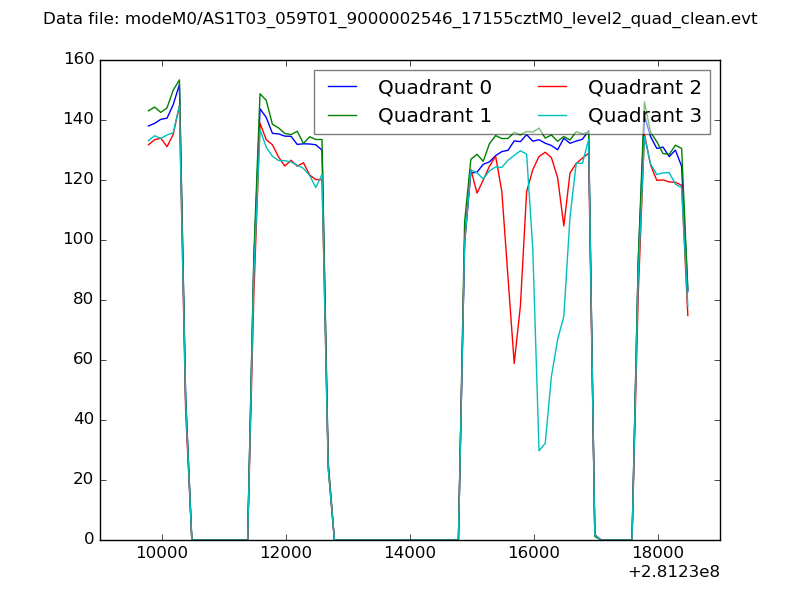 |
|
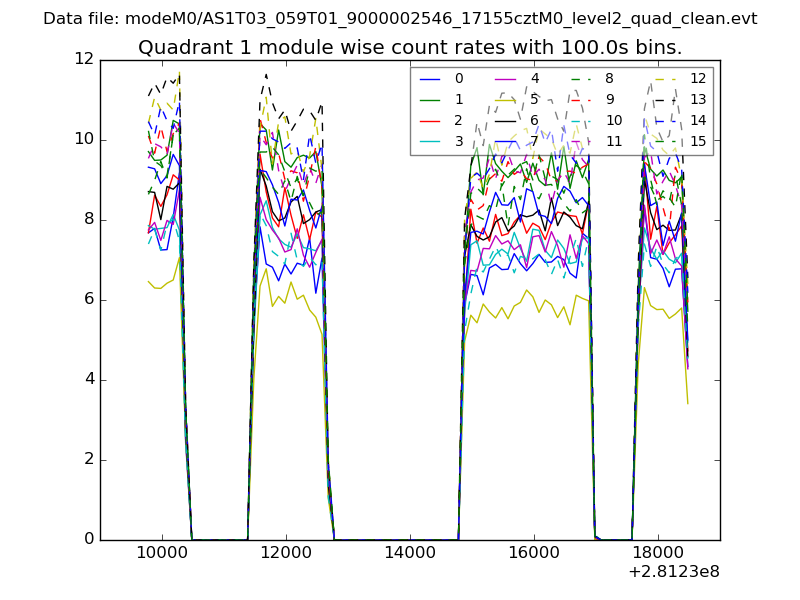
| Module-wise count rates for Quadrant A Data is divided into 100 sec bins |
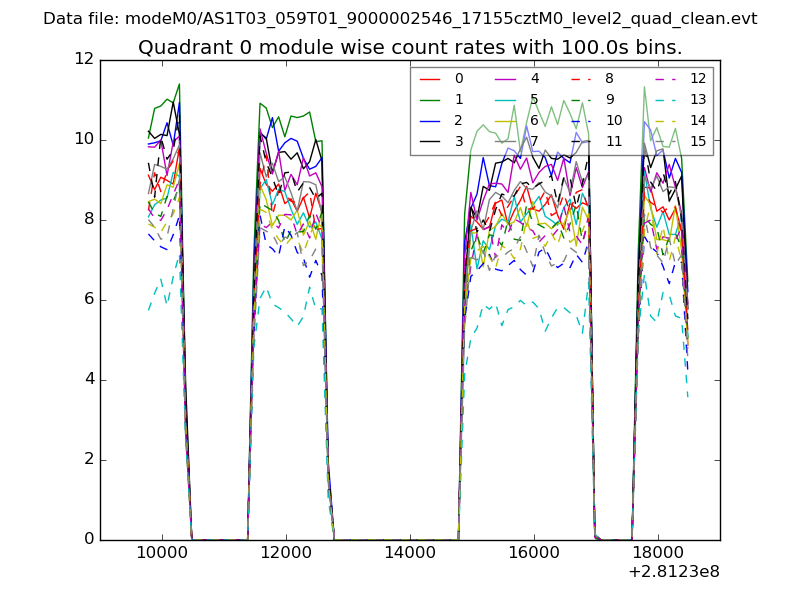 |
 |
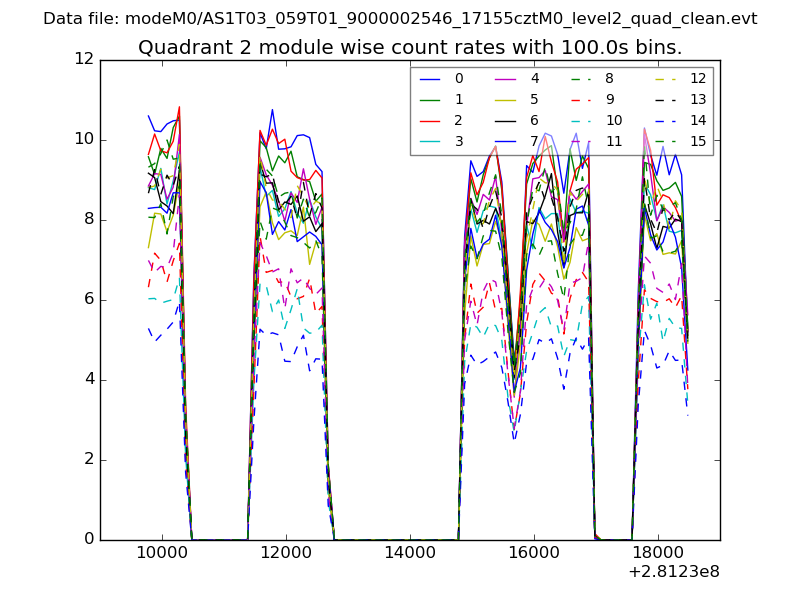
| Module-wise count rates for Quadrant B Data is divided into 100 sec bins |
 |
 |
| Module-wise count rates for Quadrant C Data is divided into 100 sec bins |
 |
 |
| Module-wise count rates for Quadrant D Data is divided into 100 sec bins |
 |
 |
| Parameter | Plot |
|---|---|
| CZT HV Monitor | 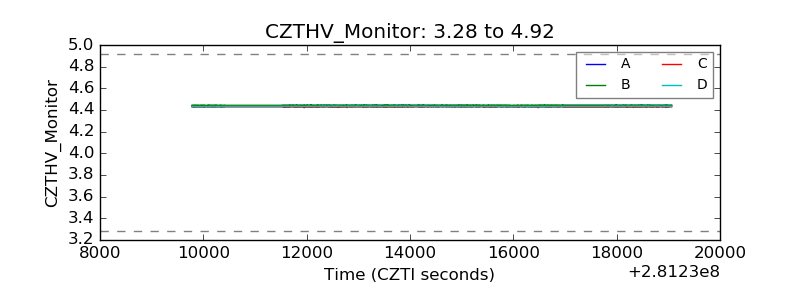 |
| D_VDD | 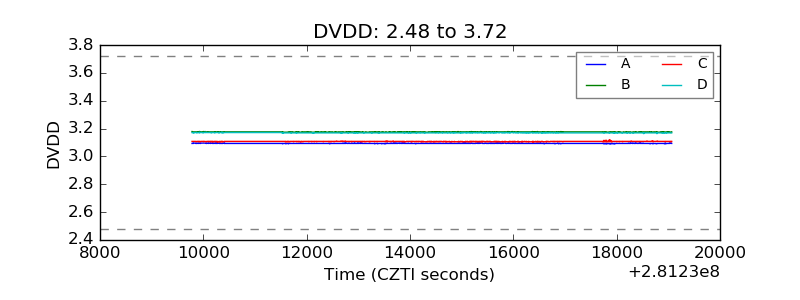 |
| Temperature 1 | 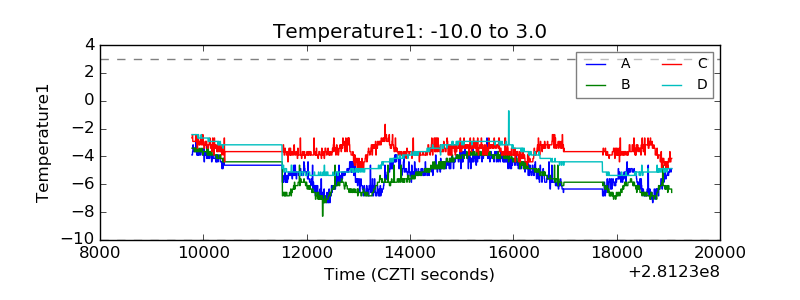 |
| Veto HV Monitor | 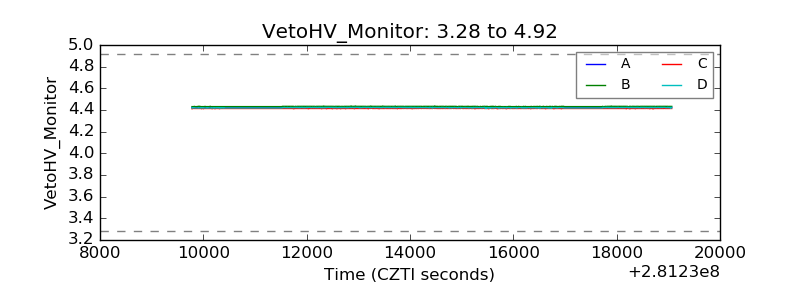 |
| Veto LLD | 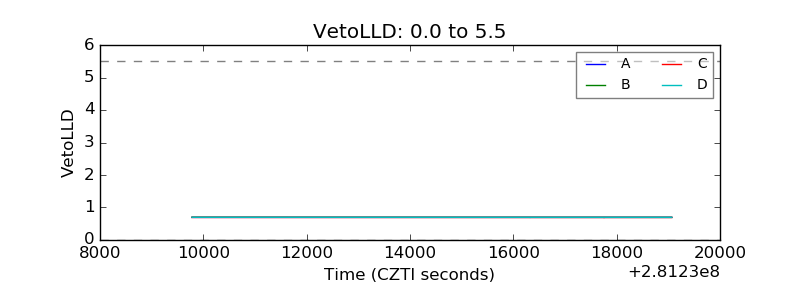 |
| Alpha Counter | 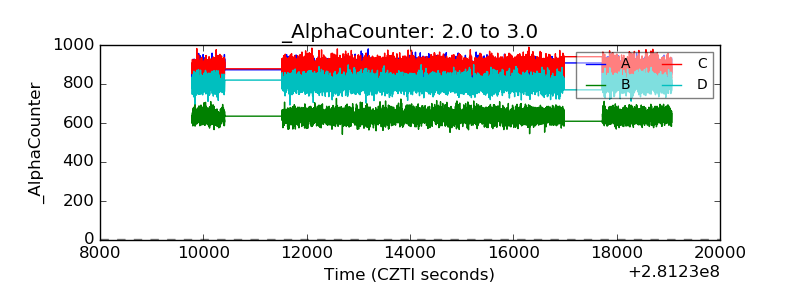 |
| _CPM_Rate | 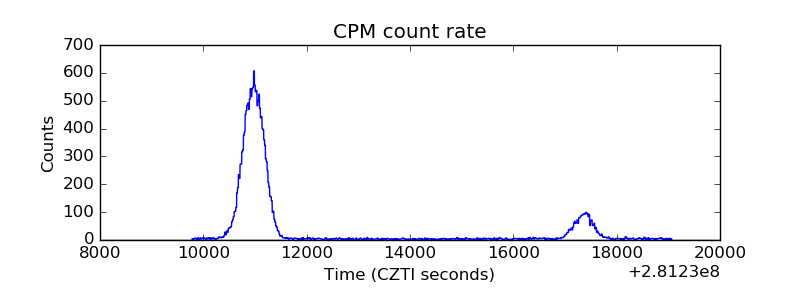 |
| CZT Counter | 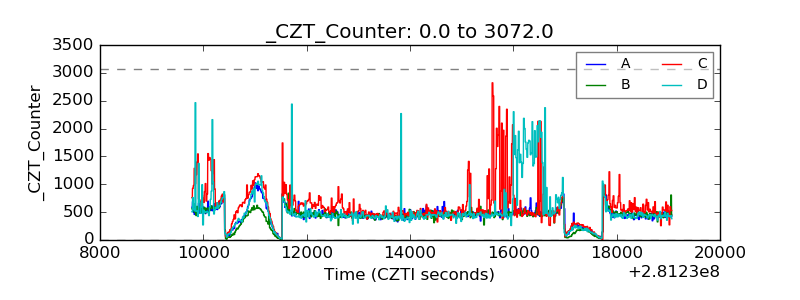 |
| +2.5 Volts monitor | 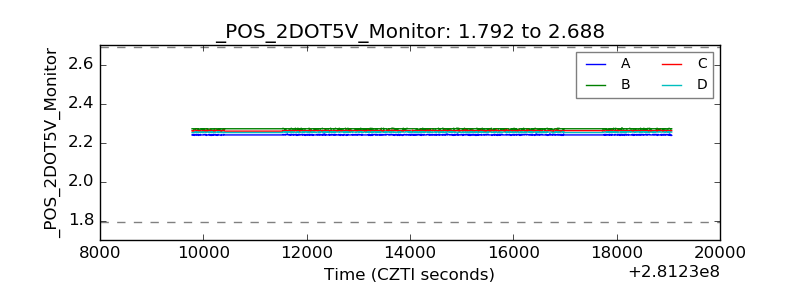 |
| +5 Volts monitor | 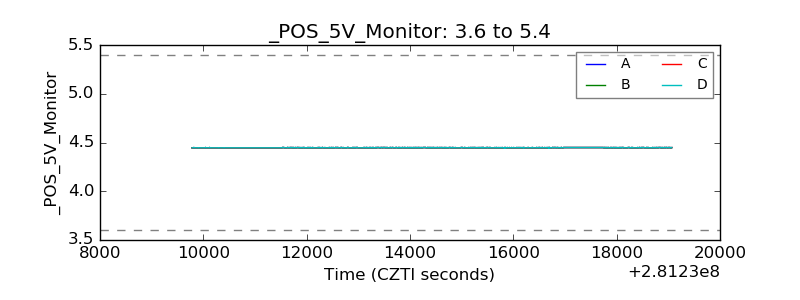 |
| _ROLL_ROT | 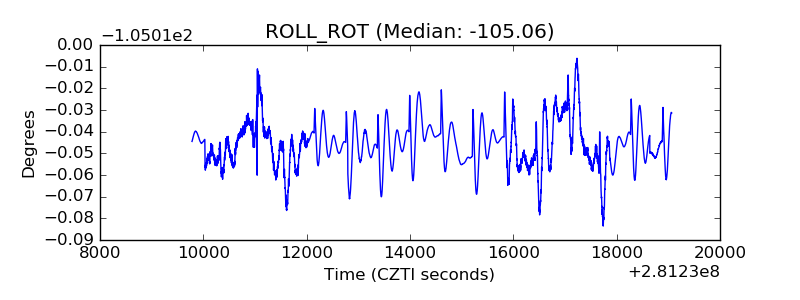 |
| _Roll_DEC | 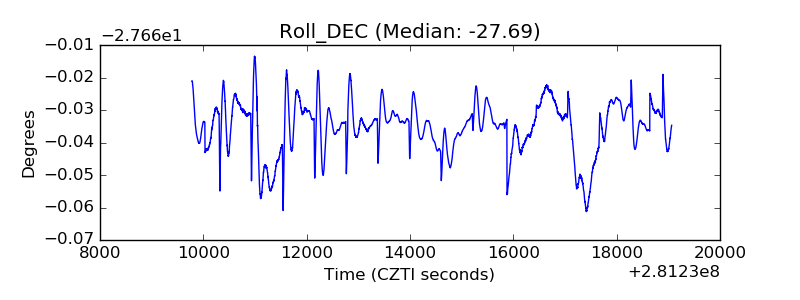 |
| _Roll_RA | 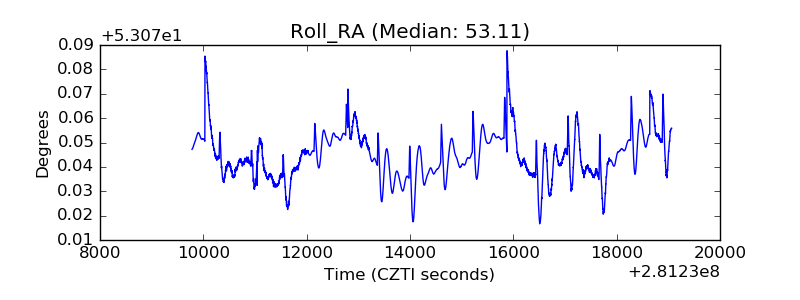 |
| Veto Counter | 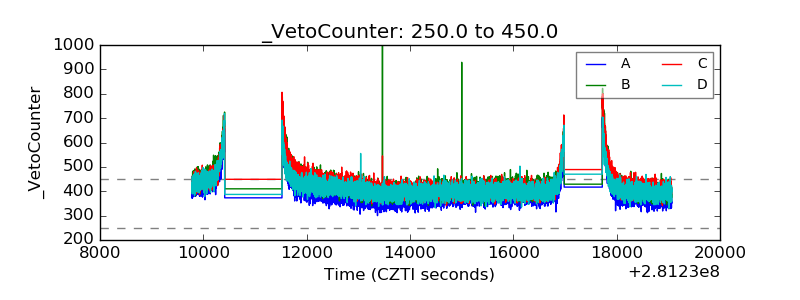 |