| Param | Original file | Final file |
|---|---|---|
| Filename | modeM0/AS1T03_059T01_9000002546_17156cztM0_level2.evt | modeM0/AS1T03_059T01_9000002546_17156cztM0_level2_quad_clean.evt |
| Size (bytes) | 507,124,800 | 85,616,640 |
| Size | 483.6 MB | 81.7 MB |
| Events in quadrant A | 3,446,506 | 529,956 |
| Events in quadrant B | 3,473,863 | 539,047 |
| Events in quadrant C | 4,558,078 | 503,155 |
| Events in quadrant D | 3,381,927 | 510,119 |
| Mode M0 | |||
|---|---|---|---|
| Quadrant | BADHDUFLAG | Total packets | Discarded packets |
| A | 0 | 15160 | 2 |
| B | 0 | 15136 | 2 |
| C | 0 | 18223 | 2 |
| D | 0 | 15286 | 2 |
| Mode M9 | |||
|---|---|---|---|
| Quadrant | BADHDUFLAG | Total packets | Discarded packets |
| A | 0 | 7 | 0 |
| B | 0 | 8 | 0 |
| C | 0 | 8 | 0 |
| D | 0 | 8 | 0 |
| Mode SS | |||
|---|---|---|---|
| Quadrant | BADHDUFLAG | Total packets | Discarded packets |
| A | 0 | 150 | 0 |
| B | 0 | 150 | 0 |
| C | 0 | 150 | 0 |
| D | 0 | 150 | 0 |
| Quadrant | Total seconds | Saturated seconds | Saturation percentage |
|---|---|---|---|
| A | 7325 | 81 | 1.105802% |
| B | 7325 | 123 | 1.679181% |
| C | 7325 | 297 | 4.054608% |
| D | 7325 | 79 | 1.078498% |
Noise dominated data is calculated using 1-second bins in cleaned event files. If a bin has >2000 counts, and if more than 50% of those come from <1% of pixels, then it is considered to be noise-dominated and hence unusable.
| Quadrant | # 1 sec bins | Bins with >0 counts | Bins with >2000 counts | High rate bins dominated by noise | Noise dominated (total time) | Noise dominated (detector-on time) | Marked lightcurve |
|---|---|---|---|---|---|---|---|
| A | 7675 | 7326 | 1 | 1 | 0.01% | 0.01% | 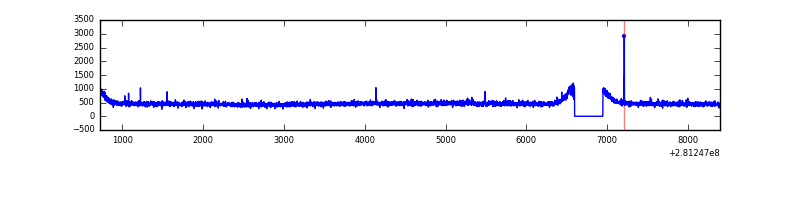 |
| B | 7675 | 7326 | 0 | 0 | 0.00% | 0.00% | 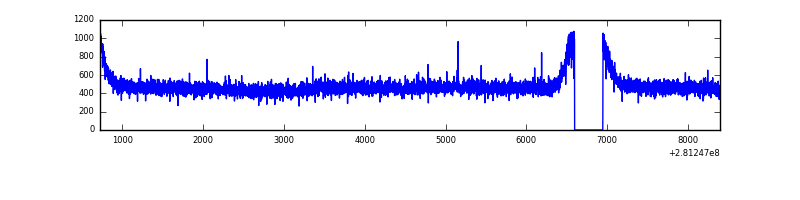 |
| C | 7675 | 7326 | 62 | 62 | 0.81% | 0.85% | 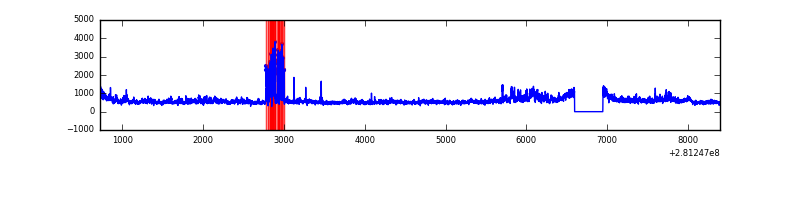 |
| D | 7675 | 7326 | 1 | 1 | 0.01% | 0.01% | 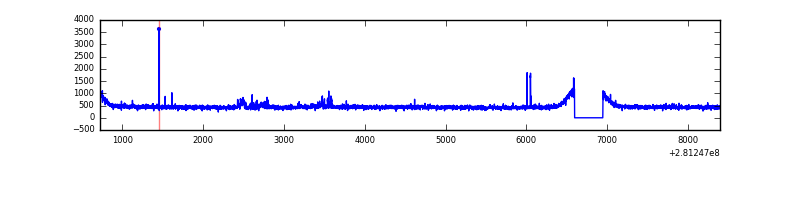 |
Top three noisy pixels from each quadrant. If the there are fewer than three noisy pixels in the level2.evt file, extra rows are filled as -1
| Pixel properties | Quadrant properties | ||||||
|---|---|---|---|---|---|---|---|
| Quadrant | DetID | PixID | Counts | Sigma | Mean | Median | Sigma |
| A | 12 | 189 | 30291 | 161.93 | 887 | 867 | 181.7 |
| A | 0 | 226 | 7618 | 37.15 | 887 | 867 | 181.7 |
| A | 3 | 137 | 6662 | 31.89 | 887 | 867 | 181.7 |
| B | 12 | 111 | 21360 | 117.92 | 889 | 865 | 173.8 |
| B | 11 | 111 | 18362 | 100.67 | 889 | 865 | 173.8 |
| B | 14 | 111 | 16234 | 88.42 | 889 | 865 | 173.8 |
| C | 3 | 233 | 857141 | 4248.73 | 850 | 854 | 201.5 |
| C | 4 | 254 | 259304 | 1282.38 | 850 | 854 | 201.5 |
| C | 14 | 238 | 128645 | 634.07 | 850 | 854 | 201.5 |
| D | 1 | 52 | 49278 | 229.74 | 866 | 843 | 210.8 |
| D | 13 | 232 | 39766 | 184.62 | 866 | 843 | 210.8 |
| D | 2 | 234 | 24772 | 113.5 | 866 | 843 | 210.8 |
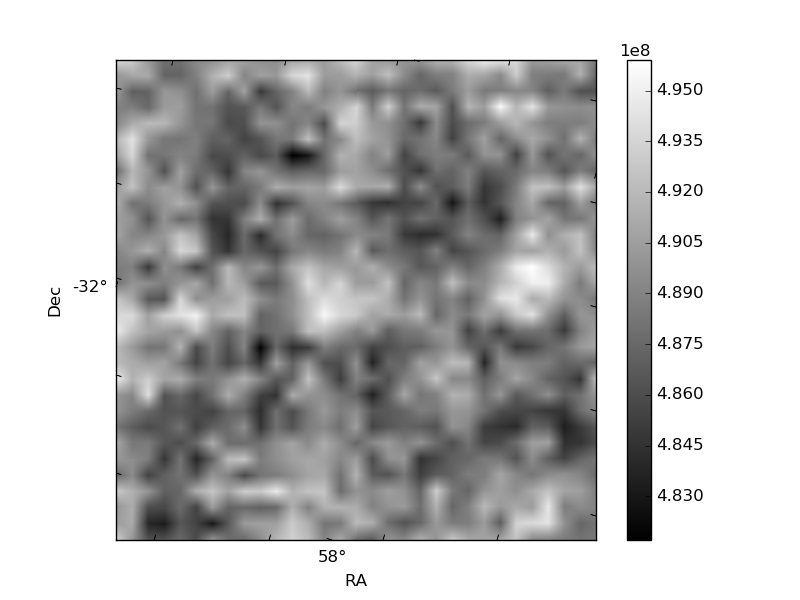
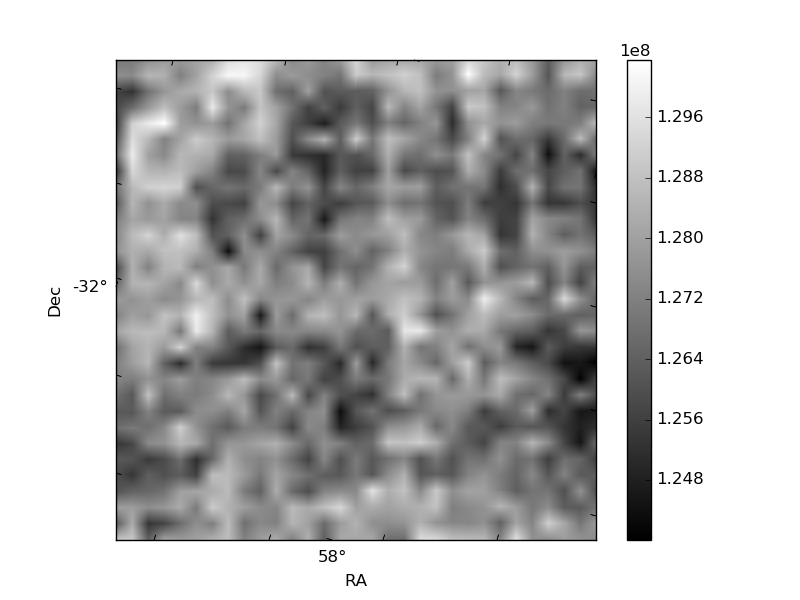
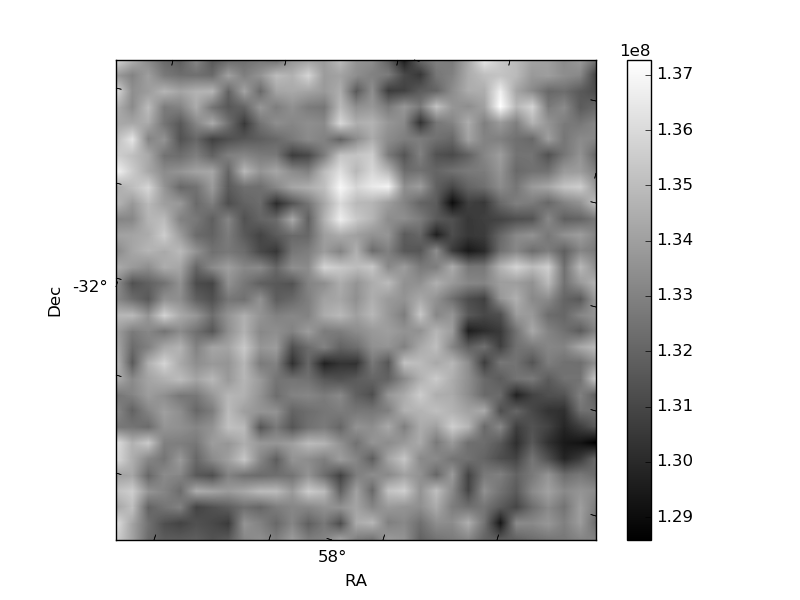
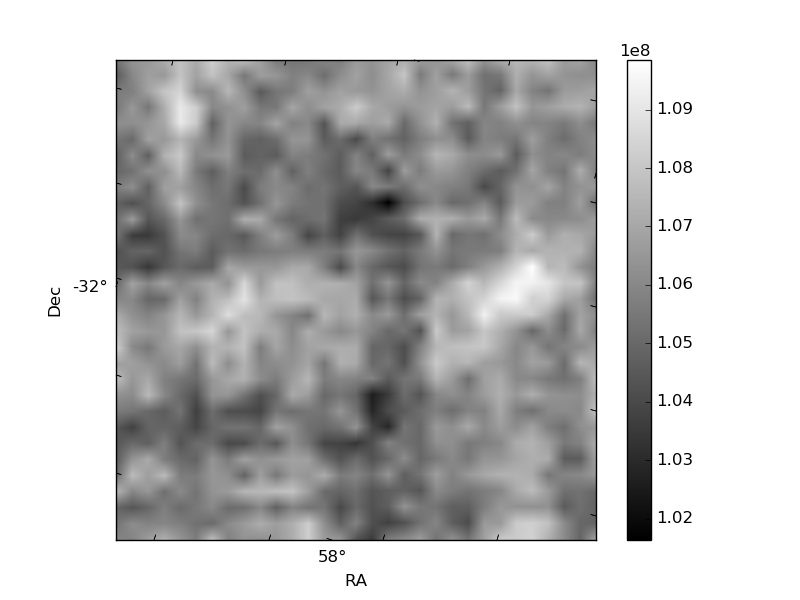
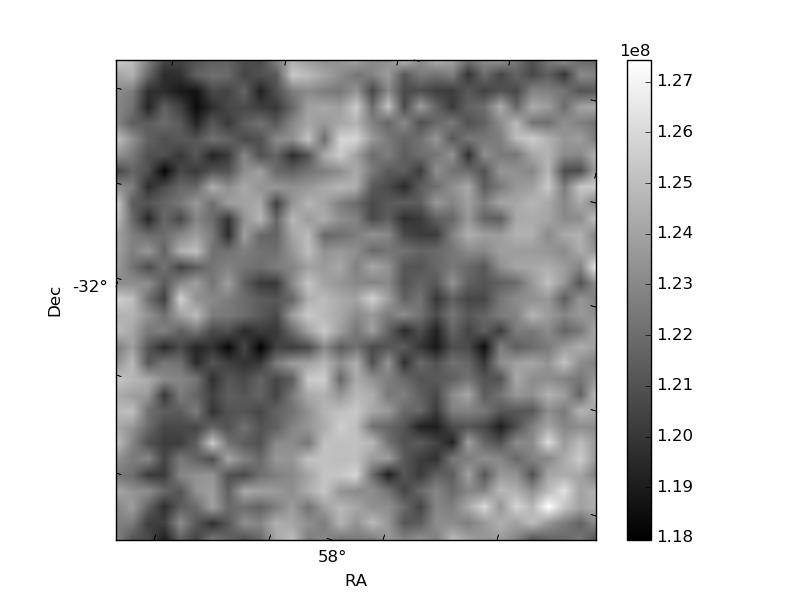
Histogram calculated using DETX and DETY for each event in the final _common_clean file
| Quadrant A | 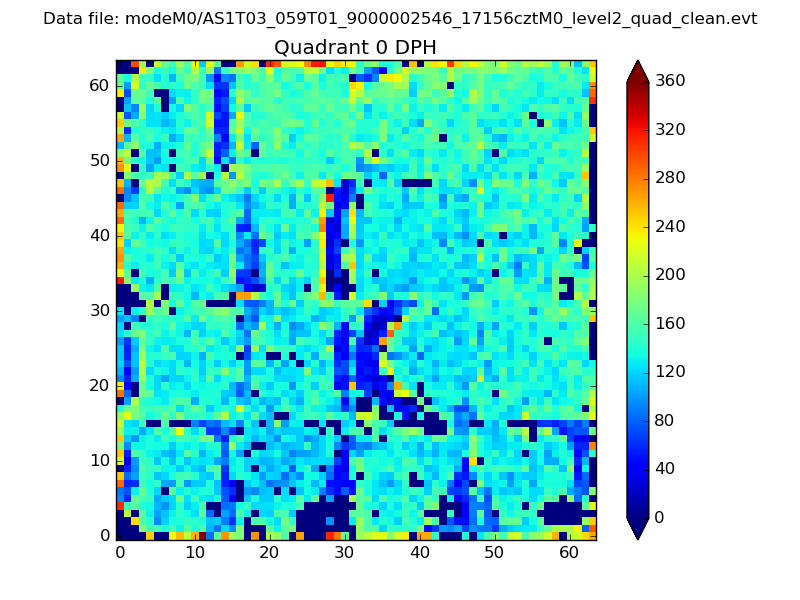 |
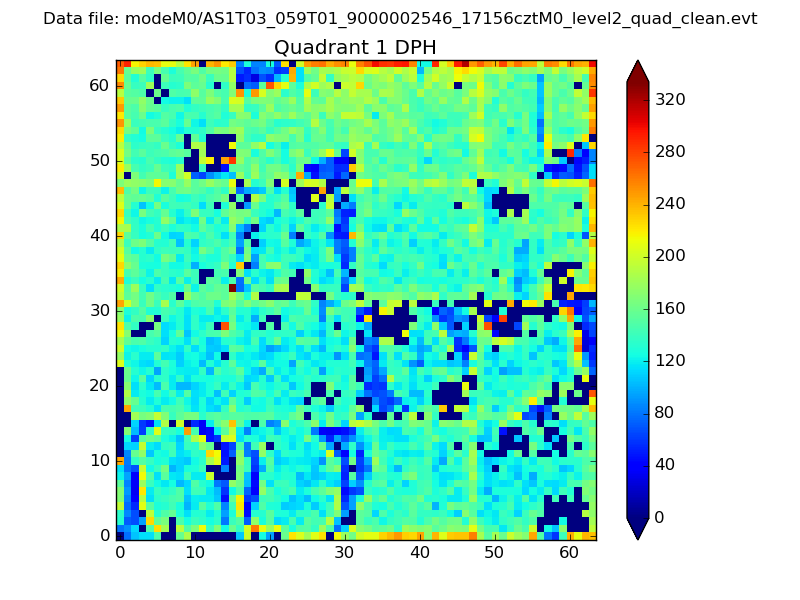 |
Quadrant B |
|---|---|---|---|
| Quadrant D | 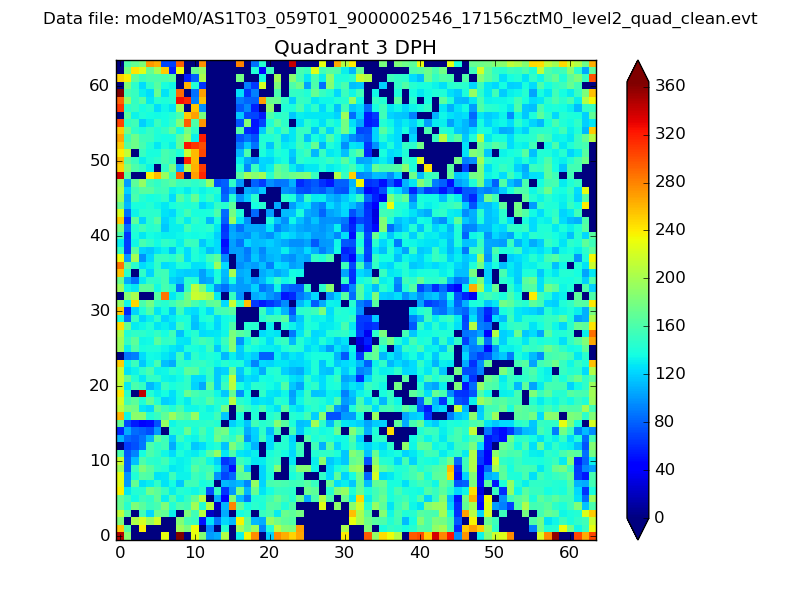 |
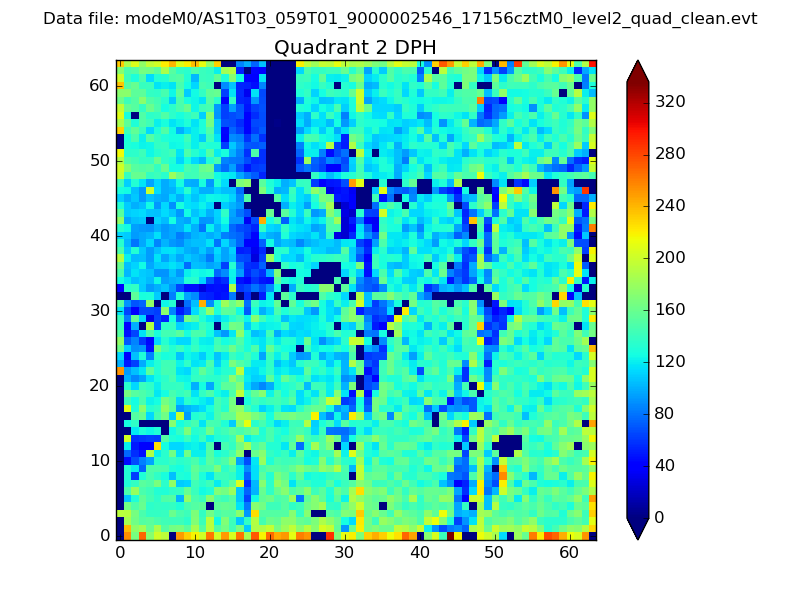 |
Quadrant C |
| Plot type | Count rate plots | Images |
|---|---|---|
| Comparison with Poisson distribution Blue bars denote a histogram of data divided into 1 sec bins. Red curve is a Poisson curve with rate = median count rate of data. |
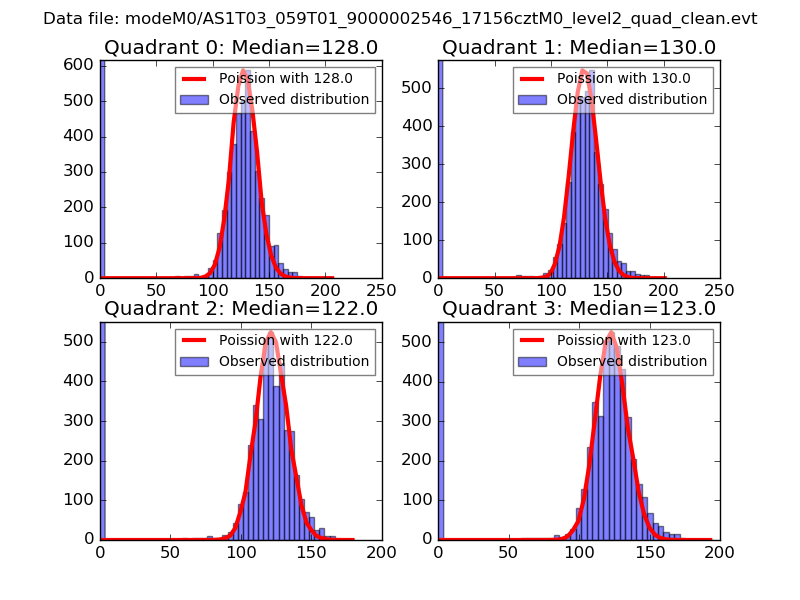 |
 |
| Quadrant-wise count rates Data is divided into 100 sec bins |
 |
|
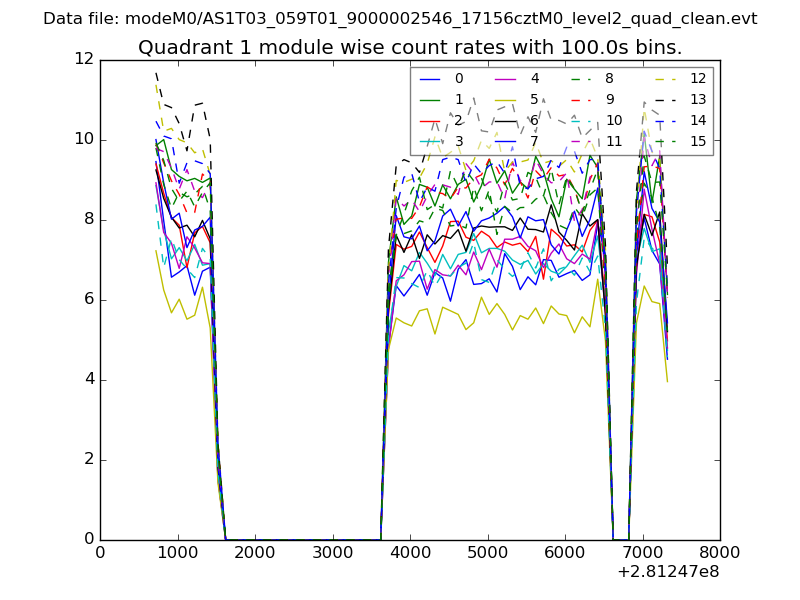
| Module-wise count rates for Quadrant A Data is divided into 100 sec bins |
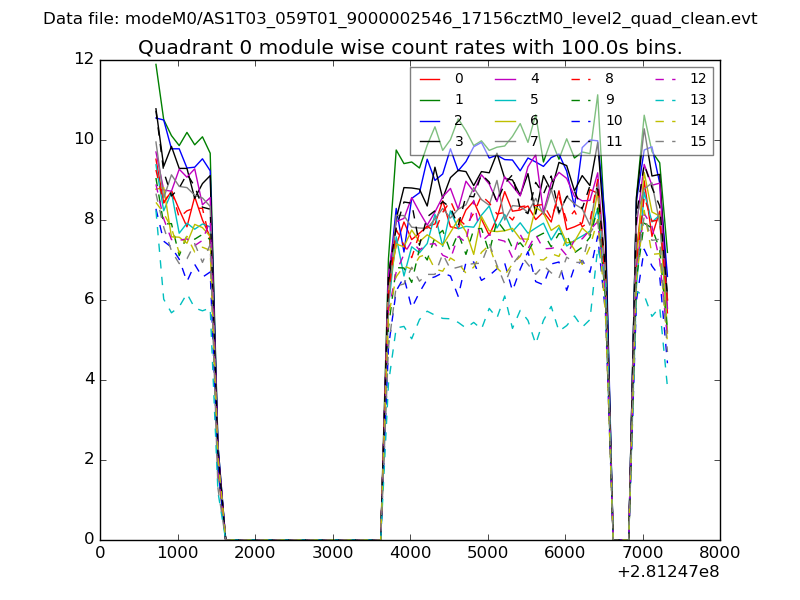 |
 |
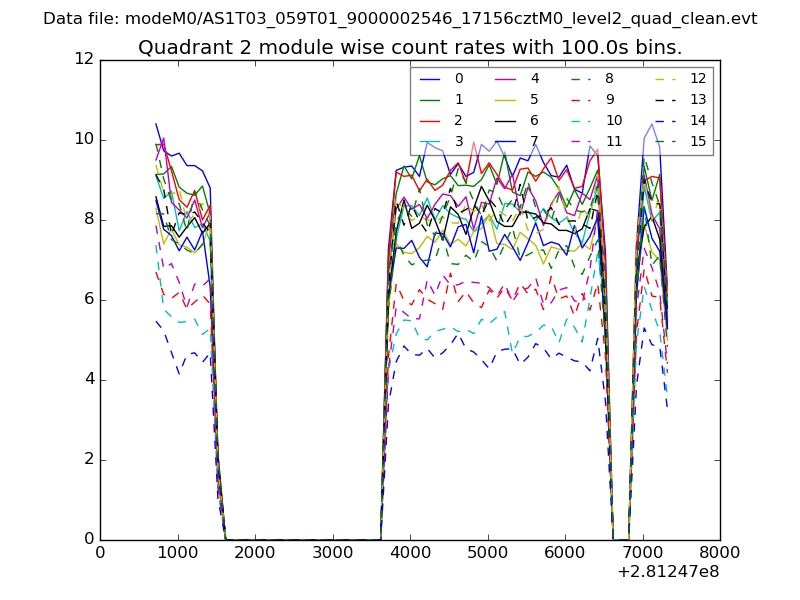
| Module-wise count rates for Quadrant B Data is divided into 100 sec bins |
 |
 |
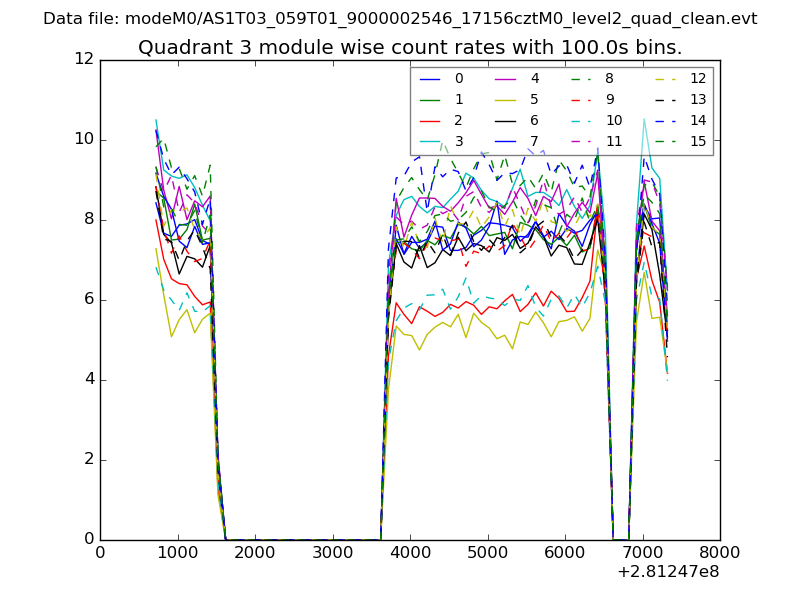
| Module-wise count rates for Quadrant C Data is divided into 100 sec bins |
 |
 |
| Module-wise count rates for Quadrant D Data is divided into 100 sec bins |
 |
 |
| Parameter | Plot |
|---|---|
| CZT HV Monitor | 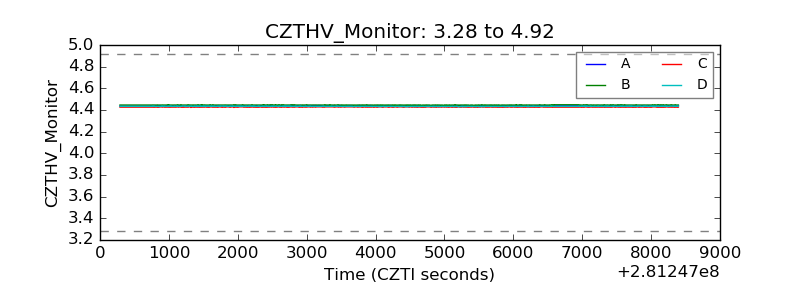 |
| D_VDD | 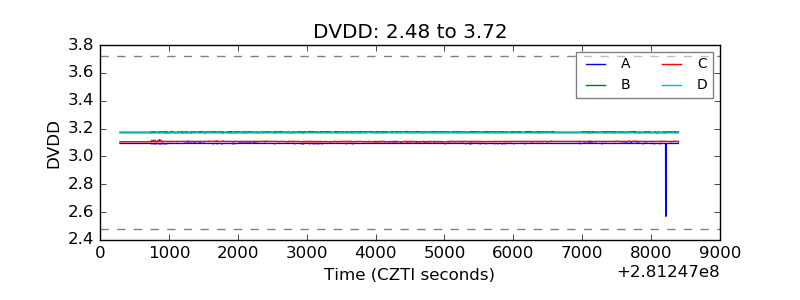 |
| Temperature 1 | 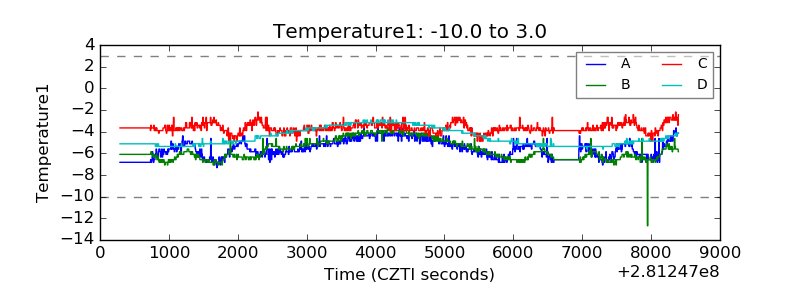 |
| Veto HV Monitor | 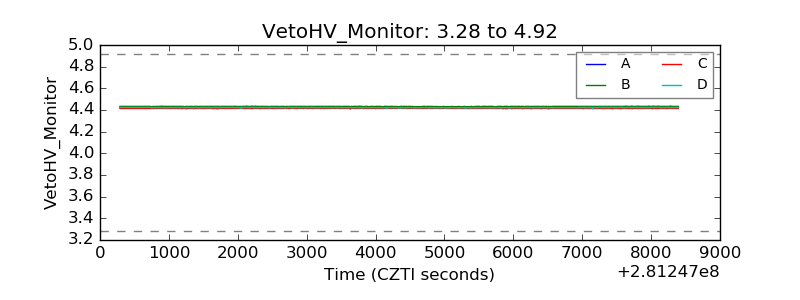 |
| Veto LLD | 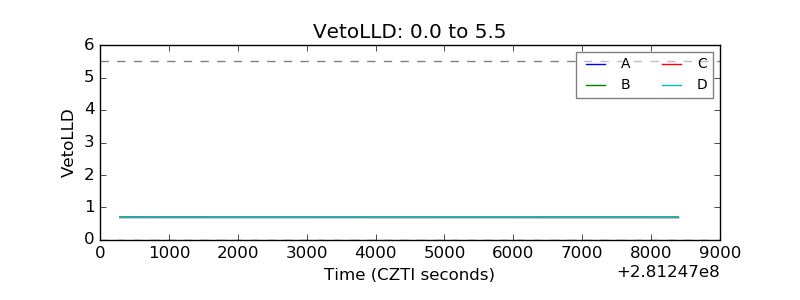 |
| Alpha Counter |  |
| _CPM_Rate | 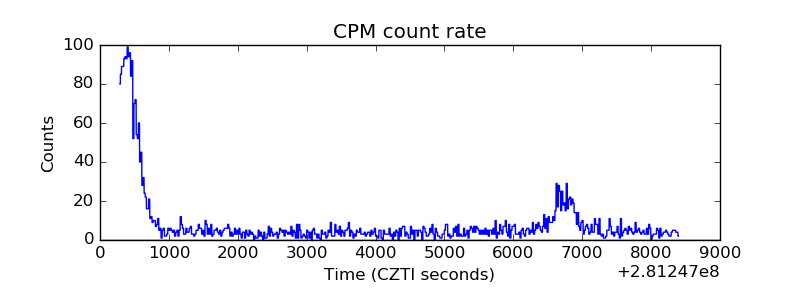 |
| CZT Counter | 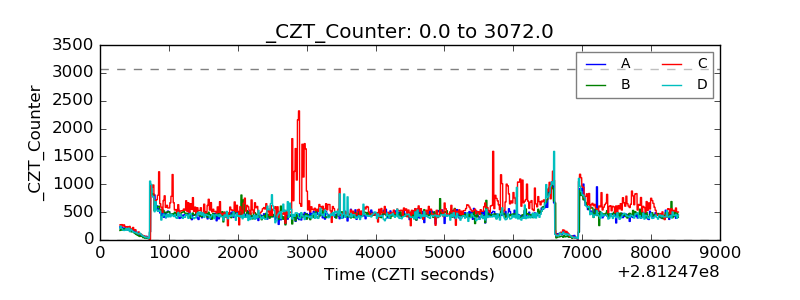 |
| +2.5 Volts monitor | 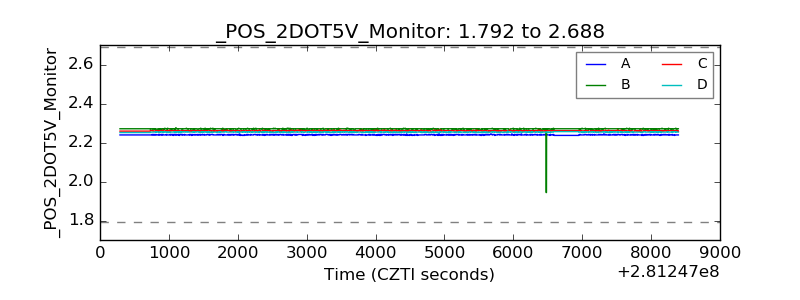 |
| +5 Volts monitor |  |
| _ROLL_ROT | 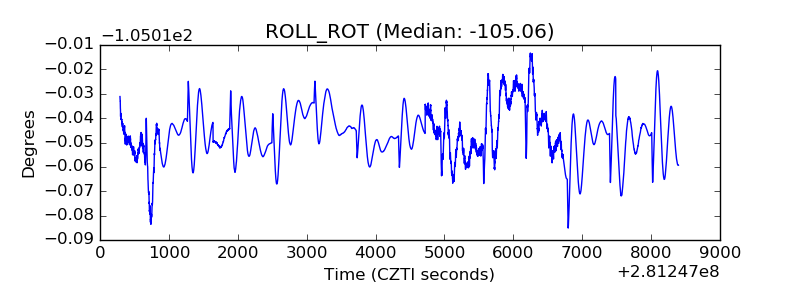 |
| _Roll_DEC | 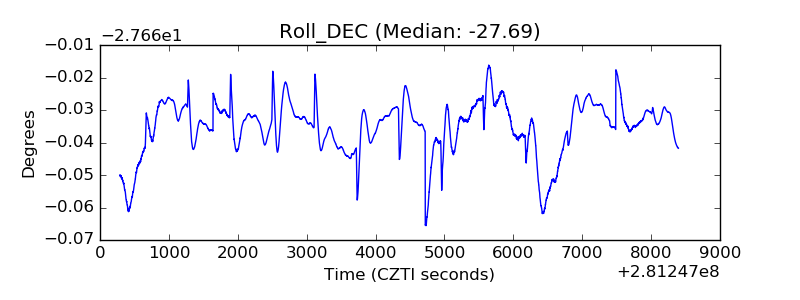 |
| _Roll_RA | 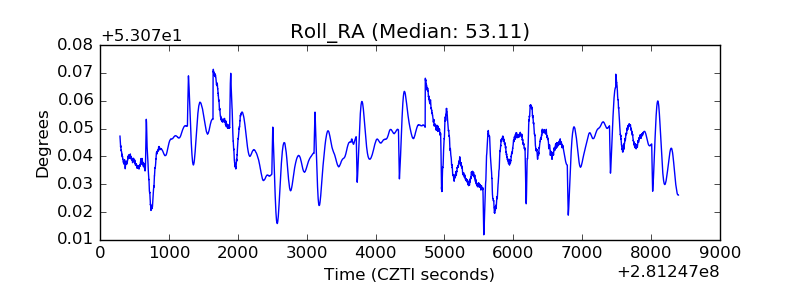 |
| Veto Counter | 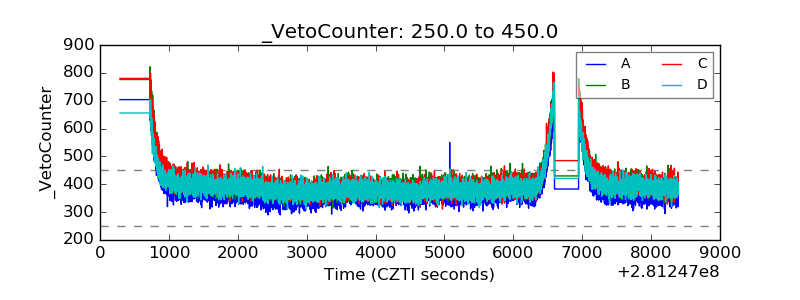 |