| Param | Original file | Final file |
|---|---|---|
| Filename | modeM0/AS1T03_059T01_9000002546_17157cztM0_level2.evt | modeM0/AS1T03_059T01_9000002546_17157cztM0_level2_quad_clean.evt |
| Size (bytes) | 582,189,120 | 94,789,440 |
| Size | 555.2 MB | 90.4 MB |
| Events in quadrant A | 4,173,846 | 580,110 |
| Events in quadrant B | 4,132,203 | 587,957 |
| Events in quadrant C | 4,692,869 | 553,133 |
| Events in quadrant D | 4,059,126 | 562,067 |
| Mode M0 | |||
|---|---|---|---|
| Quadrant | BADHDUFLAG | Total packets | Discarded packets |
| A | 0 | 18094 | 3 |
| B | 0 | 17880 | 4 |
| C | 0 | 19270 | 3 |
| D | 0 | 18193 | 3 |
| Mode M9 | |||
|---|---|---|---|
| Quadrant | BADHDUFLAG | Total packets | Discarded packets |
| A | 0 | 3 | 0 |
| B | 0 | 3 | 0 |
| C | 0 | 3 | 0 |
| D | 0 | 3 | 0 |
| Mode SS | |||
|---|---|---|---|
| Quadrant | BADHDUFLAG | Total packets | Discarded packets |
| A | 0 | 172 | 0 |
| B | 0 | 172 | 0 |
| C | 0 | 172 | 0 |
| D | 0 | 172 | 0 |
| Quadrant | Total seconds | Saturated seconds | Saturation percentage |
|---|---|---|---|
| A | 8441 | 345 | 4.087193% |
| B | 8441 | 390 | 4.620306% |
| C | 8441 | 456 | 5.402204% |
| D | 8441 | 320 | 3.791020% |
Noise dominated data is calculated using 1-second bins in cleaned event files. If a bin has >2000 counts, and if more than 50% of those come from <1% of pixels, then it is considered to be noise-dominated and hence unusable.
| Quadrant | # 1 sec bins | Bins with >0 counts | Bins with >2000 counts | High rate bins dominated by noise | Noise dominated (total time) | Noise dominated (detector-on time) | Marked lightcurve |
|---|---|---|---|---|---|---|---|
| A | 8861 | 8442 | 1 | 1 | 0.01% | 0.01% | 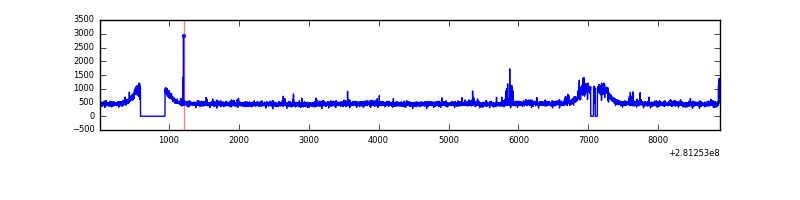 |
| B | 8861 | 8443 | 0 | 0 | 0.00% | 0.00% | 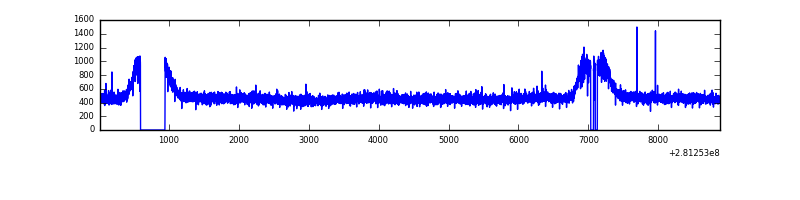 |
| C | 8861 | 8442 | 0 | 0 | 0.00% | 0.00% | 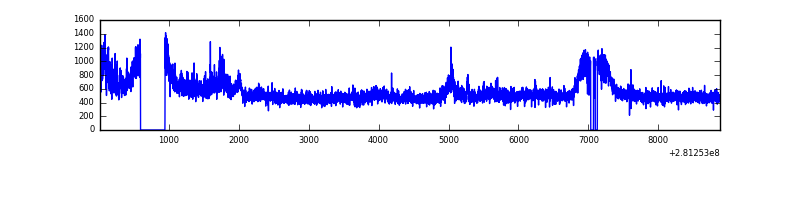 |
| D | 8861 | 8442 | 12 | 12 | 0.14% | 0.14% | 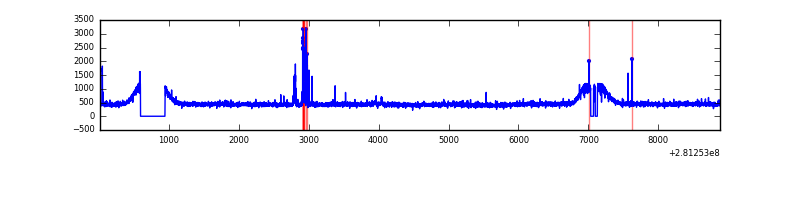 |
Top three noisy pixels from each quadrant. If the there are fewer than three noisy pixels in the level2.evt file, extra rows are filled as -1
| Pixel properties | Quadrant properties | ||||||
|---|---|---|---|---|---|---|---|
| Quadrant | DetID | PixID | Counts | Sigma | Mean | Median | Sigma |
| A | 12 | 189 | 73397 | 333.63 | 1059 | 1035 | 216.9 |
| A | 12 | 96 | 32998 | 147.37 | 1059 | 1035 | 216.9 |
| A | 0 | 226 | 9134 | 37.34 | 1059 | 1035 | 216.9 |
| B | 12 | 111 | 26209 | 120.53 | 1056 | 1030 | 208.9 |
| B | 11 | 111 | 22847 | 104.44 | 1056 | 1030 | 208.9 |
| B | 14 | 111 | 19964 | 90.63 | 1056 | 1030 | 208.9 |
| C | 3 | 233 | 562789 | 2303.99 | 1020 | 1027 | 243.8 |
| C | 14 | 238 | 150894 | 614.66 | 1020 | 1027 | 243.8 |
| C | 13 | 61 | 7304 | 25.74 | 1020 | 1027 | 243.8 |
| D | 13 | 249 | 83099 | 318.7 | 1046 | 1016 | 257.6 |
| D | 2 | 234 | 29271 | 109.7 | 1046 | 1016 | 257.6 |
| D | 12 | 235 | 18053 | 66.15 | 1046 | 1016 | 257.6 |
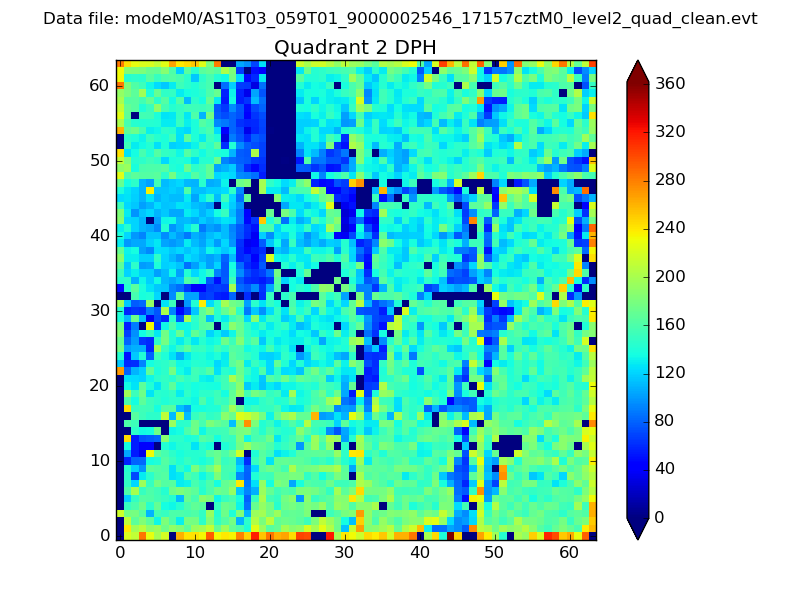
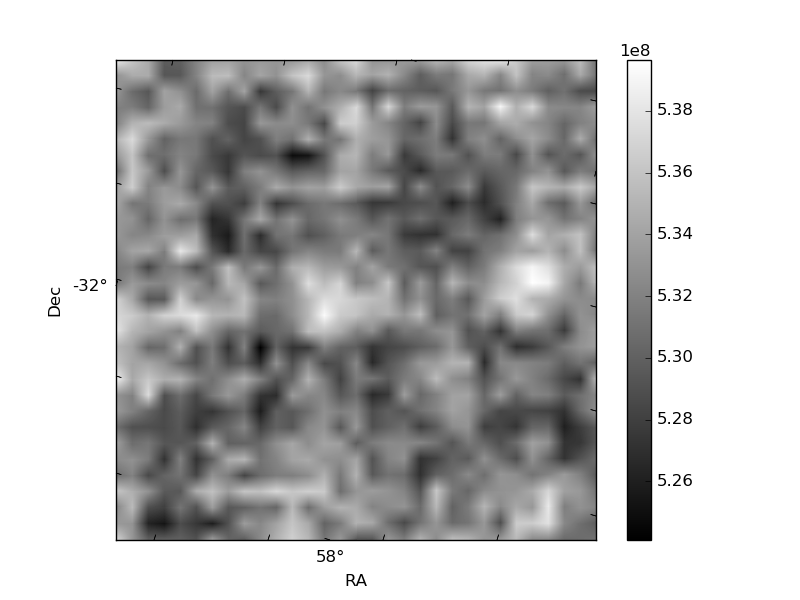
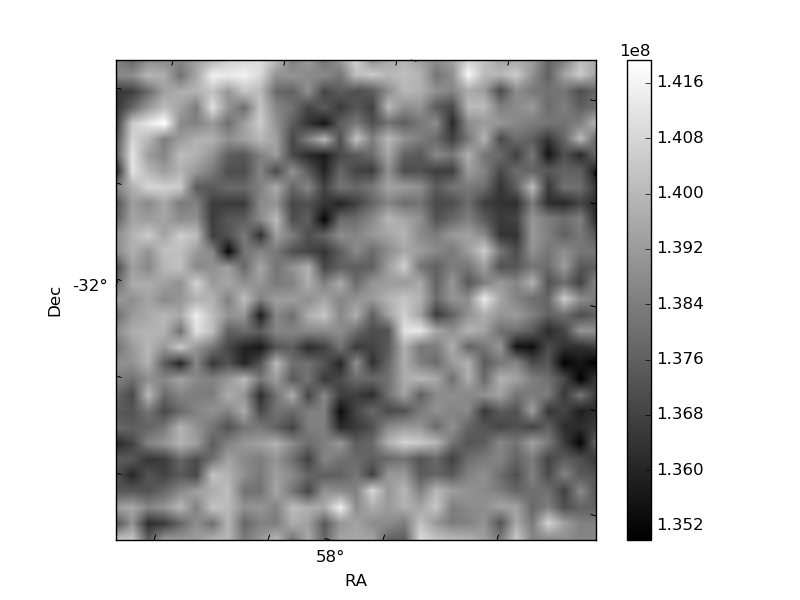
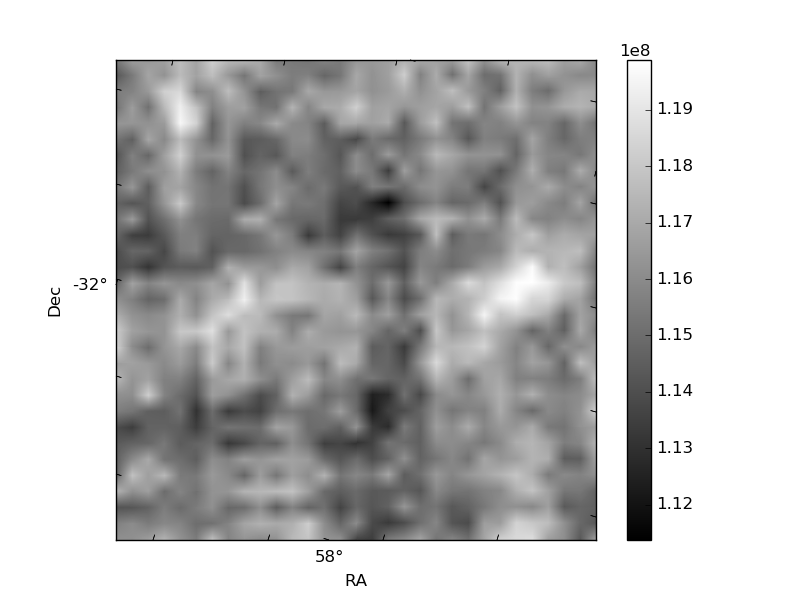
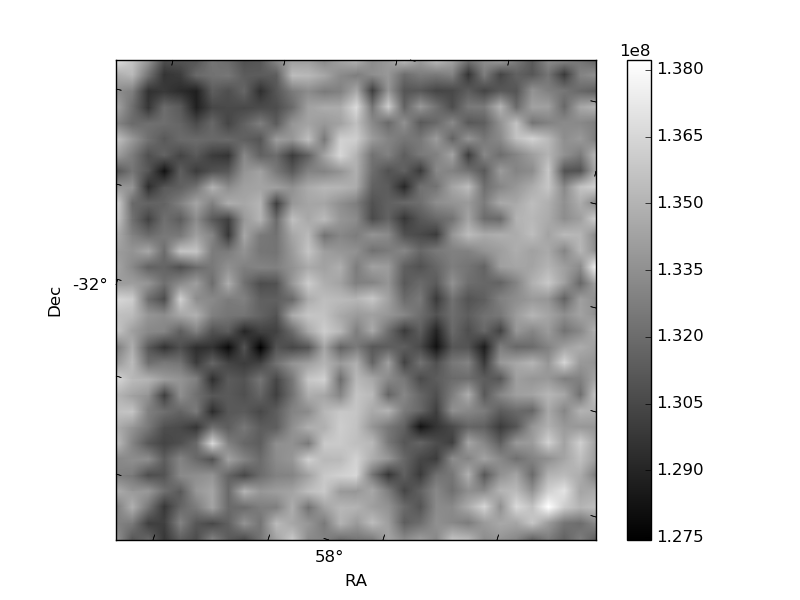
Histogram calculated using DETX and DETY for each event in the final _common_clean file
| Quadrant A | 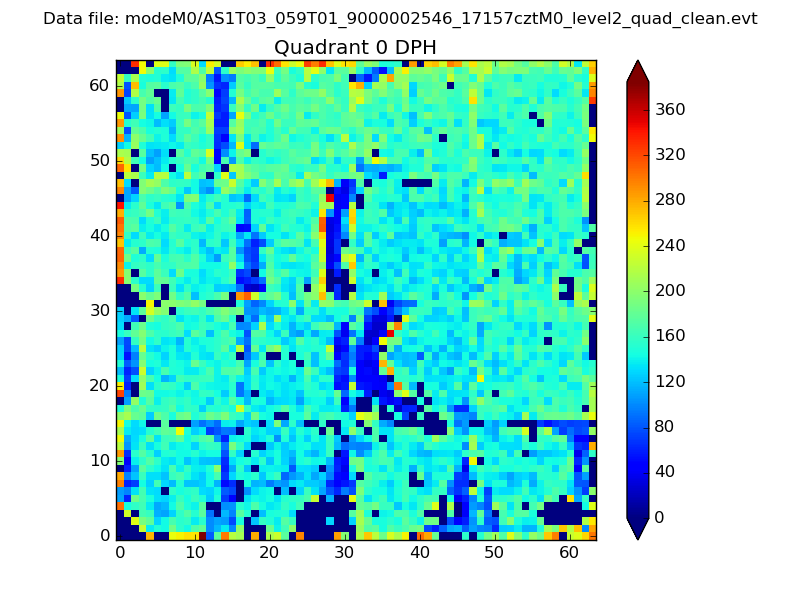 |
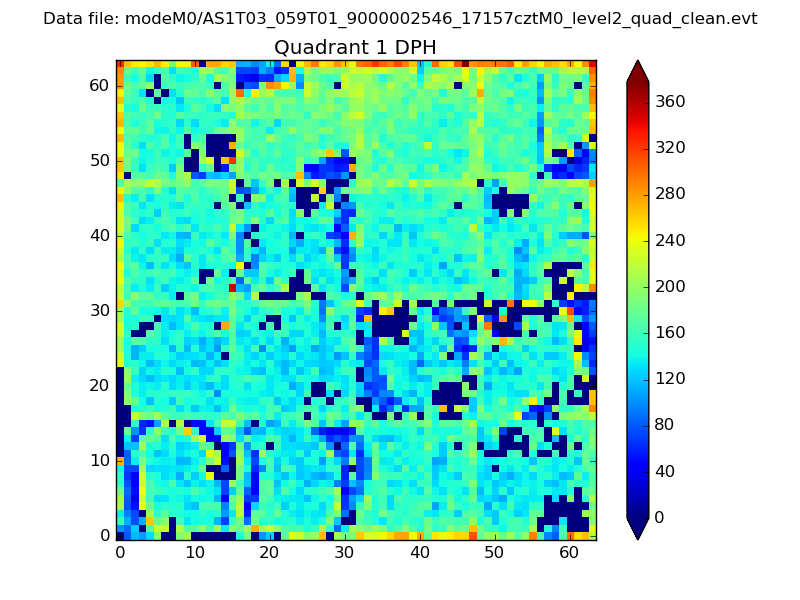 |
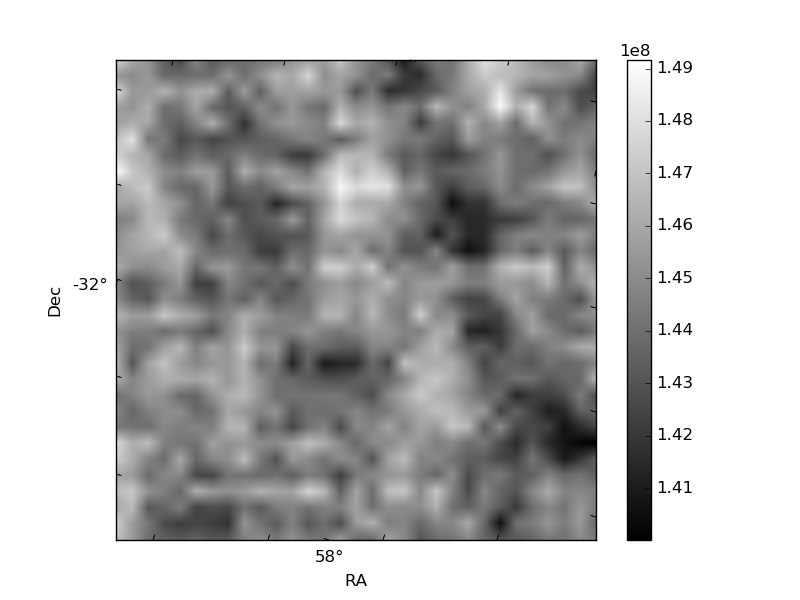
Quadrant B |
|---|---|---|---|
| Quadrant D | 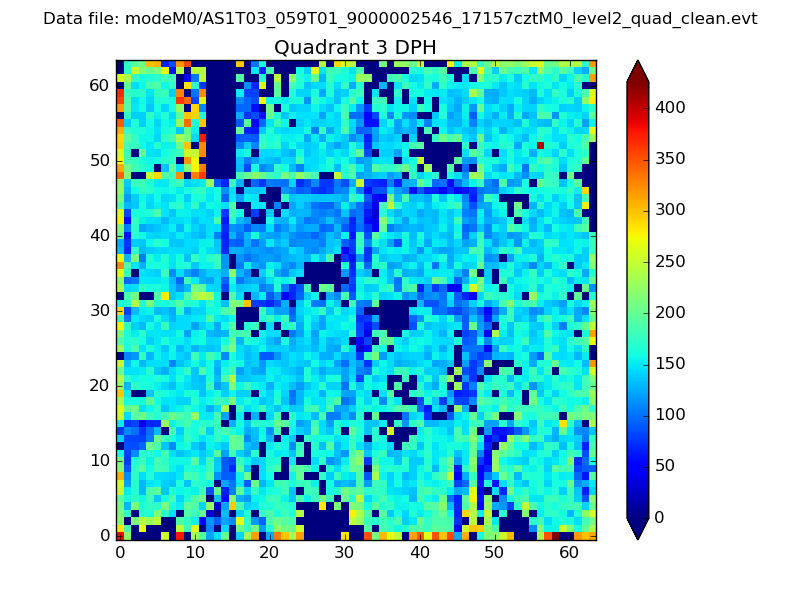 |
 |
Quadrant C |
| Plot type | Count rate plots | Images |
|---|---|---|
| Comparison with Poisson distribution Blue bars denote a histogram of data divided into 1 sec bins. Red curve is a Poisson curve with rate = median count rate of data. |
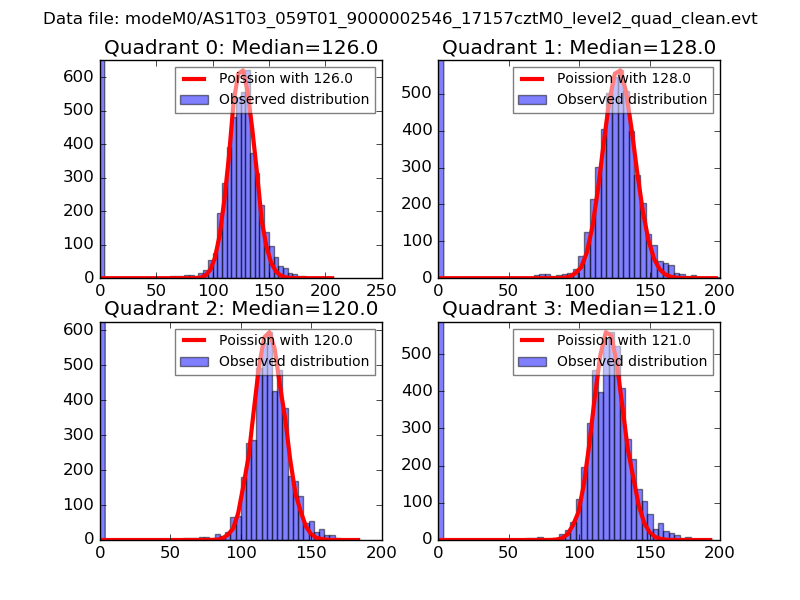 |
 |
| Quadrant-wise count rates Data is divided into 100 sec bins |
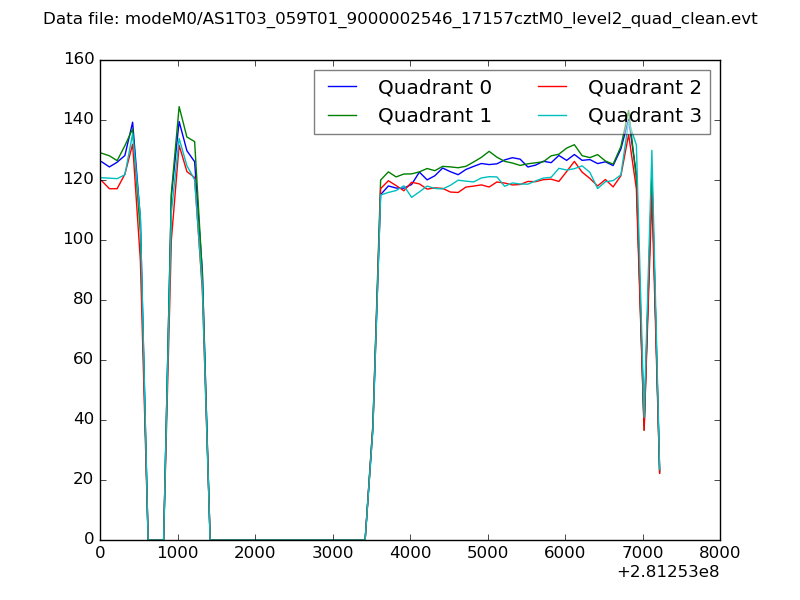 |
|
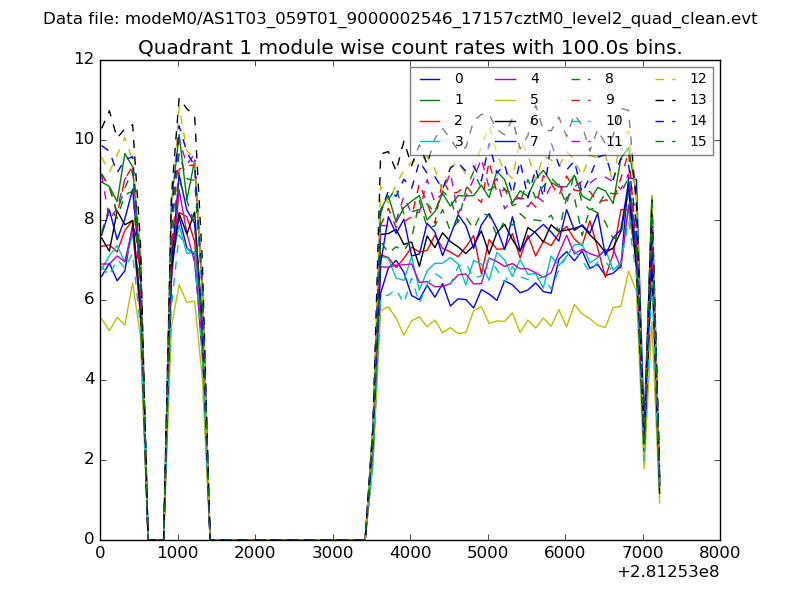
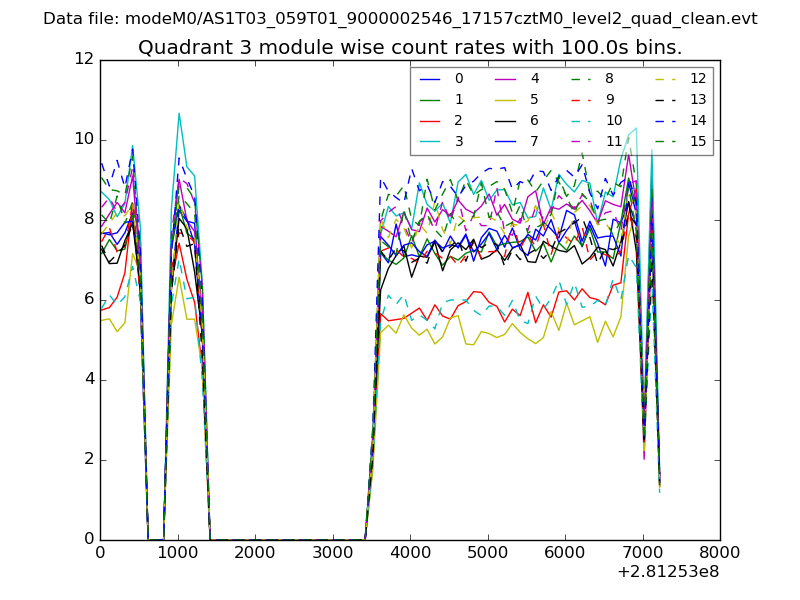
| Module-wise count rates for Quadrant A Data is divided into 100 sec bins |
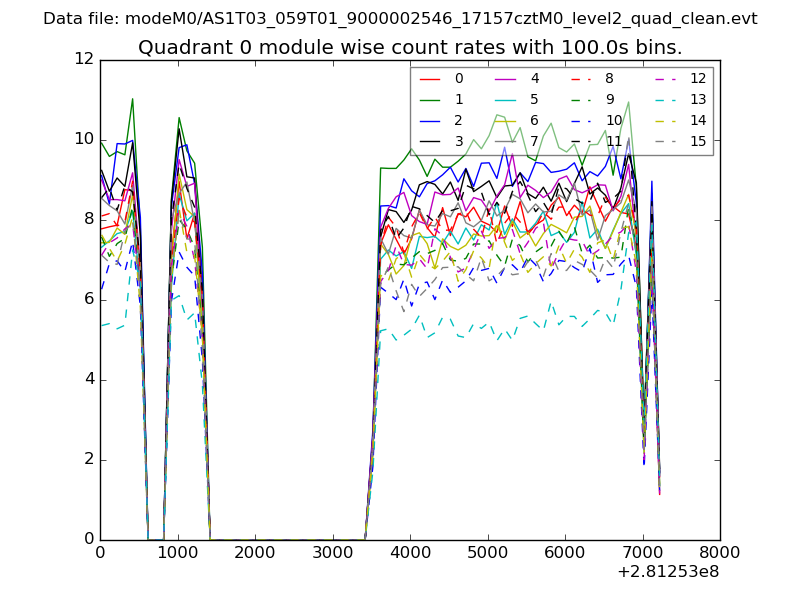 |
 |
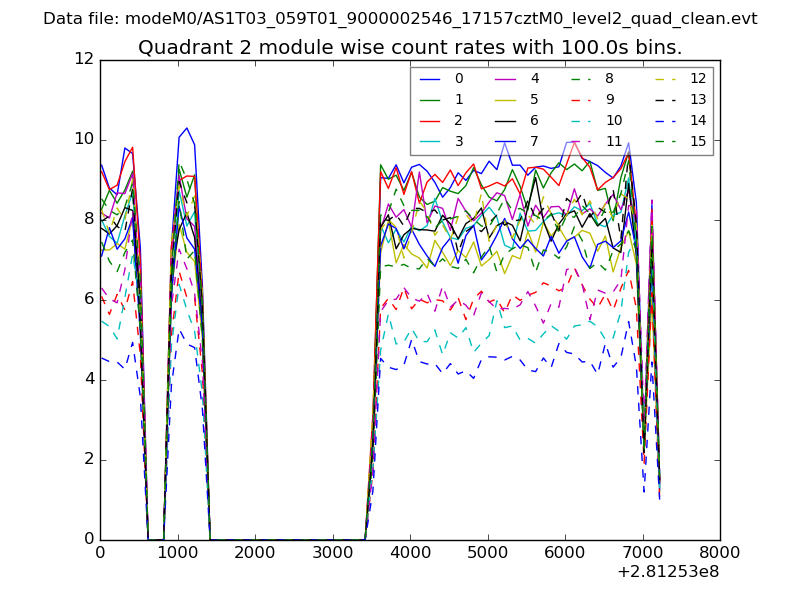
| Module-wise count rates for Quadrant B Data is divided into 100 sec bins |
 |
 |
| Module-wise count rates for Quadrant C Data is divided into 100 sec bins |
 |
 |
| Module-wise count rates for Quadrant D Data is divided into 100 sec bins |
 |
 |
| Parameter | Plot |
|---|---|
| CZT HV Monitor | 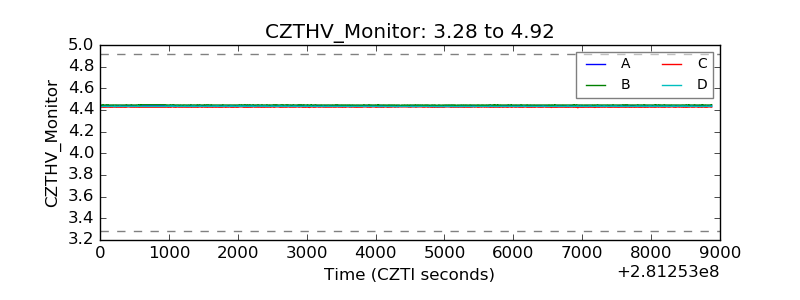 |
| D_VDD | 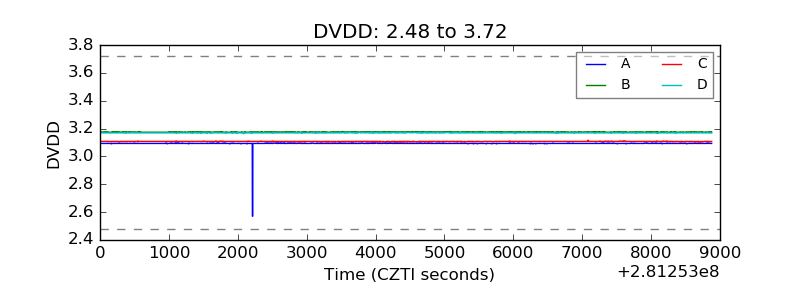 |
| Temperature 1 | 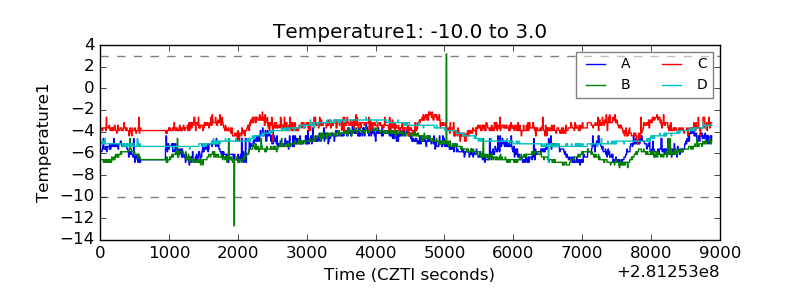 |
| Veto HV Monitor | 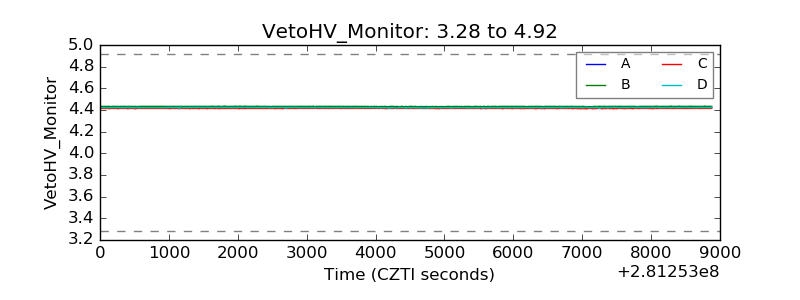 |
| Veto LLD | 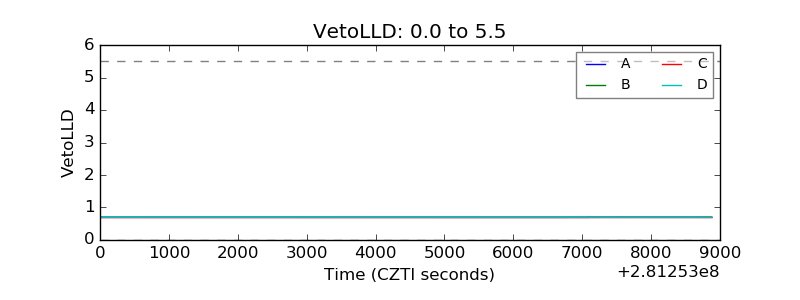 |
| Alpha Counter | 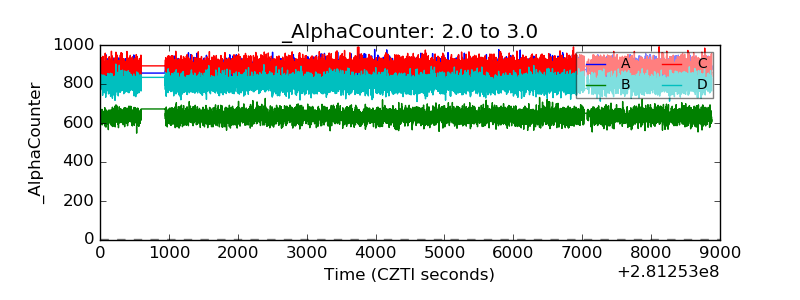 |
| _CPM_Rate | 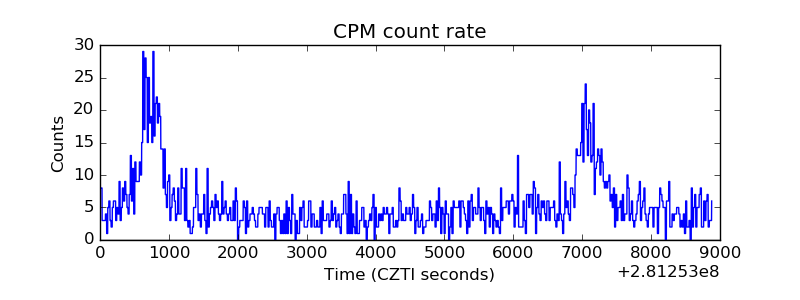 |
| CZT Counter | 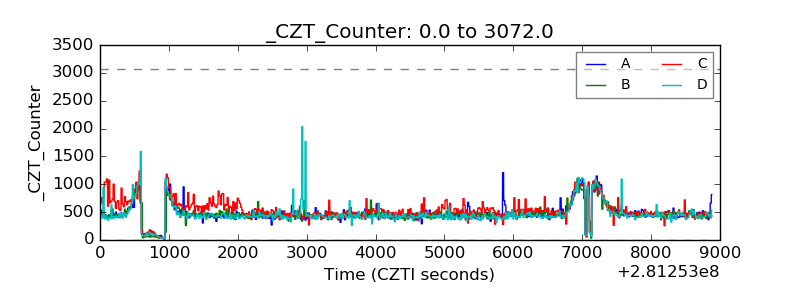 |
| +2.5 Volts monitor | 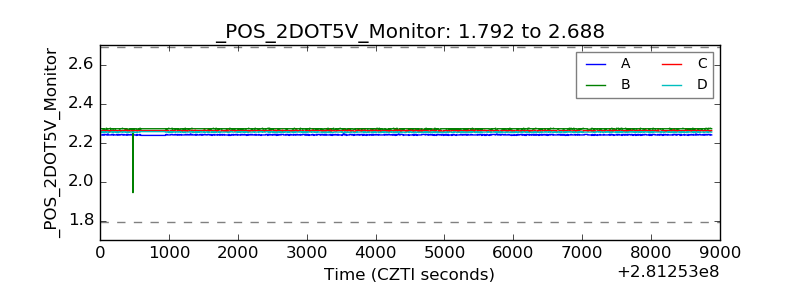 |
| +5 Volts monitor |  |
| _ROLL_ROT | 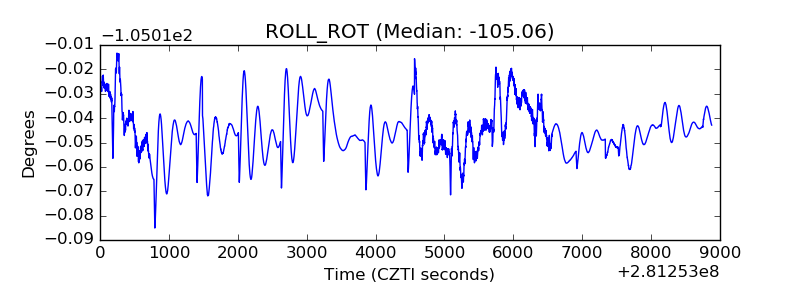 |
| _Roll_DEC | 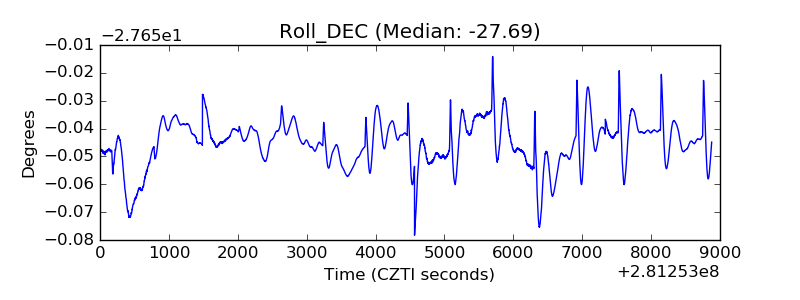 |
| _Roll_RA | 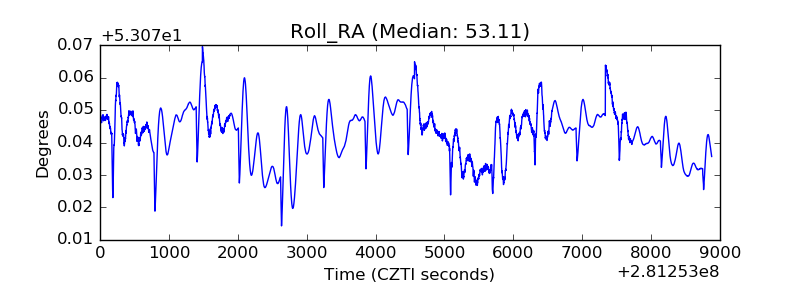 |
| Veto Counter | 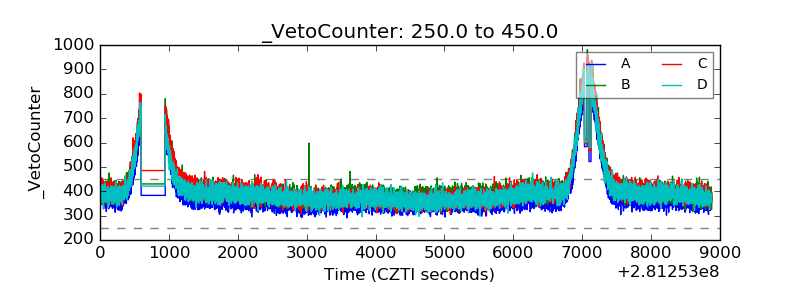 |