| Param | Original file | Final file |
|---|---|---|
| Filename | modeM0/AS1T03_059T01_9000002546_17160cztM0_level2.evt | modeM0/AS1T03_059T01_9000002546_17160cztM0_level2_quad_clean.evt |
| Size (bytes) | 848,568,960 | 157,458,240 |
| Size | 809.3 MB | 150.2 MB |
| Events in quadrant A | 6,325,623 | 979,572 |
| Events in quadrant B | 6,216,844 | 992,096 |
| Events in quadrant C | 6,327,872 | 943,817 |
| Events in quadrant D | 5,939,951 | 947,510 |
| Mode M0 | |||
|---|---|---|---|
| Quadrant | BADHDUFLAG | Total packets | Discarded packets |
| A | 0 | 27453 | 3 |
| B | 0 | 27039 | 3 |
| C | 0 | 27209 | 3 |
| D | 0 | 27141 | 3 |
| Mode M9 | |||
|---|---|---|---|
| Quadrant | BADHDUFLAG | Total packets | Discarded packets |
| A | 0 | 15 | 0 |
| B | 0 | 15 | 0 |
| C | 0 | 15 | 0 |
| D | 0 | 15 | 0 |
| Mode SS | |||
|---|---|---|---|
| Quadrant | BADHDUFLAG | Total packets | Discarded packets |
| A | 0 | 268 | 0 |
| B | 0 | 268 | 0 |
| C | 0 | 268 | 0 |
| D | 0 | 268 | 0 |
| Quadrant | Total seconds | Saturated seconds | Saturation percentage |
|---|---|---|---|
| A | 13111 | 307 | 2.341545% |
| B | 13112 | 299 | 2.280354% |
| C | 13112 | 322 | 2.455766% |
| D | 13112 | 230 | 1.754118% |
Noise dominated data is calculated using 1-second bins in cleaned event files. If a bin has >2000 counts, and if more than 50% of those come from <1% of pixels, then it is considered to be noise-dominated and hence unusable.
| Quadrant | # 1 sec bins | Bins with >0 counts | Bins with >2000 counts | High rate bins dominated by noise | Noise dominated (total time) | Noise dominated (detector-on time) | Marked lightcurve |
|---|---|---|---|---|---|---|---|
| A | 14696 | 13111 | 11 | 11 | 0.07% | 0.08% | 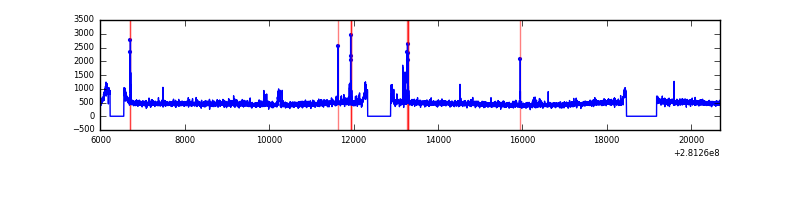 |
| B | 14697 | 13112 | 4 | 4 | 0.03% | 0.03% | 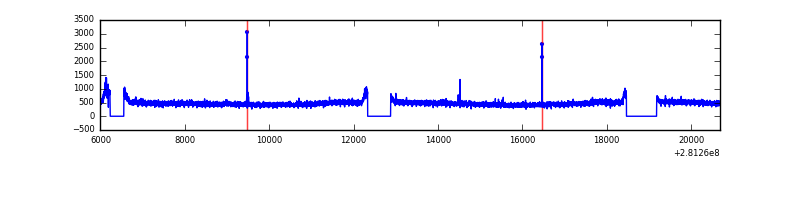 |
| C | 14697 | 13112 | 0 | 0 | 0.00% | 0.00% | 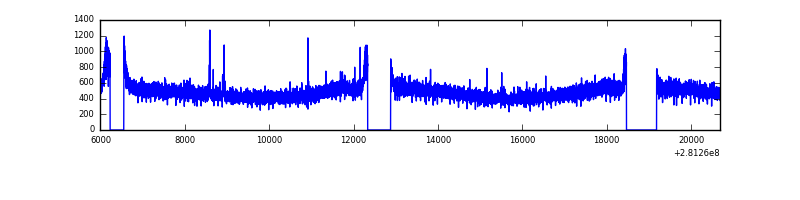 |
| D | 14697 | 13112 | 1 | 1 | 0.01% | 0.01% | 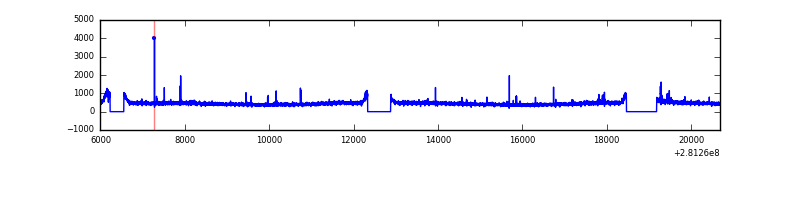 |
Top three noisy pixels from each quadrant. If the there are fewer than three noisy pixels in the level2.evt file, extra rows are filled as -1
| Pixel properties | Quadrant properties | ||||||
|---|---|---|---|---|---|---|---|
| Quadrant | DetID | PixID | Counts | Sigma | Mean | Median | Sigma |
| A | 12 | 96 | 122697 | 378.92 | 1588 | 1550 | 319.7 |
| A | 12 | 189 | 99859 | 307.49 | 1588 | 1550 | 319.7 |
| A | 0 | 226 | 13837 | 38.43 | 1588 | 1550 | 319.7 |
| B | 12 | 111 | 38467 | 120.06 | 1582 | 1541 | 307.6 |
| B | 11 | 111 | 33473 | 103.82 | 1582 | 1541 | 307.6 |
| B | 14 | 111 | 29199 | 89.92 | 1582 | 1541 | 307.6 |
| C | 14 | 238 | 230688 | 637.33 | 1523 | 1535 | 359.6 |
| C | 3 | 233 | 128070 | 351.92 | 1523 | 1535 | 359.6 |
| C | 8 | 128 | 15452 | 38.71 | 1523 | 1535 | 359.6 |
| D | 2 | 234 | 53581 | 138.77 | 1548 | 1503 | 375.3 |
| D | 5 | 222 | 27853 | 70.21 | 1548 | 1503 | 375.3 |
| D | 2 | 152 | 19233 | 47.24 | 1548 | 1503 | 375.3 |
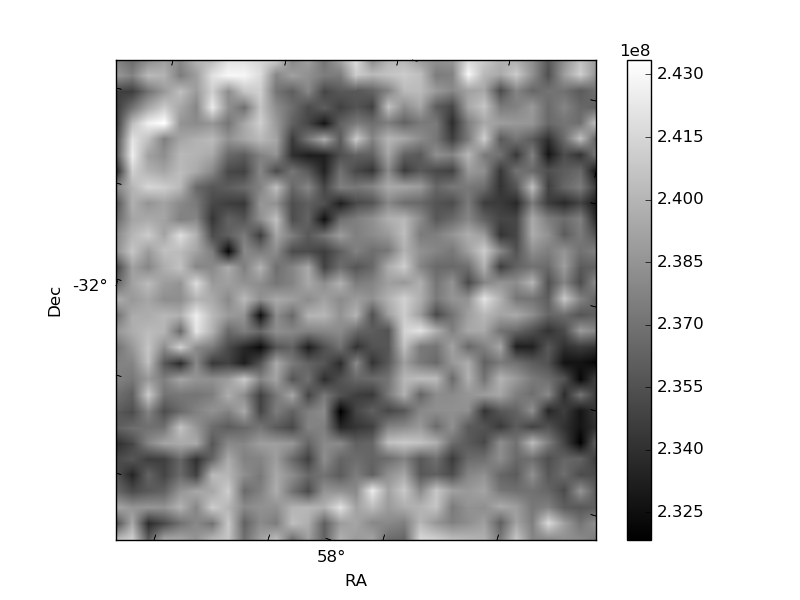
Histogram calculated using DETX and DETY for each event in the final _common_clean file
| Quadrant A | 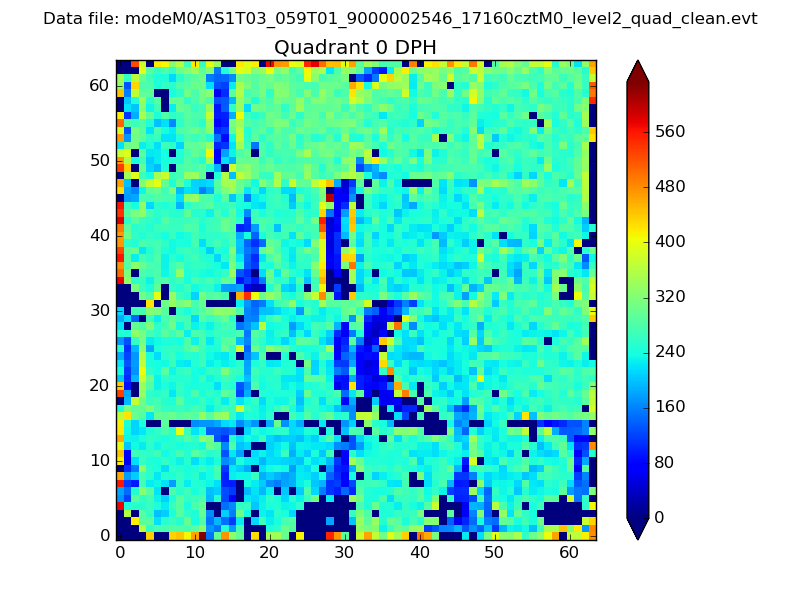 |
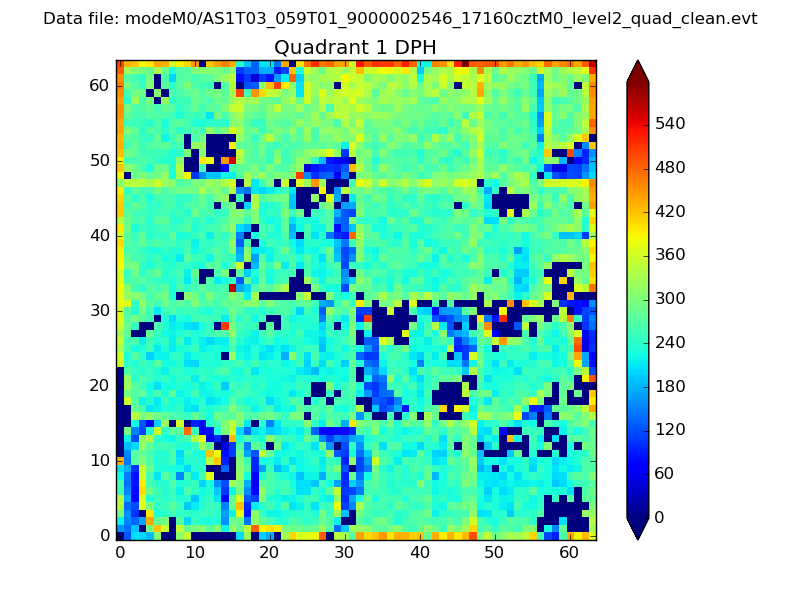 |
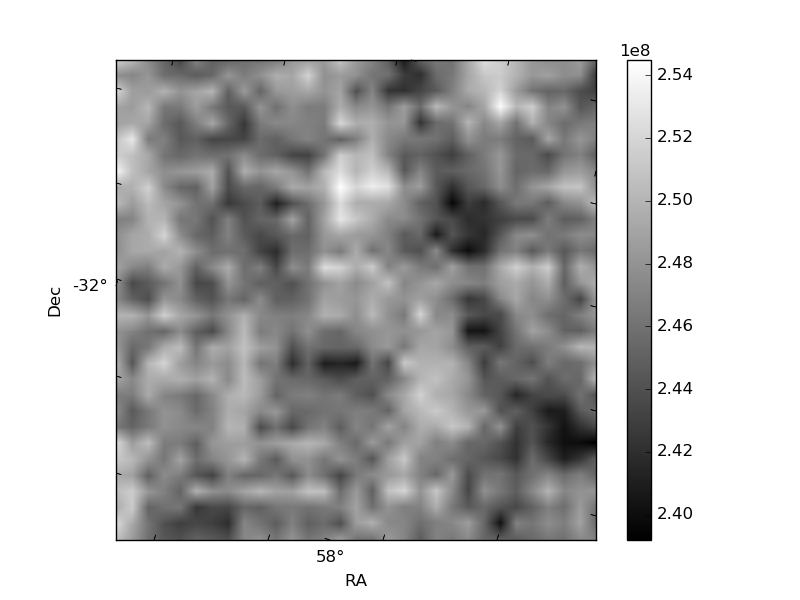
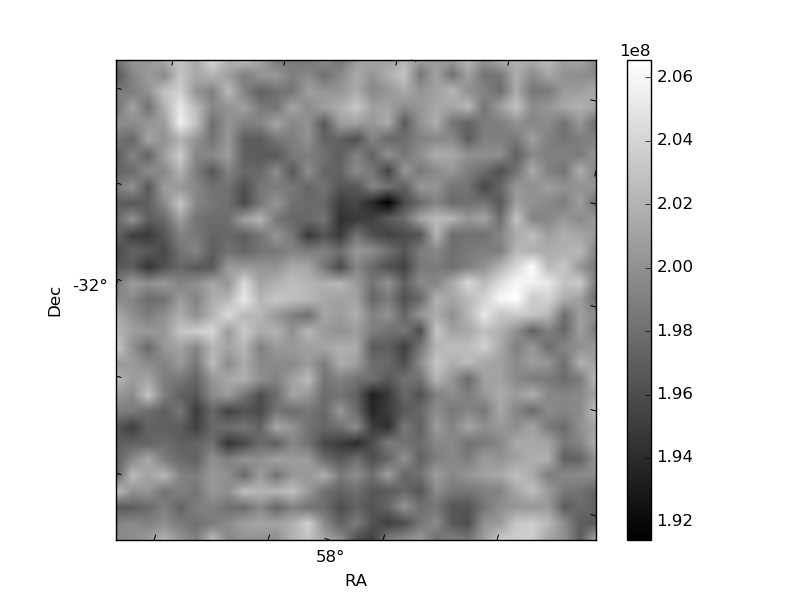
Quadrant B |
|---|---|---|---|
| Quadrant D |  |
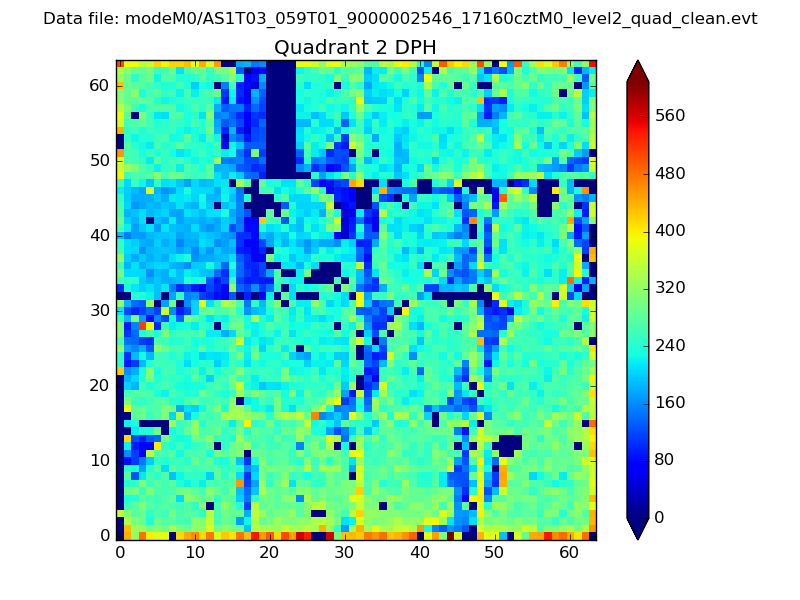 |
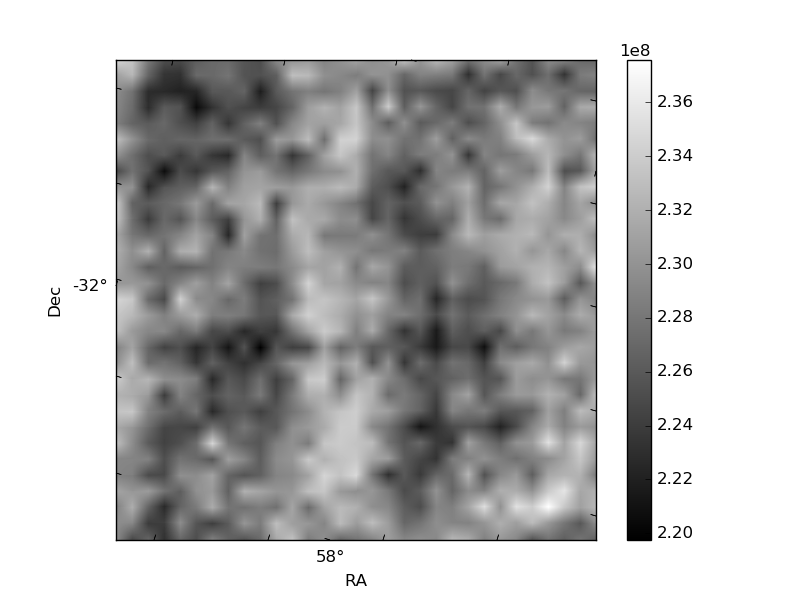
Quadrant C |
| Plot type | Count rate plots | Images |
|---|---|---|
| Comparison with Poisson distribution Blue bars denote a histogram of data divided into 1 sec bins. Red curve is a Poisson curve with rate = median count rate of data. |
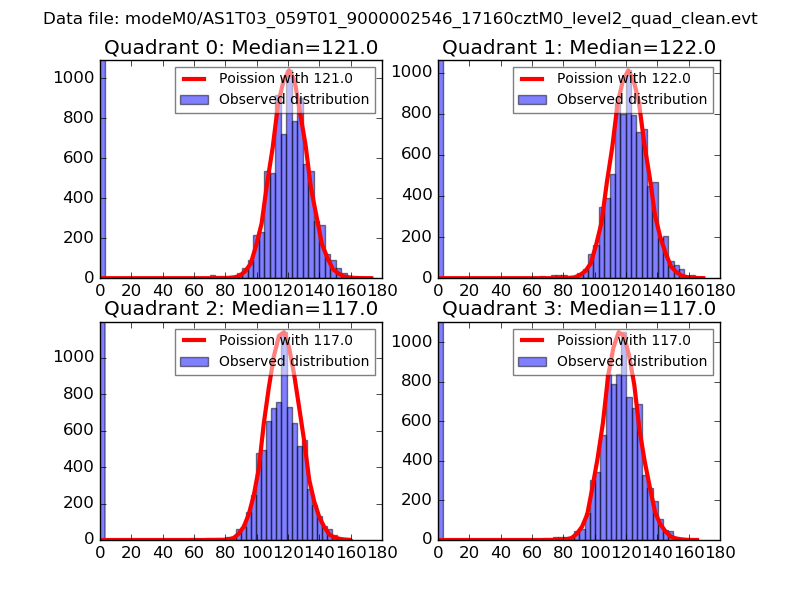 |
 |
| Quadrant-wise count rates Data is divided into 100 sec bins |
 |
|
| Module-wise count rates for Quadrant A Data is divided into 100 sec bins |
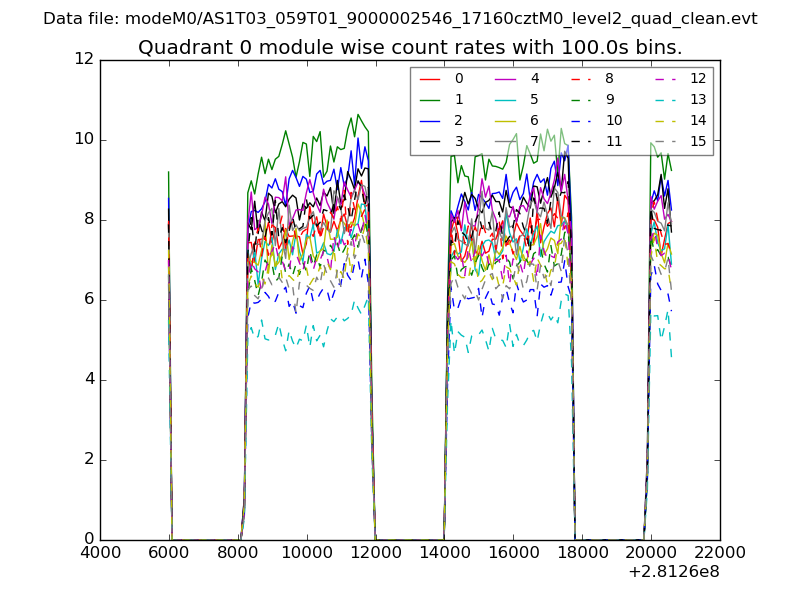 |
 |
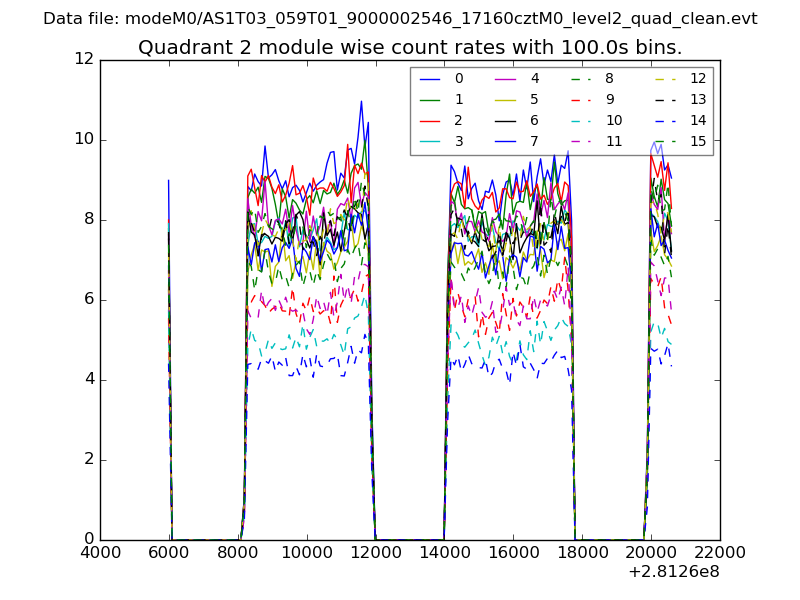
| Module-wise count rates for Quadrant B Data is divided into 100 sec bins |
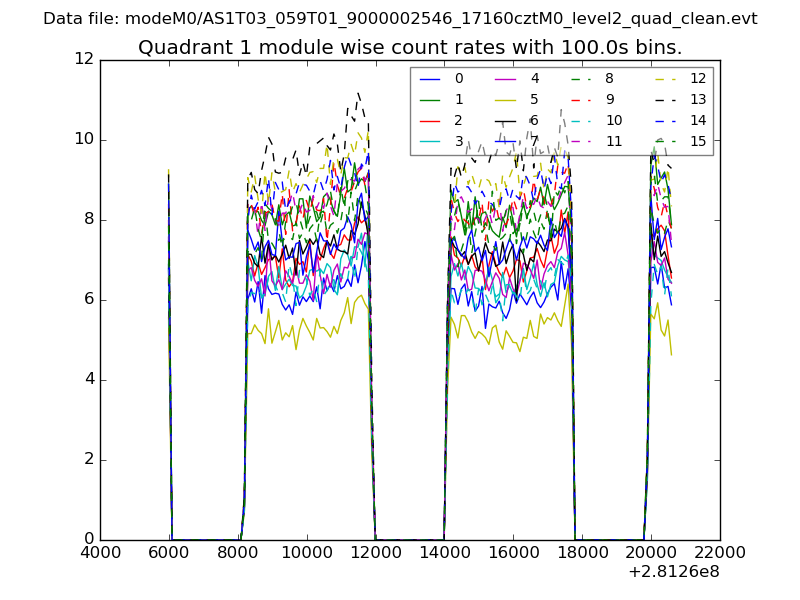 |
 |
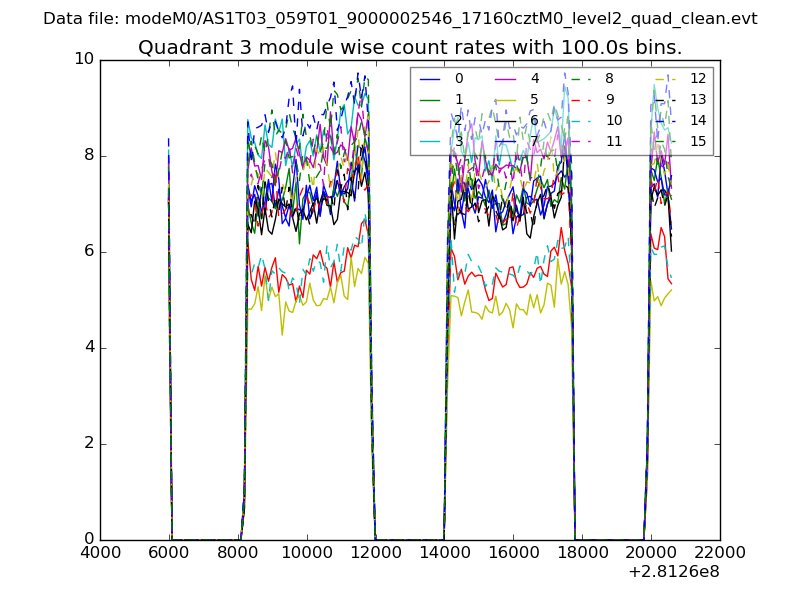
| Module-wise count rates for Quadrant C Data is divided into 100 sec bins |
 |
 |
| Module-wise count rates for Quadrant D Data is divided into 100 sec bins |
 |
 |
| Parameter | Plot |
|---|---|
| CZT HV Monitor | 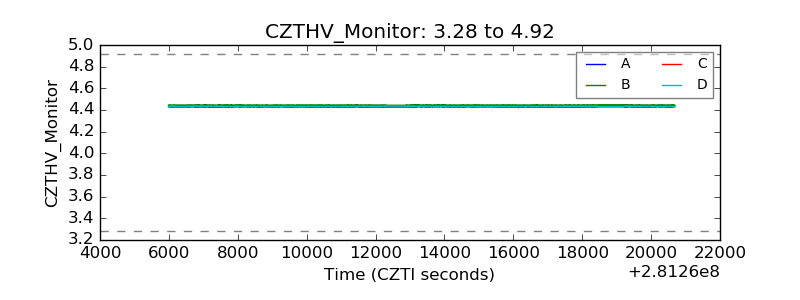 |
| D_VDD | 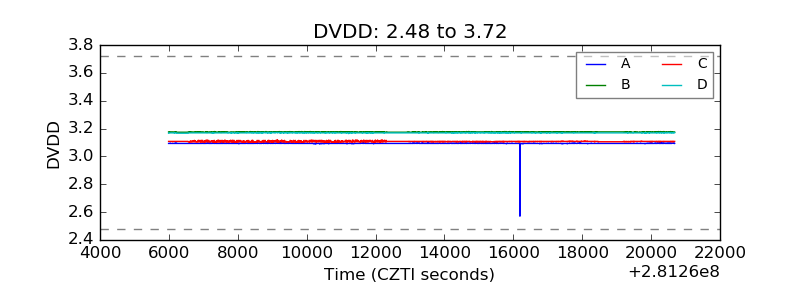 |
| Temperature 1 | 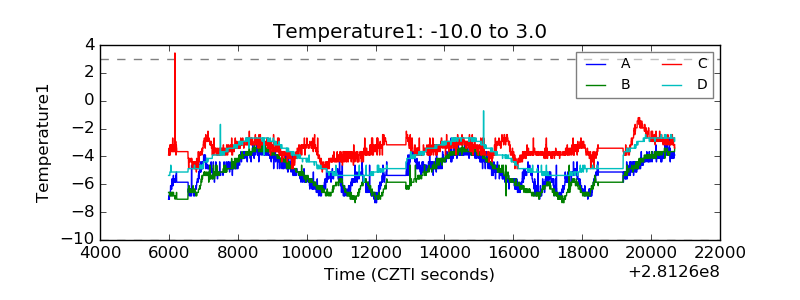 |
| Veto HV Monitor | 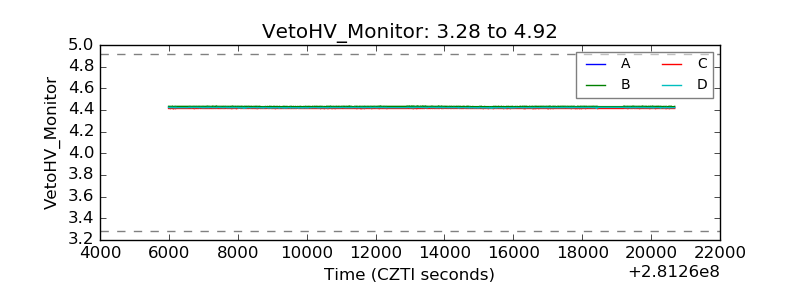 |
| Veto LLD | 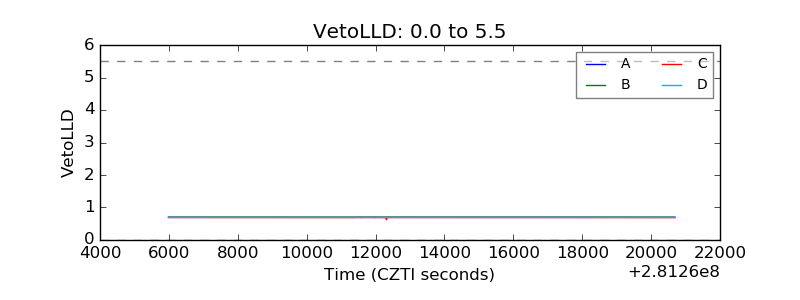 |
| Alpha Counter |  |
| _CPM_Rate | 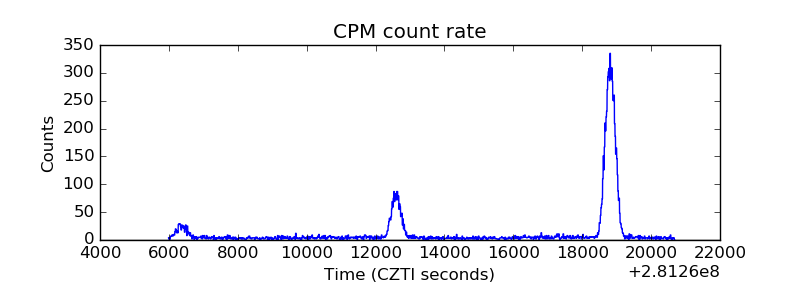 |
| CZT Counter |  |
| +2.5 Volts monitor |  |
| +5 Volts monitor |  |
| _ROLL_ROT | 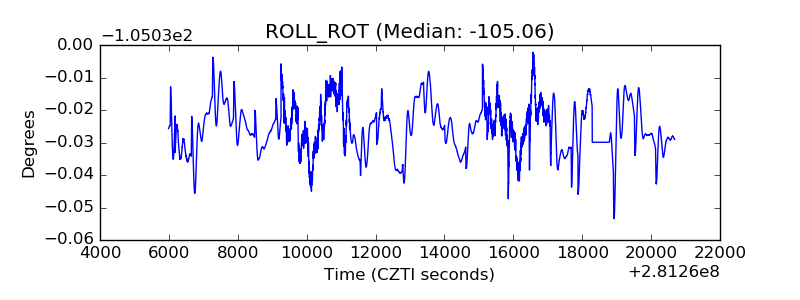 |
| _Roll_DEC | 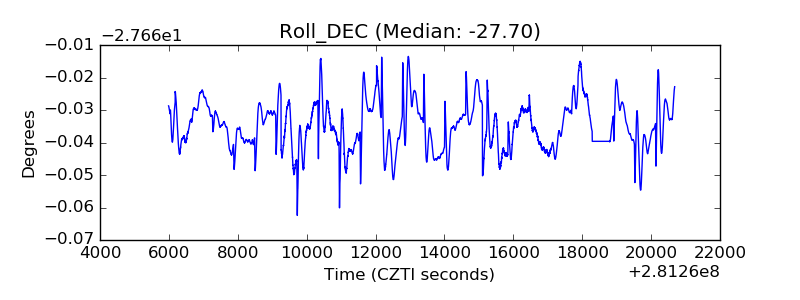 |
| _Roll_RA |  |
| Veto Counter | 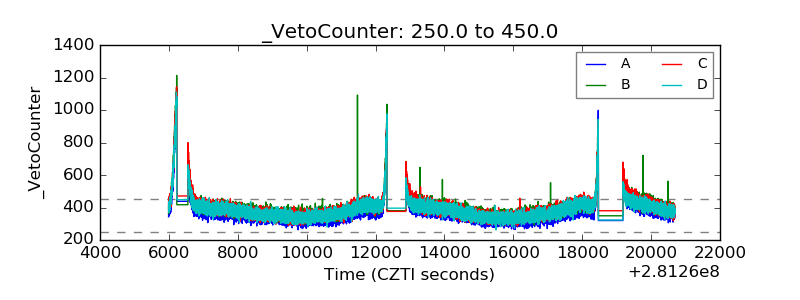 |