| Param | Original file | Final file |
|---|---|---|
| Filename | modeM0/AS1T03_059T01_9000002546_17167cztM0_level2.evt | modeM0/AS1T03_059T01_9000002546_17167cztM0_level2_quad_clean.evt |
| Size (bytes) | 447,096,960 | 92,361,600 |
| Size | 426.4 MB | 88.1 MB |
| Events in quadrant A | 3,075,428 | 599,538 |
| Events in quadrant B | 3,142,274 | 621,243 |
| Events in quadrant C | 3,614,726 | 579,710 |
| Events in quadrant D | 3,284,495 | 561,537 |
| Mode M0 | |||
|---|---|---|---|
| Quadrant | BADHDUFLAG | Total packets | Discarded packets |
| A | 0 | 13010 | 3 |
| B | 0 | 13069 | 3 |
| C | 0 | 14722 | 3 |
| D | 0 | 13865 | 3 |
| Mode M9 | |||
|---|---|---|---|
| Quadrant | BADHDUFLAG | Total packets | Discarded packets |
| A | 0 | 25 | 0 |
| B | 0 | 26 | 0 |
| C | 0 | 26 | 0 |
| D | 0 | 26 | 0 |
| Mode SS | |||
|---|---|---|---|
| Quadrant | BADHDUFLAG | Total packets | Discarded packets |
| A | 0 | 128 | 0 |
| B | 0 | 128 | 0 |
| C | 0 | 128 | 0 |
| D | 0 | 128 | 0 |
| Quadrant | Total seconds | Saturated seconds | Saturation percentage |
|---|---|---|---|
| A | 6227 | 43 | 0.690541% |
| B | 6227 | 60 | 0.963546% |
| C | 6227 | 79 | 1.268669% |
| D | 6227 | 51 | 0.819014% |
Noise dominated data is calculated using 1-second bins in cleaned event files. If a bin has >2000 counts, and if more than 50% of those come from <1% of pixels, then it is considered to be noise-dominated and hence unusable.
| Quadrant | # 1 sec bins | Bins with >0 counts | Bins with >2000 counts | High rate bins dominated by noise | Noise dominated (total time) | Noise dominated (detector-on time) | Marked lightcurve |
|---|---|---|---|---|---|---|---|
| A | 7572 | 6229 | 0 | 0 | 0.00% | 0.00% | 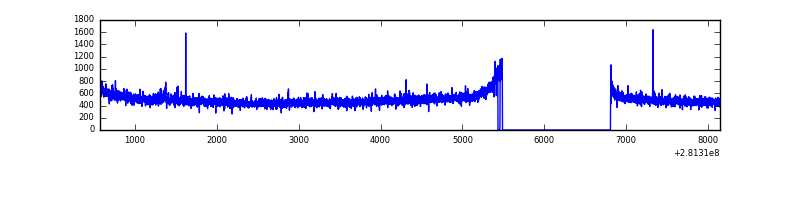 |
| B | 7572 | 6229 | 0 | 0 | 0.00% | 0.00% | 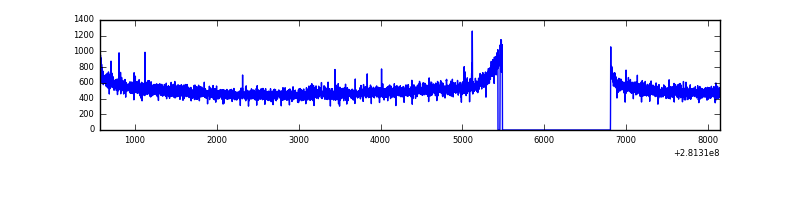 |
| C | 7572 | 6229 | 0 | 0 | 0.00% | 0.00% | 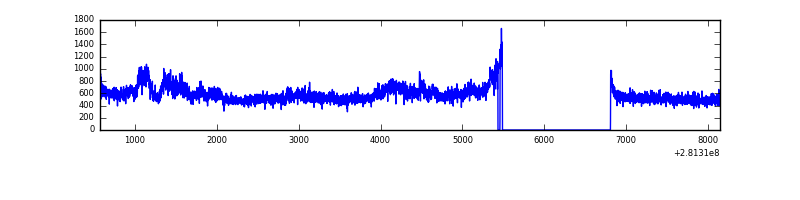 |
| D | 7572 | 6229 | 34 | 34 | 0.45% | 0.55% | 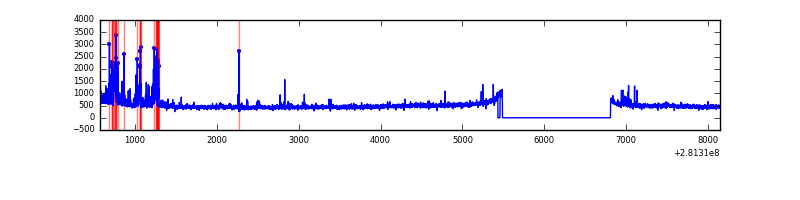 |
Top three noisy pixels from each quadrant. If the there are fewer than three noisy pixels in the level2.evt file, extra rows are filled as -1
| Pixel properties | Quadrant properties | ||||||
|---|---|---|---|---|---|---|---|
| Quadrant | DetID | PixID | Counts | Sigma | Mean | Median | Sigma |
| A | 12 | 189 | 21316 | 128.98 | 793 | 778 | 159.2 |
| A | 4 | 2 | 9834 | 56.87 | 793 | 778 | 159.2 |
| A | 0 | 226 | 6850 | 38.13 | 793 | 778 | 159.2 |
| B | 12 | 111 | 18228 | 115.4 | 804 | 786 | 151.1 |
| B | 11 | 111 | 15575 | 97.85 | 804 | 786 | 151.1 |
| B | 14 | 111 | 14034 | 87.65 | 804 | 786 | 151.1 |
| C | 3 | 233 | 488871 | 2730.41 | 768 | 775 | 178.8 |
| C | 14 | 238 | 119506 | 664.18 | 768 | 775 | 178.8 |
| C | 4 | 254 | 9779 | 50.37 | 768 | 775 | 178.8 |
| D | 5 | 222 | 316328 | 1701.02 | 769 | 750 | 185.5 |
| D | 2 | 152 | 32563 | 171.48 | 769 | 750 | 185.5 |
| D | 2 | 234 | 20591 | 106.95 | 769 | 750 | 185.5 |
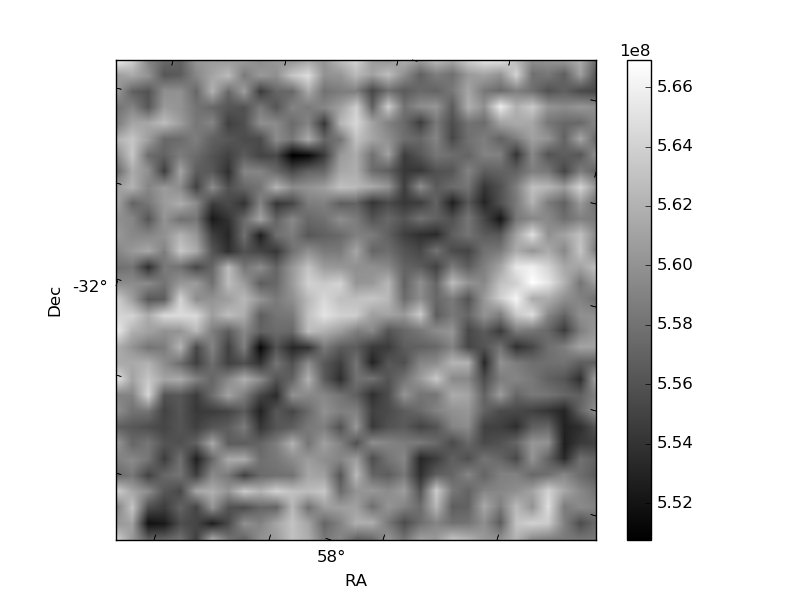
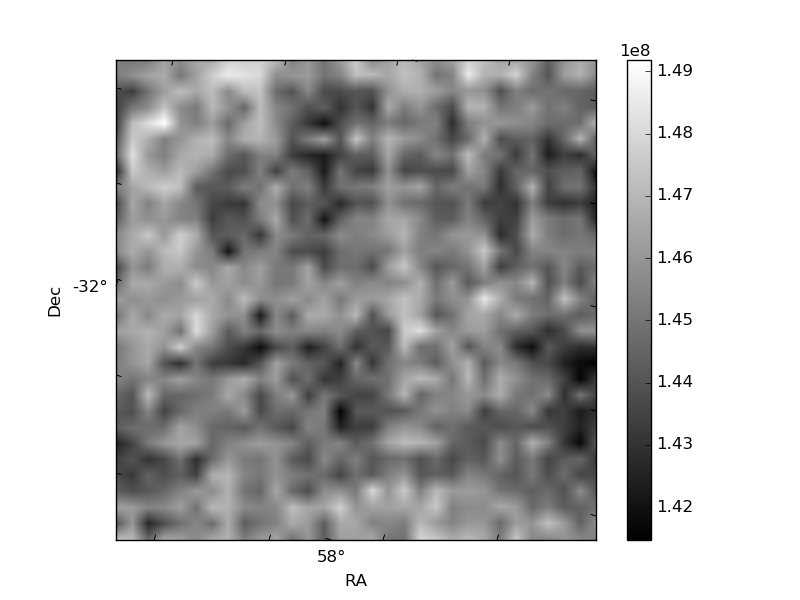
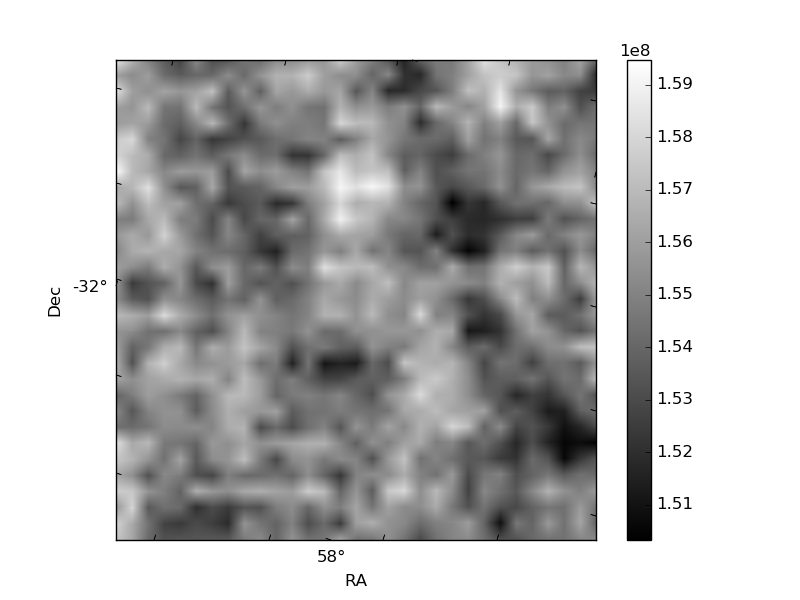
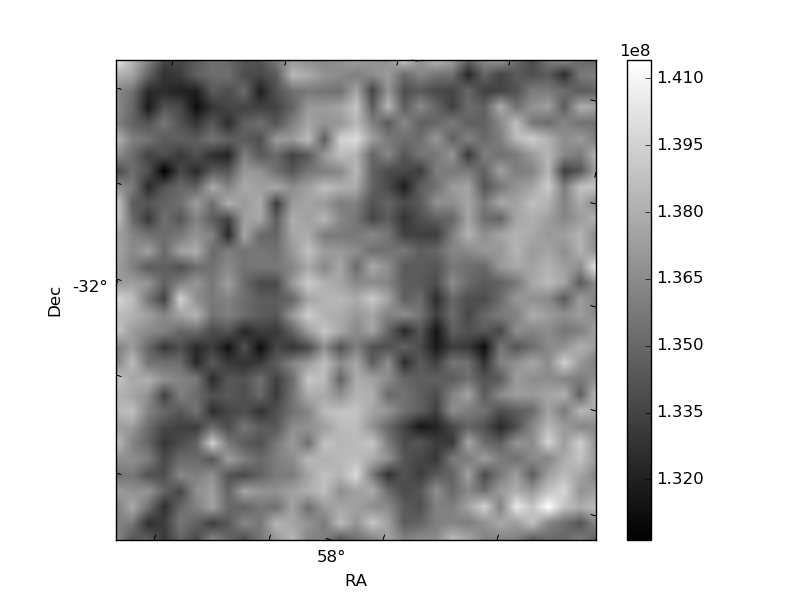
Histogram calculated using DETX and DETY for each event in the final _common_clean file
| Quadrant A | 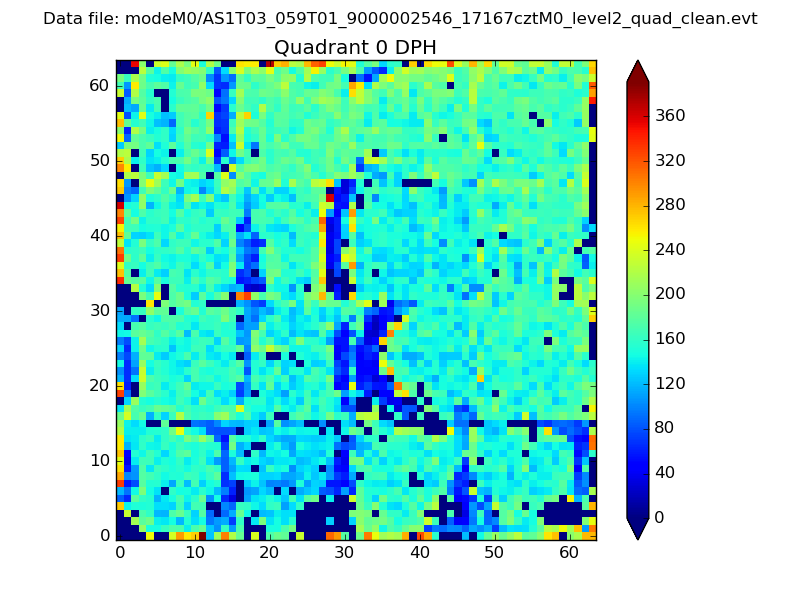 |
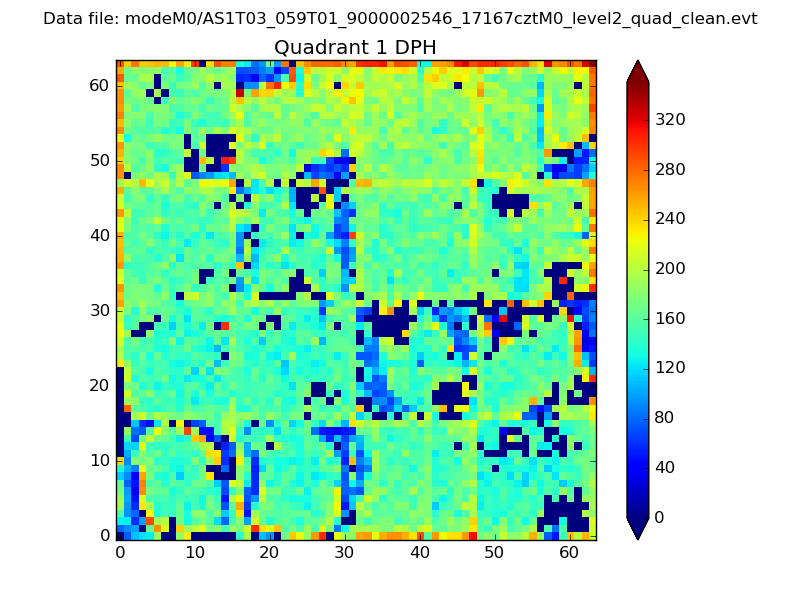 |
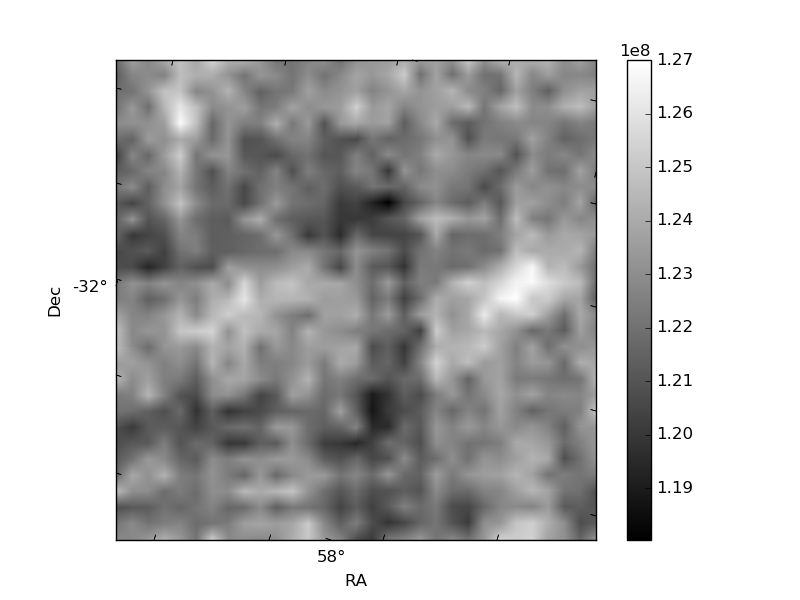
Quadrant B |
|---|---|---|---|
| Quadrant D | 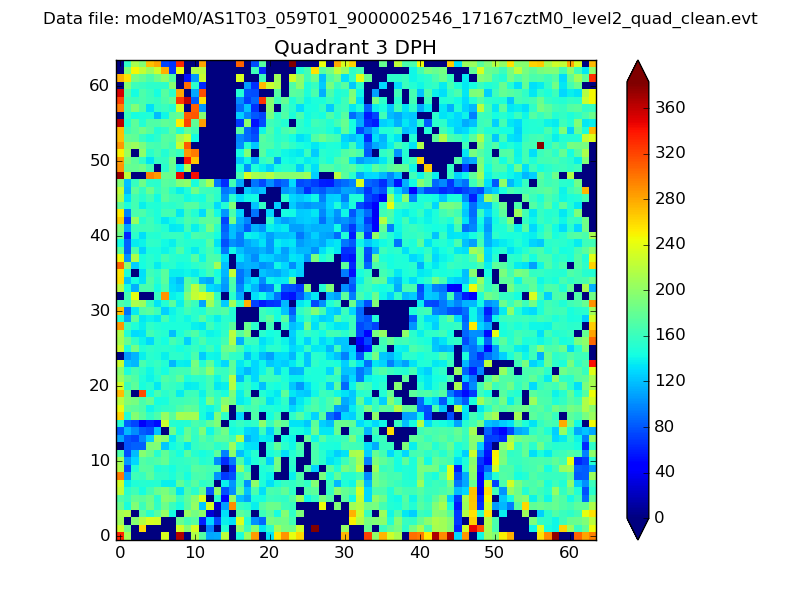 |
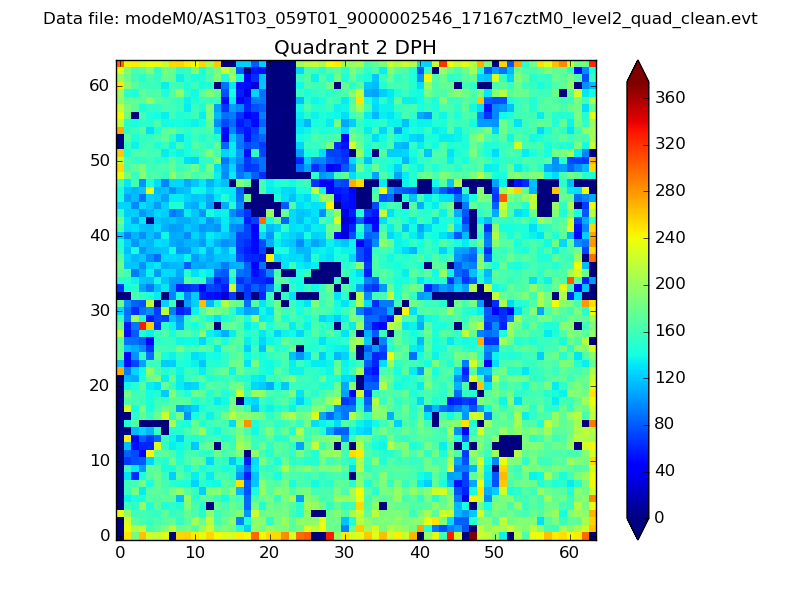 |
Quadrant C |
| Plot type | Count rate plots | Images |
|---|---|---|
| Comparison with Poisson distribution Blue bars denote a histogram of data divided into 1 sec bins. Red curve is a Poisson curve with rate = median count rate of data. |
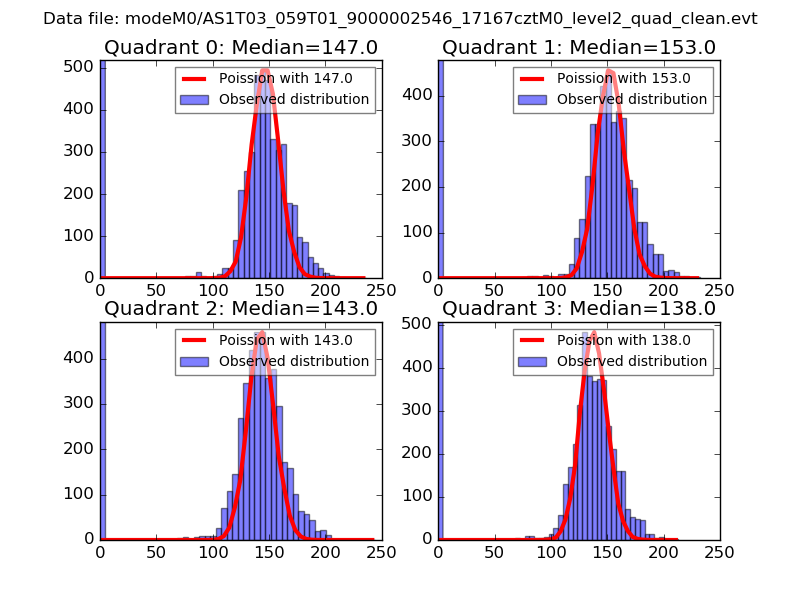 |
 |
| Quadrant-wise count rates Data is divided into 100 sec bins |
 |
|
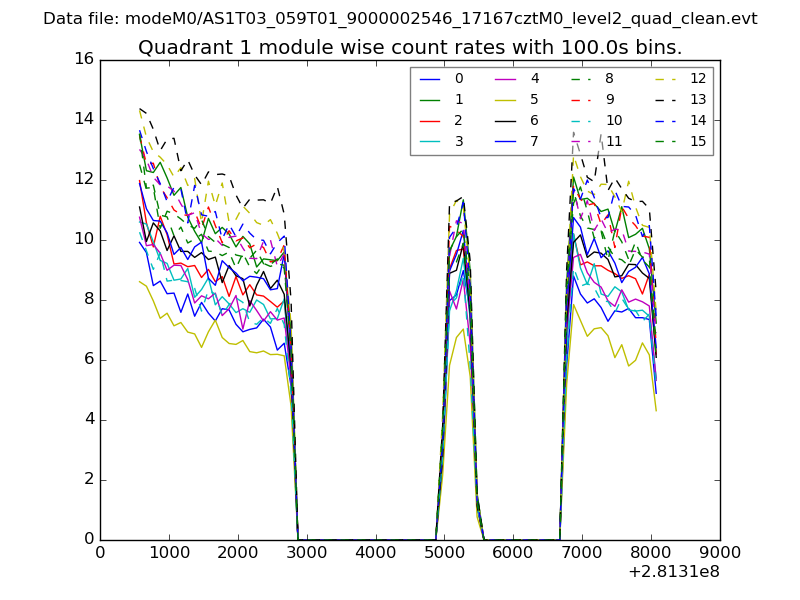
| Module-wise count rates for Quadrant A Data is divided into 100 sec bins |
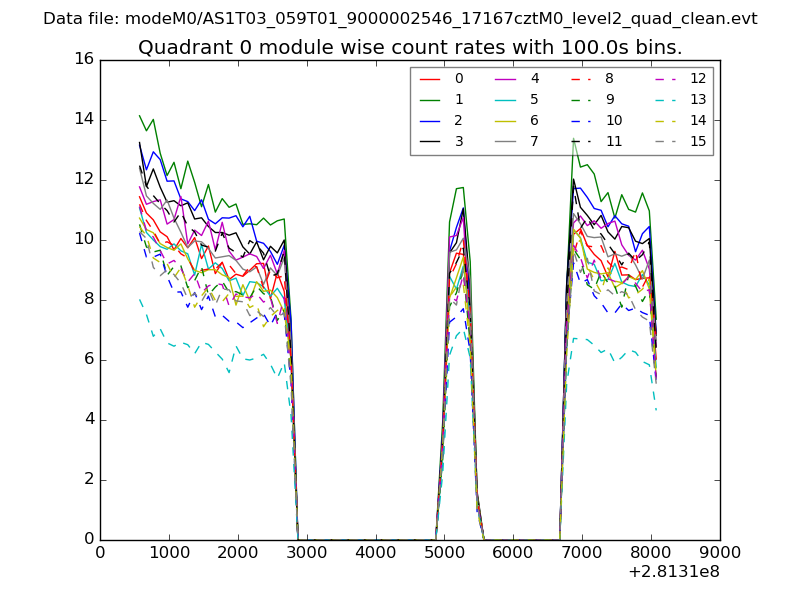 |
 |
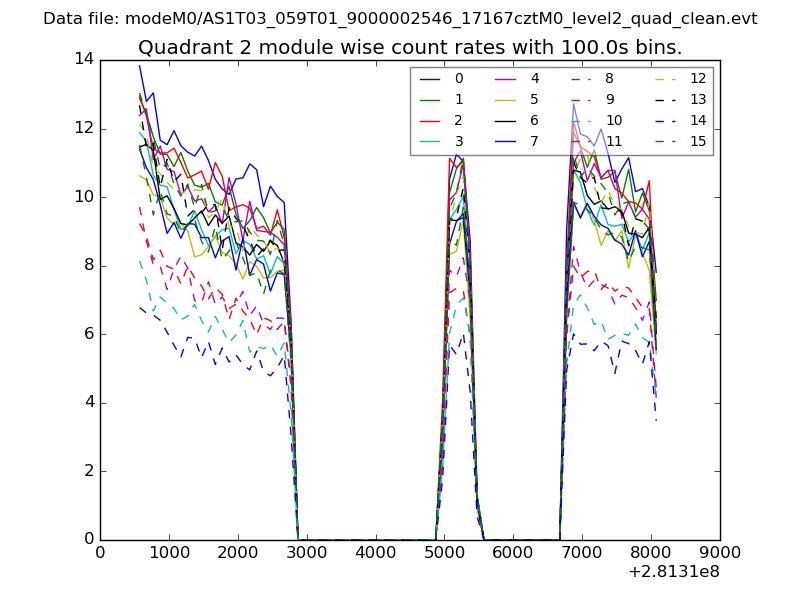
| Module-wise count rates for Quadrant B Data is divided into 100 sec bins |
 |
 |
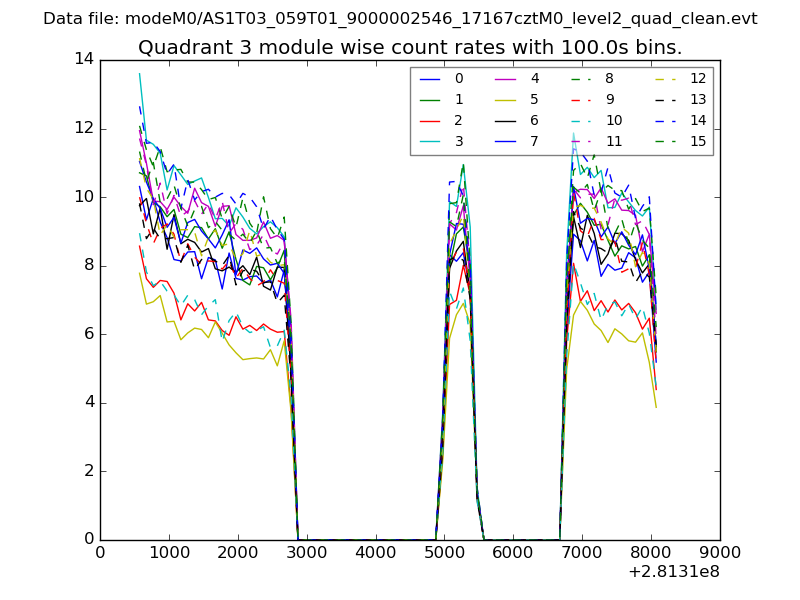
| Module-wise count rates for Quadrant C Data is divided into 100 sec bins |
 |
 |
| Module-wise count rates for Quadrant D Data is divided into 100 sec bins |
 |
 |
| Parameter | Plot |
|---|---|
| CZT HV Monitor | 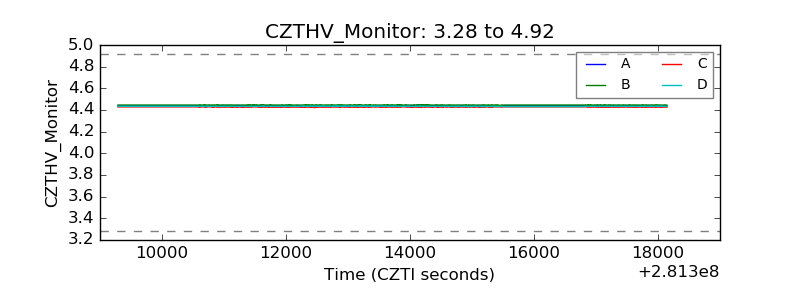 |
| D_VDD | 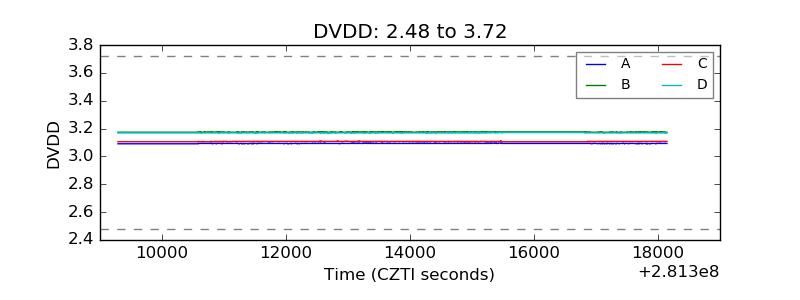 |
| Temperature 1 | 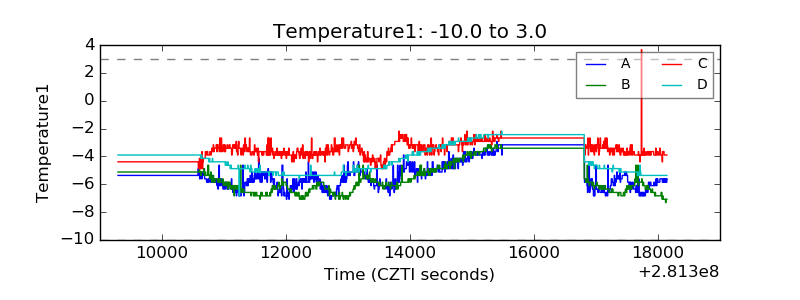 |
| Veto HV Monitor | 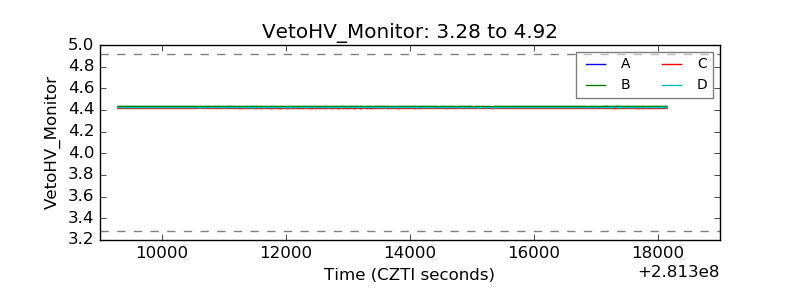 |
| Veto LLD | 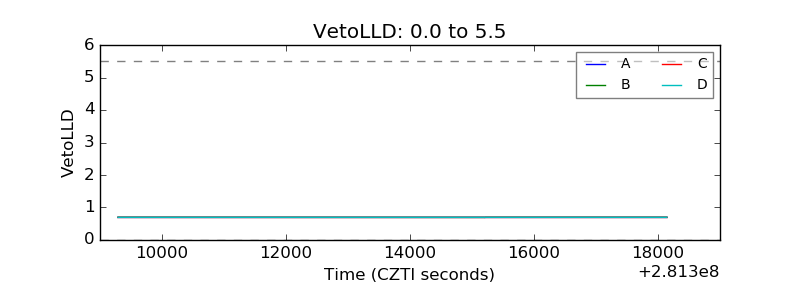 |
| Alpha Counter |  |
| _CPM_Rate |  |
| CZT Counter | 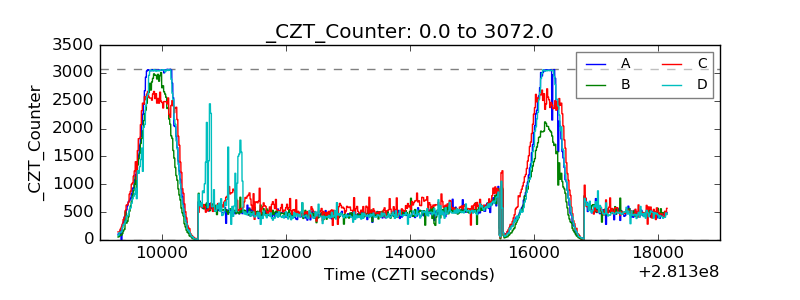 |
| +2.5 Volts monitor |  |
| +5 Volts monitor |  |
| _ROLL_ROT | 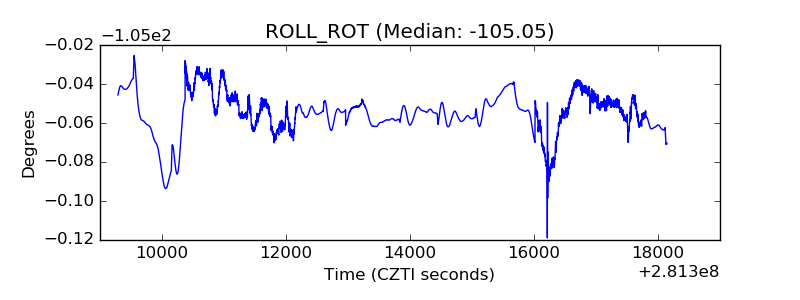 |
| _Roll_DEC | 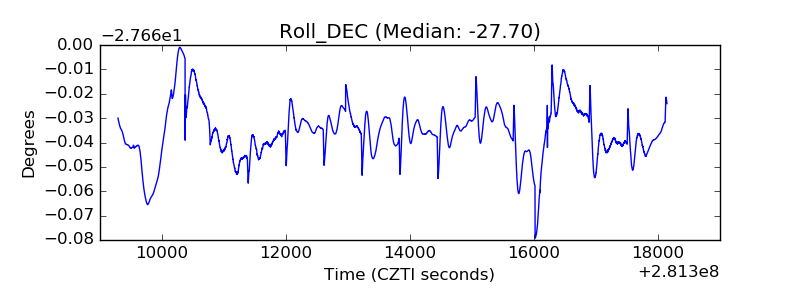 |
| _Roll_RA | 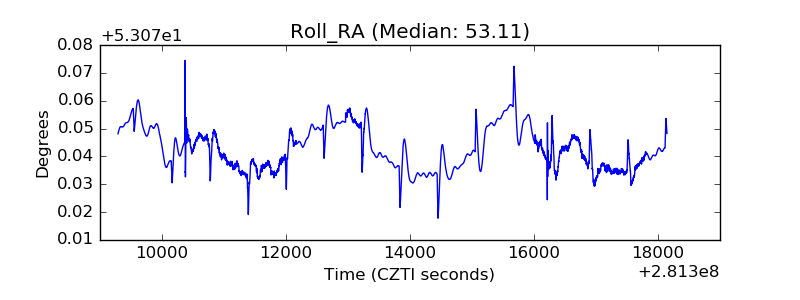 |
| Veto Counter | 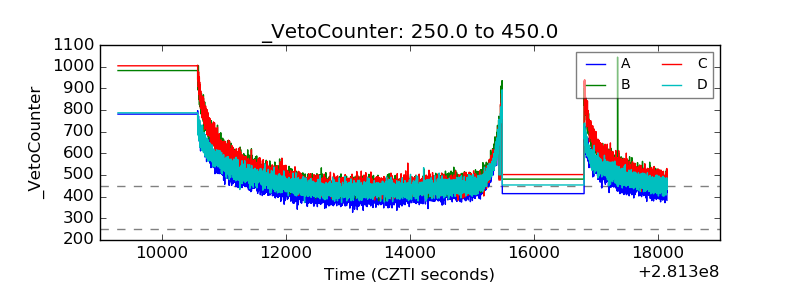 |