| Param | Original file | Final file |
|---|---|---|
| Filename | modeM0/AS1A05_185T04_9000002548cztM0_level2.fits | modeM0/AS1A05_185T04_9000002548cztM0_level2_quad_clean.evt |
| Size (bytes) | 3,103,099,200 | 2,809,002,240 |
| Size | 2.9 GB | 2.6 GB |
| Events in quadrant A | 19,002,882 | 16,601,413 |
| Events in quadrant B | 18,214,834 | 16,377,519 |
| Events in quadrant C | 18,312,120 | 15,419,429 |
| Events in quadrant D | 16,048,090 | 14,276,541 |
| Mode SS | |||
|---|---|---|---|
| Quadrant | BADHDUFLAG | Total packets | Discarded packets |
| A | 0 | 6672 | 0 |
| B | 0 | 6672 | 0 |
| C | 0 | 6672 | 0 |
| D | 0 | 6672 | 0 |
| Mode M9 | |||
|---|---|---|---|
| Quadrant | BADHDUFLAG | Total packets | Discarded packets |
| A | 0 | 509 | 0 |
| B | 0 | 509 | 0 |
| C | 0 | 509 | 0 |
| D | 0 | 509 | 0 |
| Mode M0 | |||
|---|---|---|---|
| Quadrant | BADHDUFLAG | Total packets | Discarded packets |
| A | 0 | 675916 | 0 |
| B | 0 | 694493 | 0 |
| C | 0 | 743076 | 0 |
| D | 0 | 786042 | 0 |
| Quadrant | Total seconds | Saturated seconds | Saturation percentage |
|---|---|---|---|
| A | 327001 | 3414 | 1.044034% |
| B | 327001 | 4686 | 1.433023% |
| C | 327000 | 6313 | 1.930581% |
| D | 327000 | 9488 | 2.901529% |
Noise dominated data is calculated using 1-second bins in cleaned event files. If a bin has >2000 counts, and if more than 50% of those come from <1% of pixels, then it is considered to be noise-dominated and hence unusable.
| Quadrant | # 1 sec bins | Bins with >0 counts | Bins with >2000 counts | High rate bins dominated by noise | Noise dominated (total time) | Noise dominated (detector-on time) | Marked lightcurve |
|---|---|---|---|---|---|---|---|
| A | 378427 | 326988 | 0 | 0 | 0.00% | 0.00% |  |
| B | 378427 | 326984 | 0 | 0 | 0.00% | 0.00% |  |
| C | 378426 | 326977 | 0 | 0 | 0.00% | 0.00% |  |
| D | 378426 | 326920 | 0 | 0 | 0.00% | 0.00% |  |
Top three noisy pixels from each quadrant. If the there are fewer than three noisy pixels in the level2.evt file, extra rows are filled as -1
| Pixel properties | Quadrant properties | ||||||
|---|---|---|---|---|---|---|---|
| Quadrant | DetID | PixID | Counts | Sigma | Mean | Median | Sigma |
| A | 0 | 29 | 17863 | 10.94 | 4939 | 4623 | 1210.4 |
| A | 7 | 110 | 15681 | 9.14 | 4939 | 4623 | 1210.4 |
| A | 0 | 30 | 14466 | 8.13 | 4939 | 4623 | 1210.4 |
| B | 2 | 9 | 14817 | 10.93 | 4816 | 4585 | 936.3 |
| B | 2 | 8 | 12682 | 8.65 | 4816 | 4585 | 936.3 |
| B | 3 | 17 | 11994 | 7.91 | 4816 | 4585 | 936.3 |
| C | 12 | 241 | 12810 | 6.69 | 4841 | 4495 | 1242.0 |
| C | 3 | 126 | 12566 | 6.5 | 4841 | 4495 | 1242.0 |
| C | 2 | 191 | 12265 | 6.26 | 4841 | 4495 | 1242.0 |
| D | 3 | 14 | 12032 | 6.41 | 4583 | 4157 | 1229.4 |
| D | 6 | 231 | 11446 | 5.93 | 4583 | 4157 | 1229.4 |
| D | 7 | 3 | 11255 | 5.77 | 4583 | 4157 | 1229.4 |
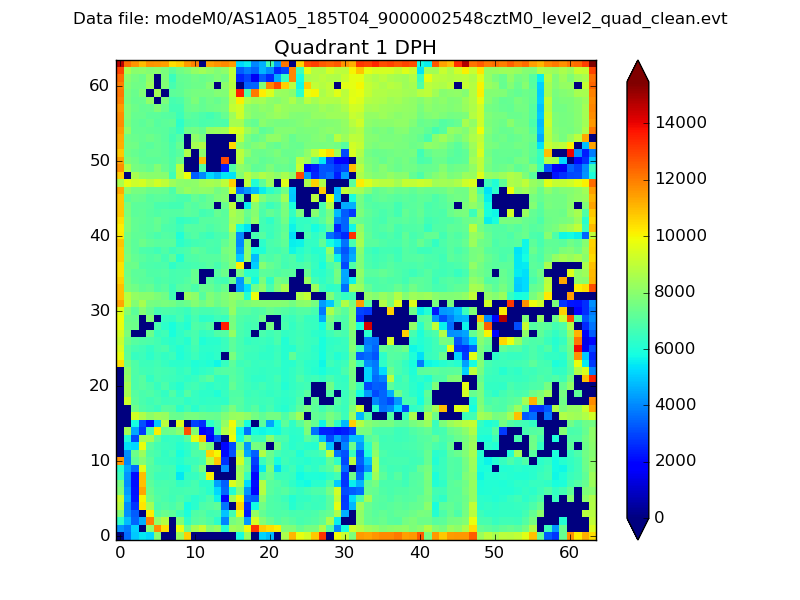
Histogram calculated using DETX and DETY for each event in the final _common_clean file
| Quadrant A |  |
 |
Quadrant B |
|---|---|---|---|
| Quadrant D |  |
 |
Quadrant C |
| Plot type | Count rate plots | Images |
|---|---|---|
| Comparison with Poisson distribution Blue bars denote a histogram of data divided into 1 sec bins. Red curve is a Poisson curve with rate = median count rate of data. |
 |
 |
| Quadrant-wise count rates Data is divided into 100 sec bins |
 |
|
| Module-wise count rates for Quadrant A Data is divided into 100 sec bins |
 |
 |
| Module-wise count rates for Quadrant B Data is divided into 100 sec bins |
 |
 |
| Module-wise count rates for Quadrant C Data is divided into 100 sec bins |
 |
 |
| Module-wise count rates for Quadrant D Data is divided into 100 sec bins |
 |
 |
| Parameter | Plot |
|---|---|
| CZT HV Monitor |  |
| D_VDD |  |
| Temperature 1 | 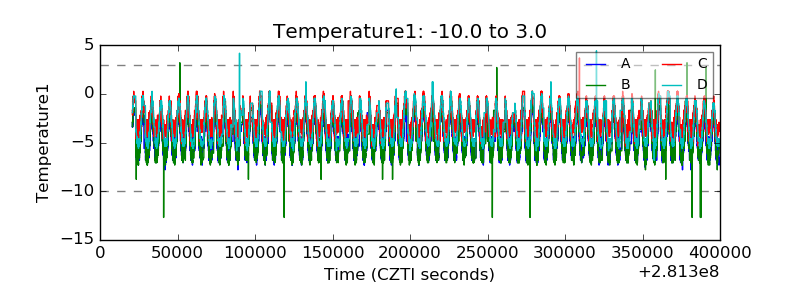 |
| Veto HV Monitor |  |
| Veto LLD |  |
| Alpha Counter |  |
| _CPM_Rate |  |
| CZT Counter |  |
| +2.5 Volts monitor |  |
| +5 Volts monitor |  |
| _ROLL_ROT |  |
| _Roll_DEC | 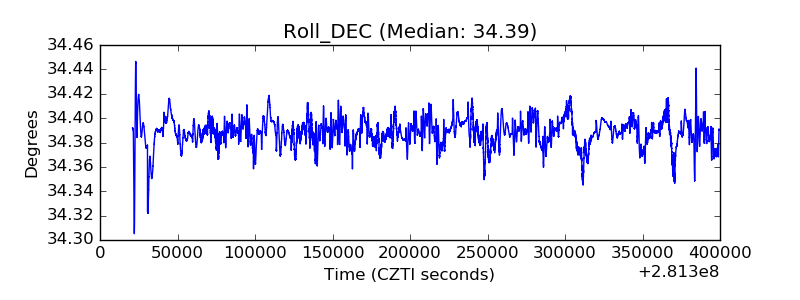 |
| _Roll_RA |  |
| Veto Counter |  |