| Param | Original file | Final file |
|---|---|---|
| Filename | modeM0/AS1A05_185T04_9000002548_17168cztM0_level2.evt | modeM0/AS1A05_185T04_9000002548_17168cztM0_level2_quad_clean.evt |
| Size (bytes) | 165,211,200 | 40,694,400 |
| Size | 157.6 MB | 38.8 MB |
| Events in quadrant A | 1,108,062 | 273,783 |
| Events in quadrant B | 1,156,021 | 279,600 |
| Events in quadrant C | 1,224,839 | 264,362 |
| Events in quadrant D | 1,364,623 | 257,135 |
| Mode SS | |||
|---|---|---|---|
| Quadrant | BADHDUFLAG | Total packets | Discarded packets |
| A | 0 | 46 | 0 |
| B | 0 | 46 | 0 |
| C | 0 | 46 | 0 |
| D | 0 | 46 | 0 |
| Mode M9 | |||
|---|---|---|---|
| Quadrant | BADHDUFLAG | Total packets | Discarded packets |
| A | 0 | 13 | 0 |
| B | 0 | 13 | 0 |
| C | 0 | 13 | 0 |
| D | 0 | 13 | 0 |
| Mode M0 | |||
|---|---|---|---|
| Quadrant | BADHDUFLAG | Total packets | Discarded packets |
| A | 0 | 4661 | 1 |
| B | 0 | 4791 | 1 |
| C | 0 | 5013 | 1 |
| D | 0 | 5495 | 2 |
| Quadrant | Total seconds | Saturated seconds | Saturation percentage |
|---|---|---|---|
| A | 2176 | 10 | 0.459559% |
| B | 2176 | 17 | 0.781250% |
| C | 2176 | 37 | 1.700368% |
| D | 2175 | 49 | 2.252874% |
Noise dominated data is calculated using 1-second bins in cleaned event files. If a bin has >2000 counts, and if more than 50% of those come from <1% of pixels, then it is considered to be noise-dominated and hence unusable.
| Quadrant | # 1 sec bins | Bins with >0 counts | Bins with >2000 counts | High rate bins dominated by noise | Noise dominated (total time) | Noise dominated (detector-on time) | Marked lightcurve |
|---|---|---|---|---|---|---|---|
| A | 3431 | 2178 | 0 | 0 | 0.00% | 0.00% |  |
| B | 3431 | 2178 | 0 | 0 | 0.00% | 0.00% | 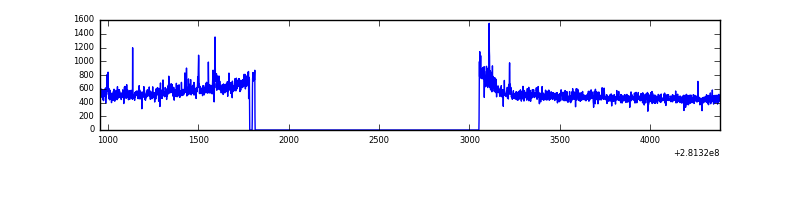 |
| C | 3431 | 2178 | 0 | 0 | 0.00% | 0.00% | 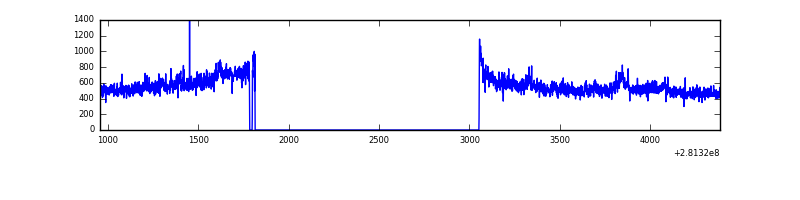 |
| D | 3430 | 2177 | 25 | 25 | 0.73% | 1.15% | 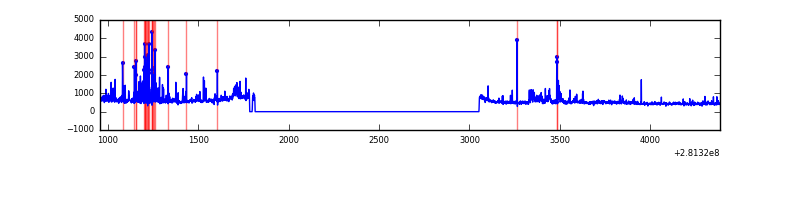 |
Top three noisy pixels from each quadrant. If the there are fewer than three noisy pixels in the level2.evt file, extra rows are filled as -1
| Pixel properties | Quadrant properties | ||||||
|---|---|---|---|---|---|---|---|
| Quadrant | DetID | PixID | Counts | Sigma | Mean | Median | Sigma |
| A | 12 | 189 | 14083 | 233.83 | 283 | 276 | 59.0 |
| A | 12 | 96 | 4944 | 79.06 | 283 | 276 | 59.0 |
| A | 0 | 226 | 2395 | 35.89 | 283 | 276 | 59.0 |
| B | 0 | 229 | 12351 | 212.49 | 285 | 277 | 56.8 |
| B | 0 | 197 | 7464 | 126.48 | 285 | 277 | 56.8 |
| B | 12 | 111 | 6370 | 107.23 | 285 | 277 | 56.8 |
| C | 3 | 233 | 107386 | 1629.89 | 274 | 275 | 65.7 |
| C | 14 | 238 | 41387 | 625.59 | 274 | 275 | 65.7 |
| C | 4 | 254 | 3271 | 45.59 | 274 | 275 | 65.7 |
| D | 5 | 222 | 280607 | 4149.75 | 275 | 267 | 67.6 |
| D | 10 | 70 | 16792 | 244.61 | 275 | 267 | 67.6 |
| D | 2 | 152 | 9244 | 132.88 | 275 | 267 | 67.6 |
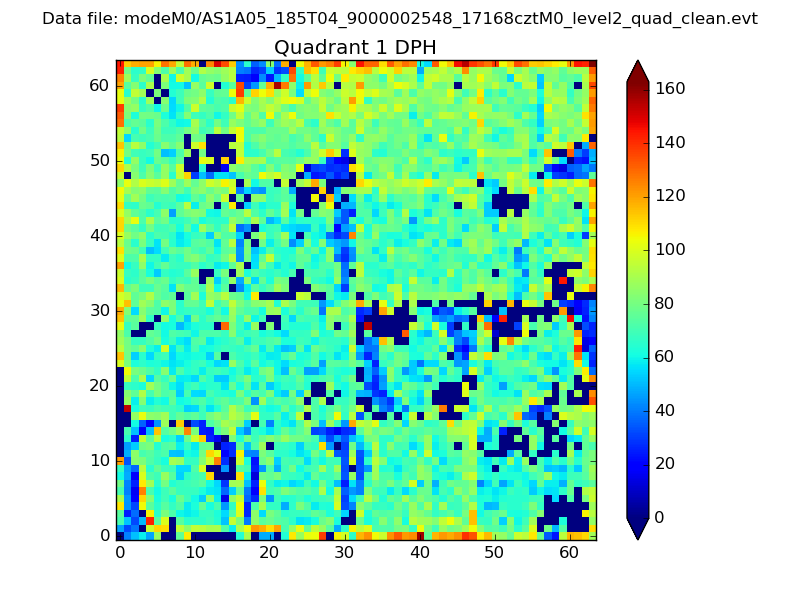
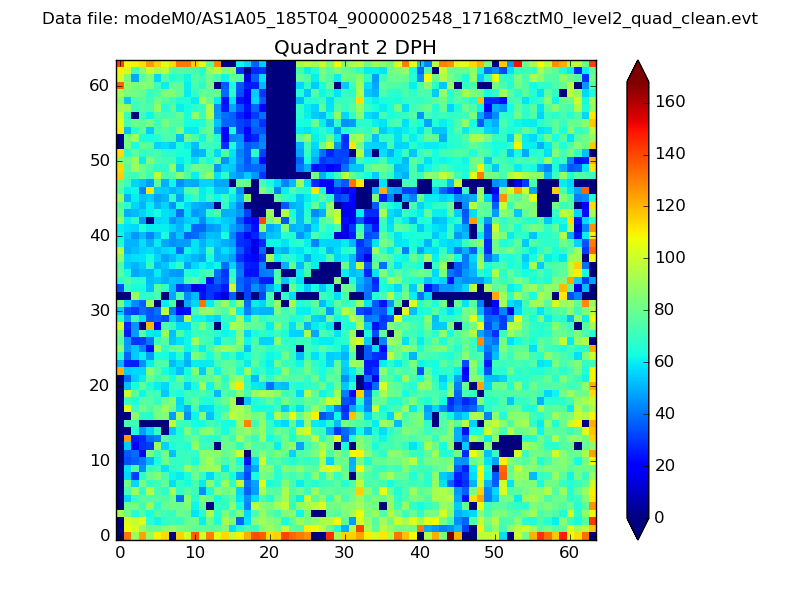
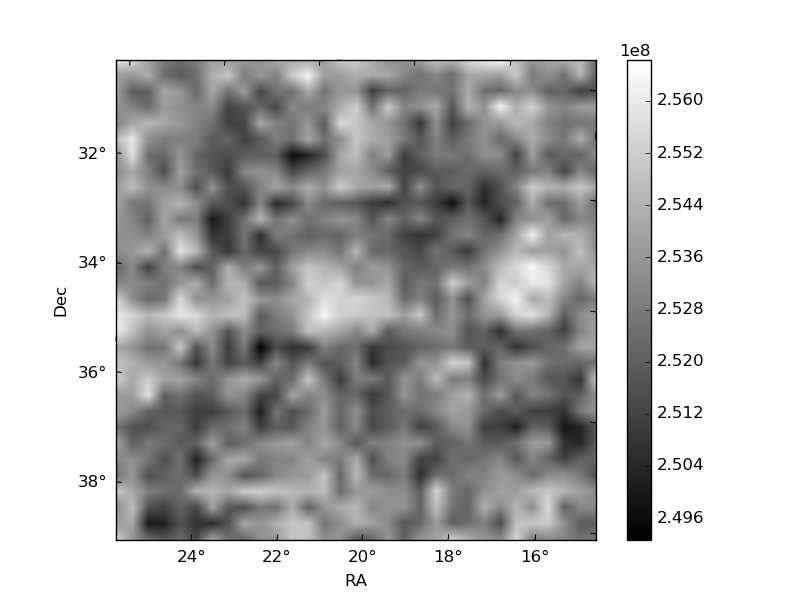
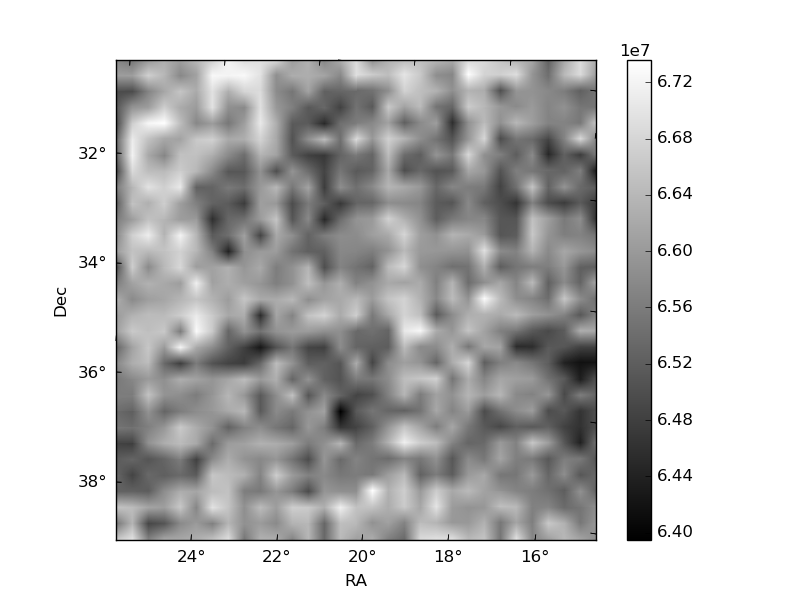
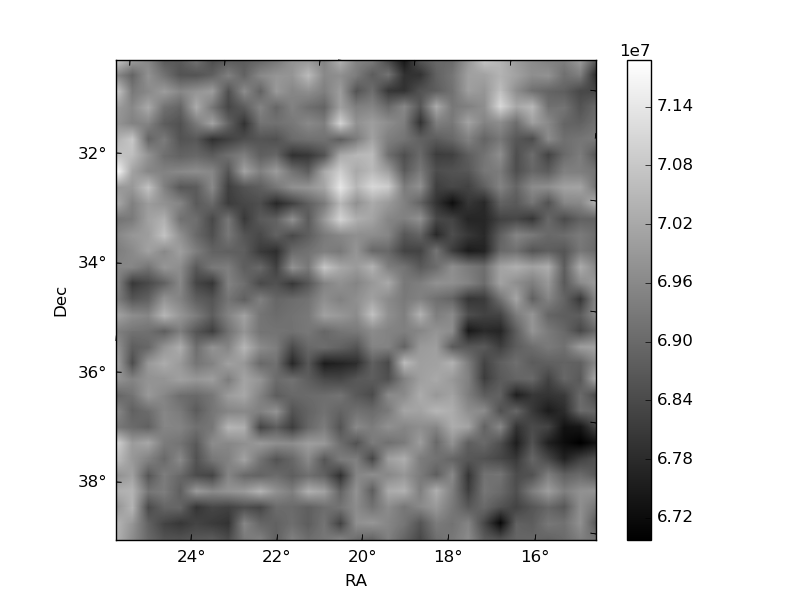
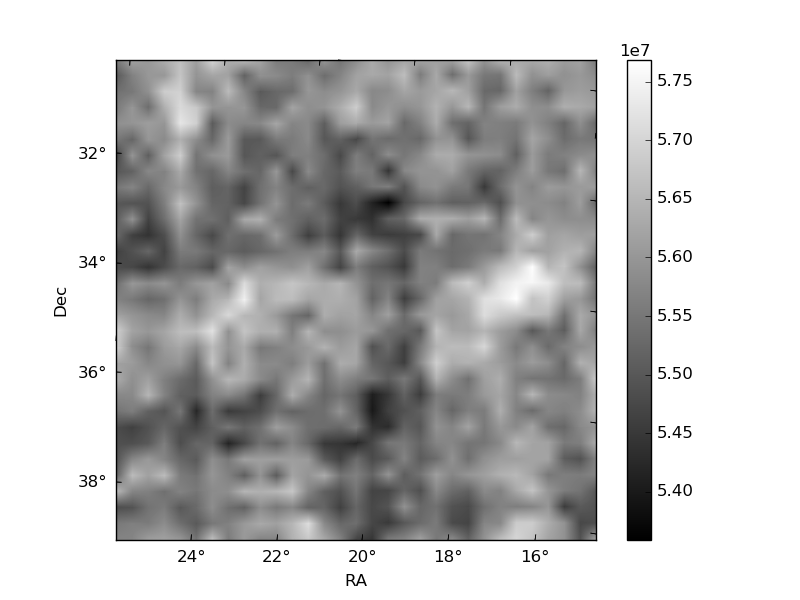
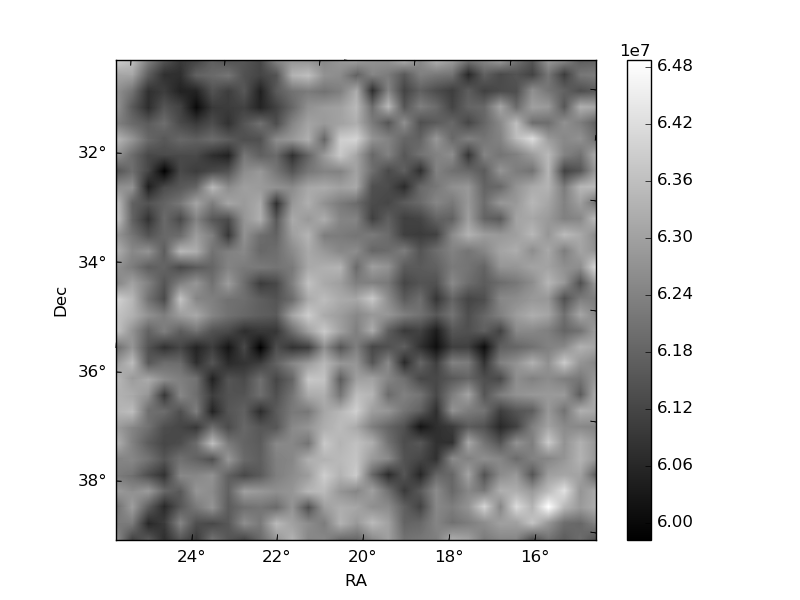
Histogram calculated using DETX and DETY for each event in the final _common_clean file
| Quadrant A | 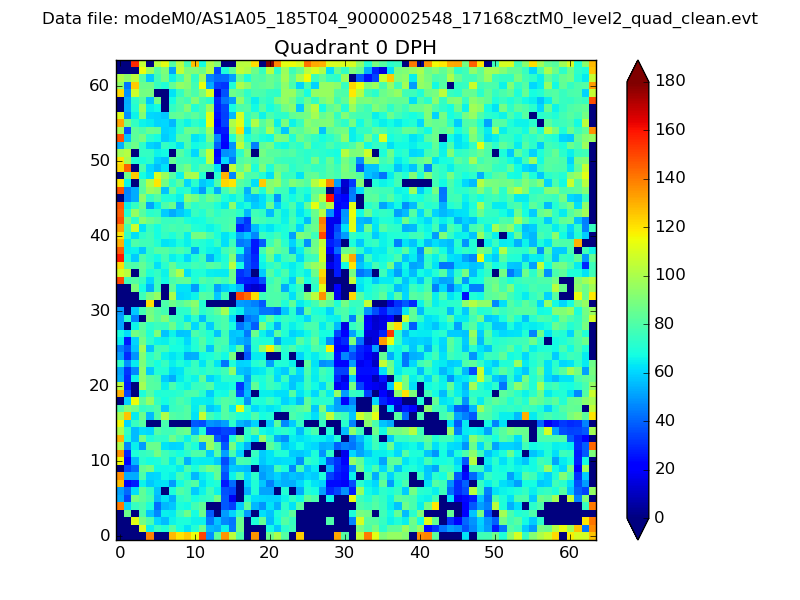 |
 |
Quadrant B |
|---|---|---|---|
| Quadrant D | 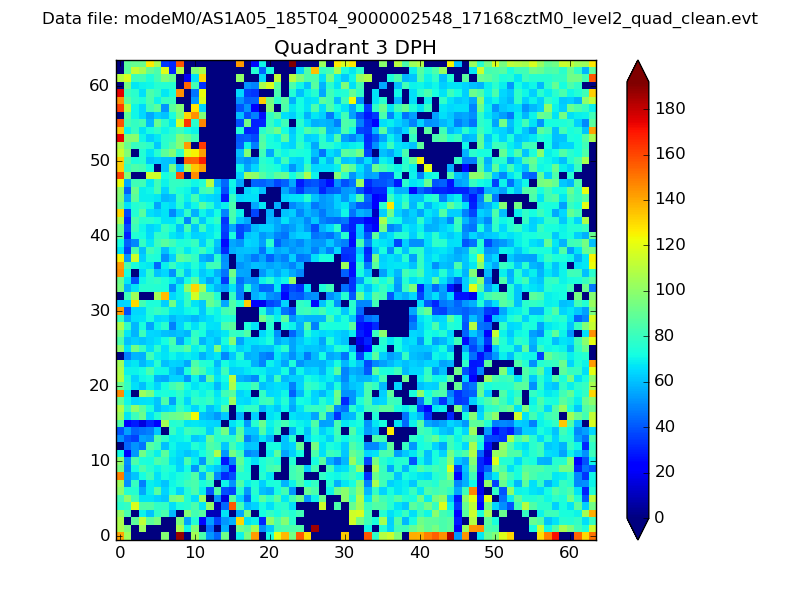 |
 |
Quadrant C |
| Plot type | Count rate plots | Images |
|---|---|---|
| Comparison with Poisson distribution Blue bars denote a histogram of data divided into 1 sec bins. Red curve is a Poisson curve with rate = median count rate of data. |
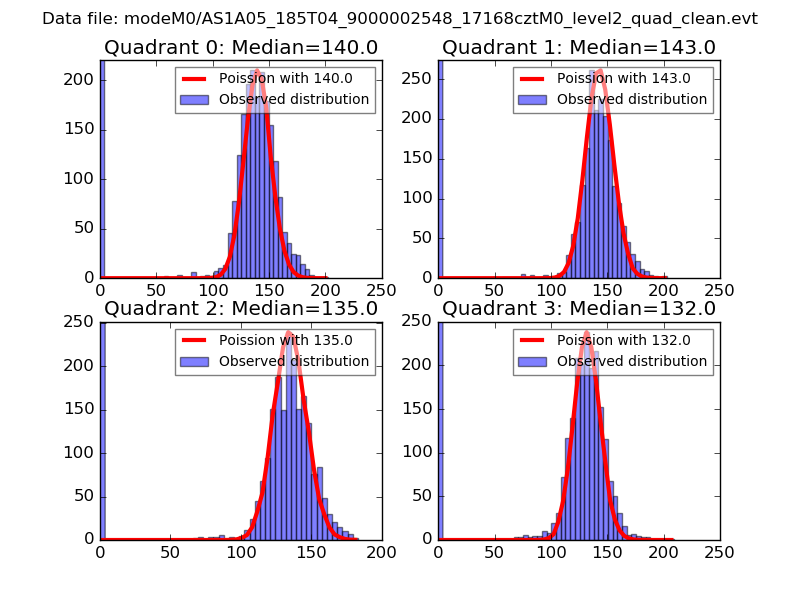 |
 |
| Quadrant-wise count rates Data is divided into 100 sec bins |
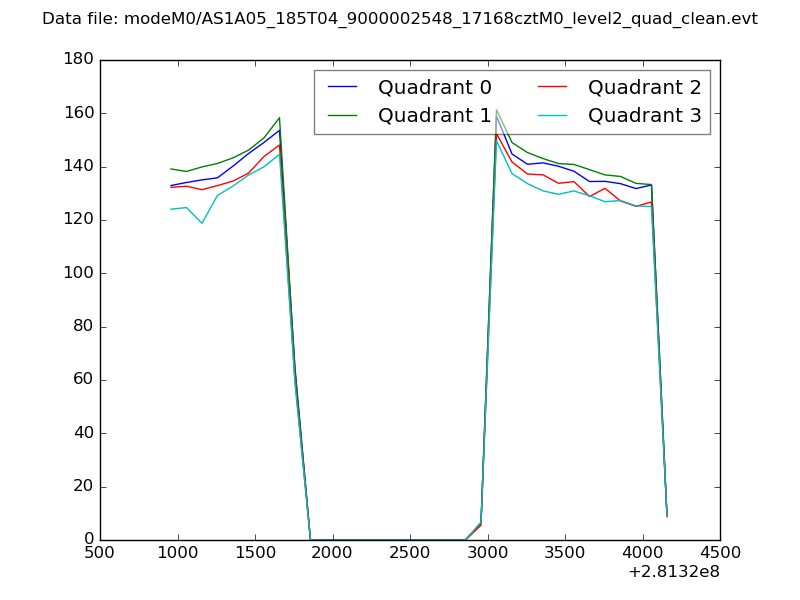 |
|
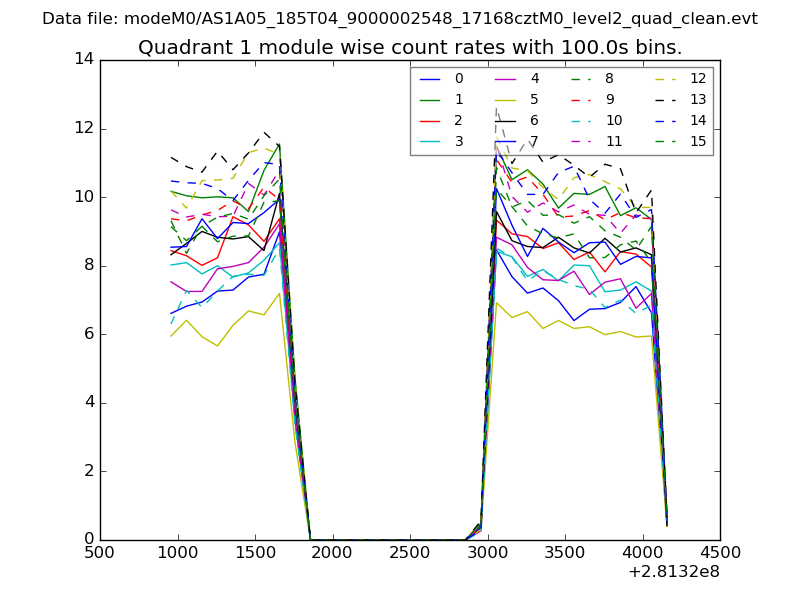
| Module-wise count rates for Quadrant A Data is divided into 100 sec bins |
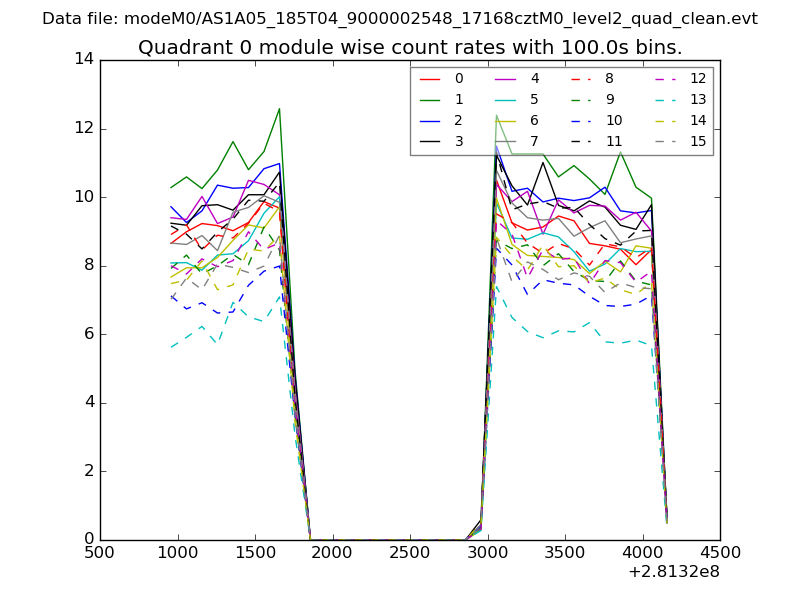 |
 |
| Module-wise count rates for Quadrant B Data is divided into 100 sec bins |
 |
 |
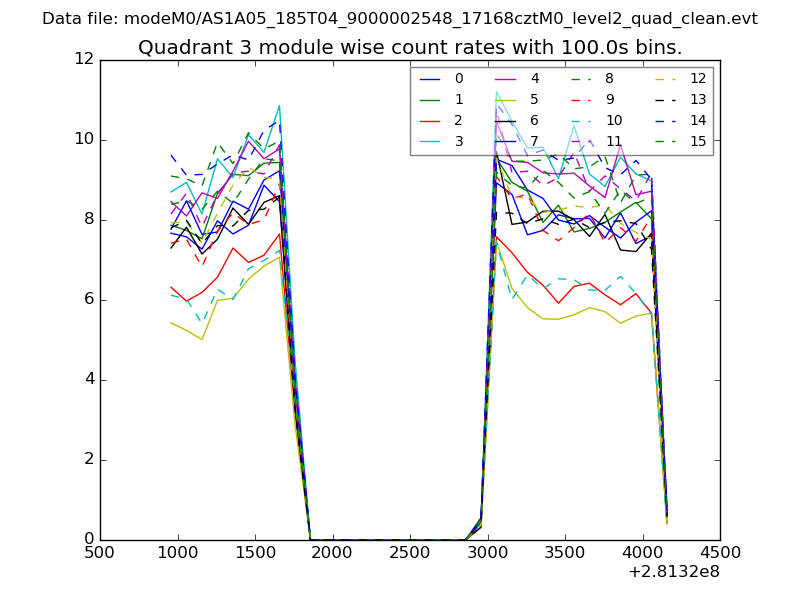
| Module-wise count rates for Quadrant C Data is divided into 100 sec bins |
 |
 |
| Module-wise count rates for Quadrant D Data is divided into 100 sec bins |
 |
 |
| Parameter | Plot |
|---|---|
| CZT HV Monitor | 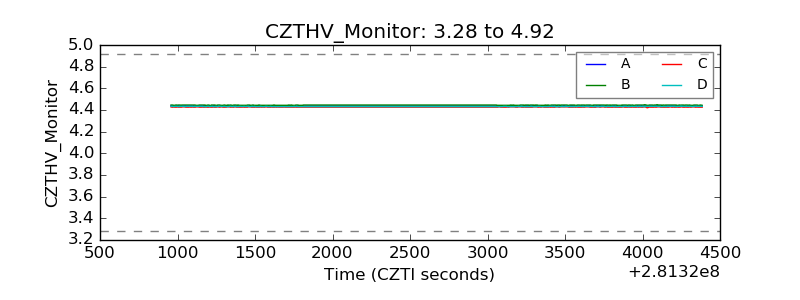 |
| D_VDD |  |
| Temperature 1 | 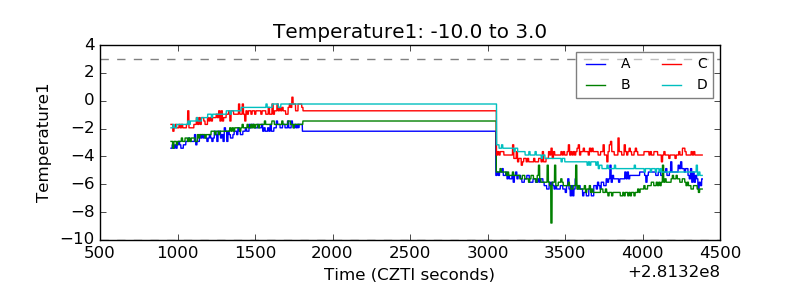 |
| Veto HV Monitor | 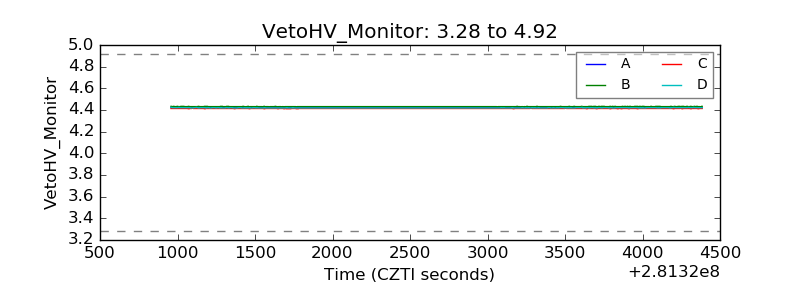 |
| Veto LLD | 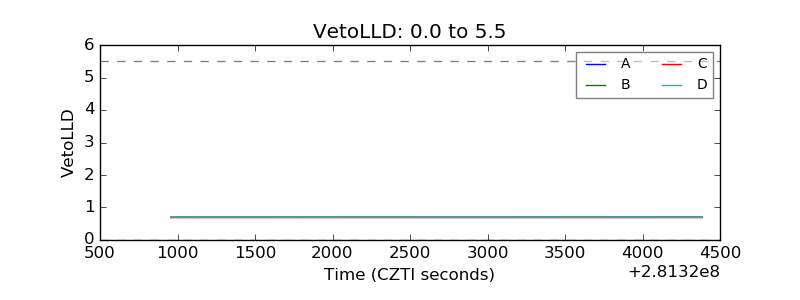 |
| Alpha Counter | 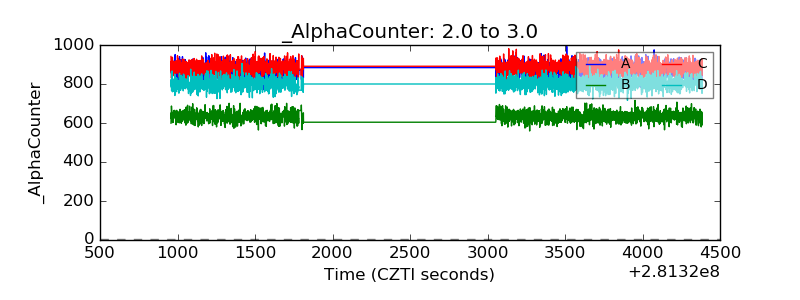 |
| _CPM_Rate | 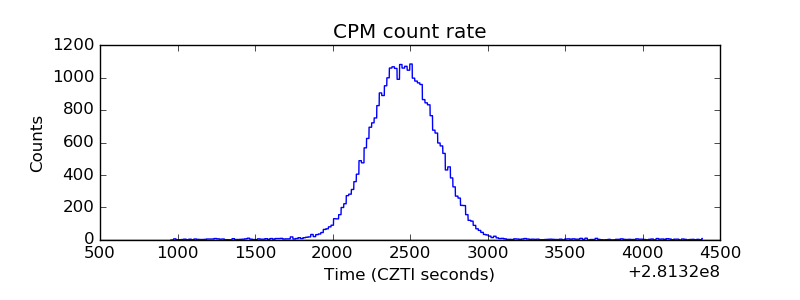 |
| CZT Counter | 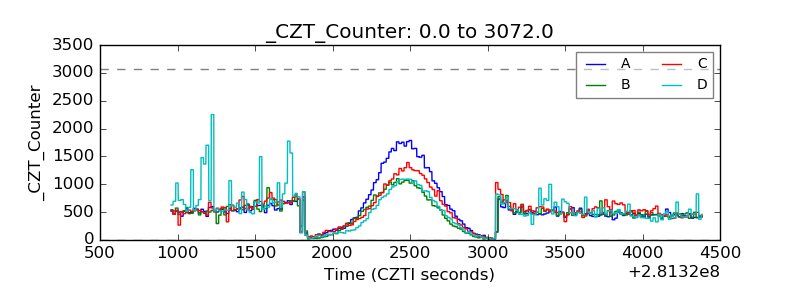 |
| +2.5 Volts monitor |  |
| +5 Volts monitor |  |
| _ROLL_ROT | 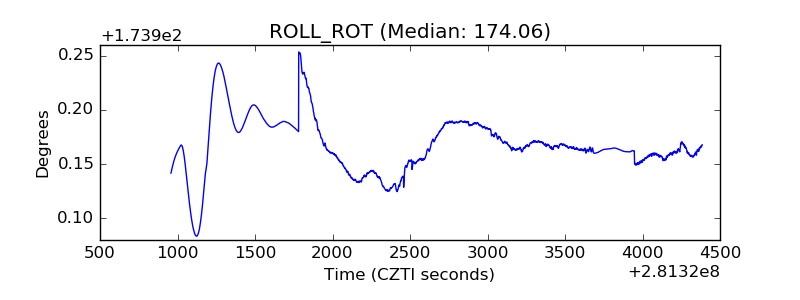 |
| _Roll_DEC | 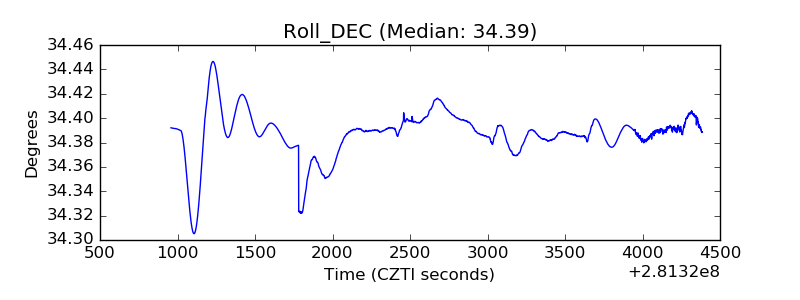 |
| _Roll_RA | 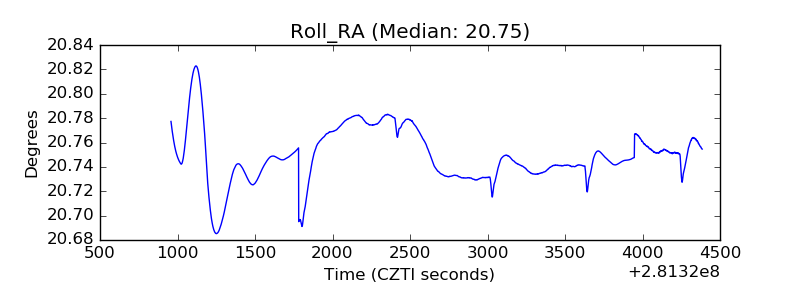 |
| Veto Counter | 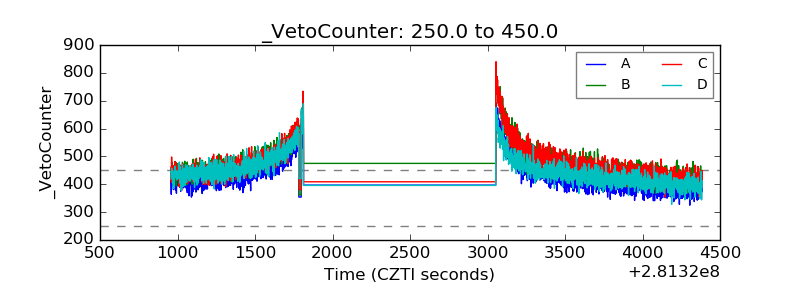 |