| Param | Original file | Final file |
|---|---|---|
| Filename | modeM0/AS1A05_185T04_9000002548_17169cztM0_level2.evt | modeM0/AS1A05_185T04_9000002548_17169cztM0_level2_quad_clean.evt |
| Size (bytes) | 481,037,760 | 92,044,800 |
| Size | 458.8 MB | 87.8 MB |
| Events in quadrant A | 3,370,372 | 587,062 |
| Events in quadrant B | 3,518,791 | 594,965 |
| Events in quadrant C | 3,601,216 | 564,009 |
| Events in quadrant D | 3,605,299 | 556,545 |
| Mode SS | |||
|---|---|---|---|
| Quadrant | BADHDUFLAG | Total packets | Discarded packets |
| A | 0 | 146 | 0 |
| B | 0 | 146 | 0 |
| C | 0 | 146 | 0 |
| D | 0 | 146 | 0 |
| Mode M9 | |||
|---|---|---|---|
| Quadrant | BADHDUFLAG | Total packets | Discarded packets |
| A | 0 | 22 | 0 |
| B | 0 | 22 | 0 |
| C | 0 | 22 | 0 |
| D | 0 | 22 | 0 |
| Mode M0 | |||
|---|---|---|---|
| Quadrant | BADHDUFLAG | Total packets | Discarded packets |
| A | 0 | 14563 | 2 |
| B | 0 | 15082 | 2 |
| C | 0 | 15169 | 2 |
| D | 0 | 15506 | 2 |
| Quadrant | Total seconds | Saturated seconds | Saturation percentage |
|---|---|---|---|
| A | 6956 | 41 | 0.589419% |
| B | 6957 | 70 | 1.006181% |
| C | 6957 | 98 | 1.408653% |
| D | 6957 | 43 | 0.618083% |
Noise dominated data is calculated using 1-second bins in cleaned event files. If a bin has >2000 counts, and if more than 50% of those come from <1% of pixels, then it is considered to be noise-dominated and hence unusable.
| Quadrant | # 1 sec bins | Bins with >0 counts | Bins with >2000 counts | High rate bins dominated by noise | Noise dominated (total time) | Noise dominated (detector-on time) | Marked lightcurve |
|---|---|---|---|---|---|---|---|
| A | 9166 | 6959 | 1 | 1 | 0.01% | 0.01% | 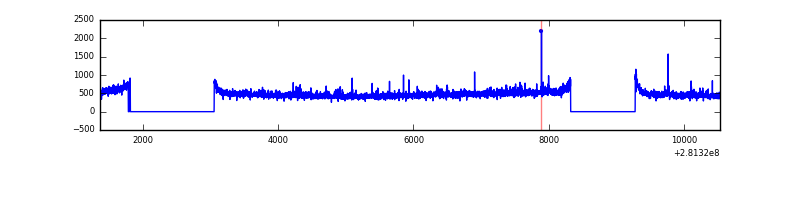 |
| B | 9167 | 6960 | 7 | 7 | 0.08% | 0.10% | 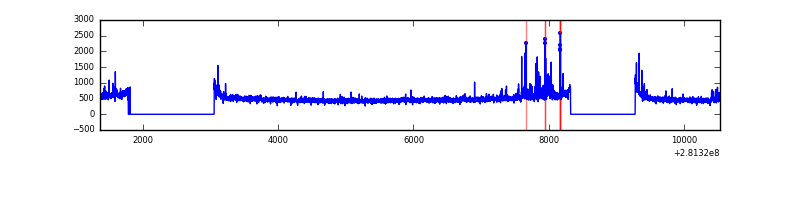 |
| C | 9167 | 6960 | 0 | 0 | 0.00% | 0.00% | 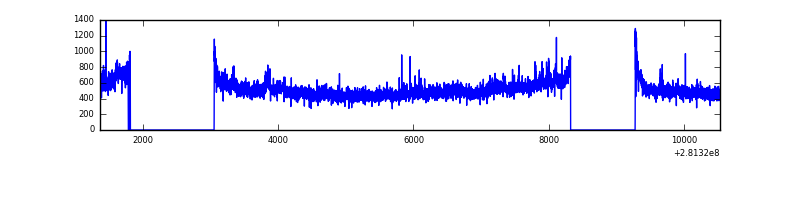 |
| D | 9167 | 6960 | 18 | 18 | 0.20% | 0.26% | 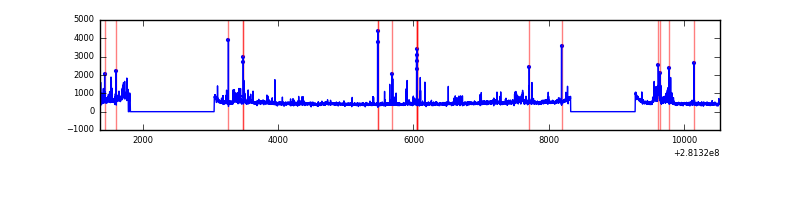 |
Top three noisy pixels from each quadrant. If the there are fewer than three noisy pixels in the level2.evt file, extra rows are filled as -1
| Pixel properties | Quadrant properties | ||||||
|---|---|---|---|---|---|---|---|
| Quadrant | DetID | PixID | Counts | Sigma | Mean | Median | Sigma |
| A | 12 | 189 | 79252 | 453.16 | 853 | 834 | 173.0 |
| A | 12 | 96 | 8969 | 47.01 | 853 | 834 | 173.0 |
| A | 0 | 226 | 7405 | 37.97 | 853 | 834 | 173.0 |
| B | 7 | 220 | 44981 | 270.59 | 855 | 832 | 163.2 |
| B | 0 | 197 | 35498 | 212.47 | 855 | 832 | 163.2 |
| B | 0 | 189 | 22524 | 132.95 | 855 | 832 | 163.2 |
| C | 3 | 233 | 253383 | 1315.24 | 821 | 828 | 192.0 |
| C | 14 | 238 | 125783 | 650.73 | 821 | 828 | 192.0 |
| C | 4 | 254 | 15070 | 74.17 | 821 | 828 | 192.0 |
| D | 5 | 222 | 360574 | 1790.52 | 827 | 804 | 200.9 |
| D | 2 | 152 | 31067 | 150.61 | 827 | 804 | 200.9 |
| D | 2 | 234 | 26687 | 128.82 | 827 | 804 | 200.9 |
Histogram calculated using DETX and DETY for each event in the final _common_clean file
| Quadrant A |  |
 |
Quadrant B |
|---|---|---|---|
| Quadrant D |  |
 |
Quadrant C |
| Plot type | Count rate plots | Images |
|---|---|---|
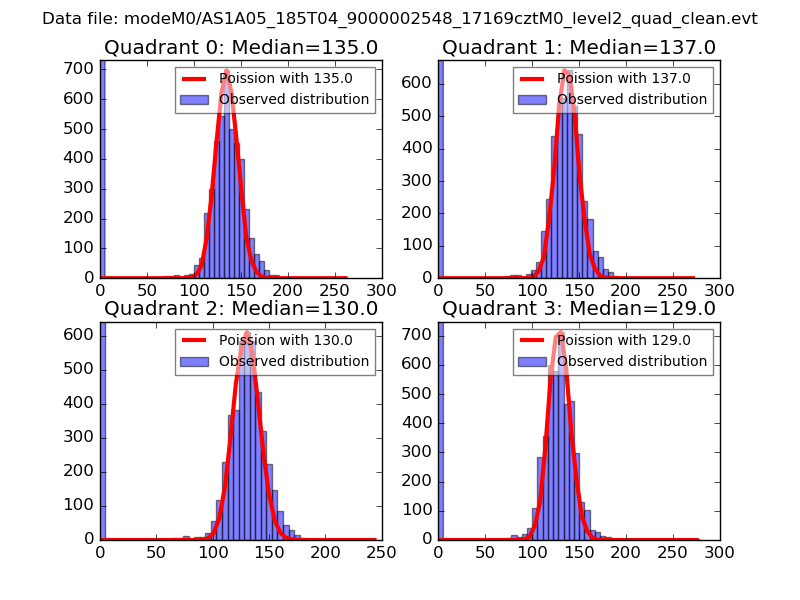
| Comparison with Poisson distribution Blue bars denote a histogram of data divided into 1 sec bins. Red curve is a Poisson curve with rate = median count rate of data. |
 |
 |
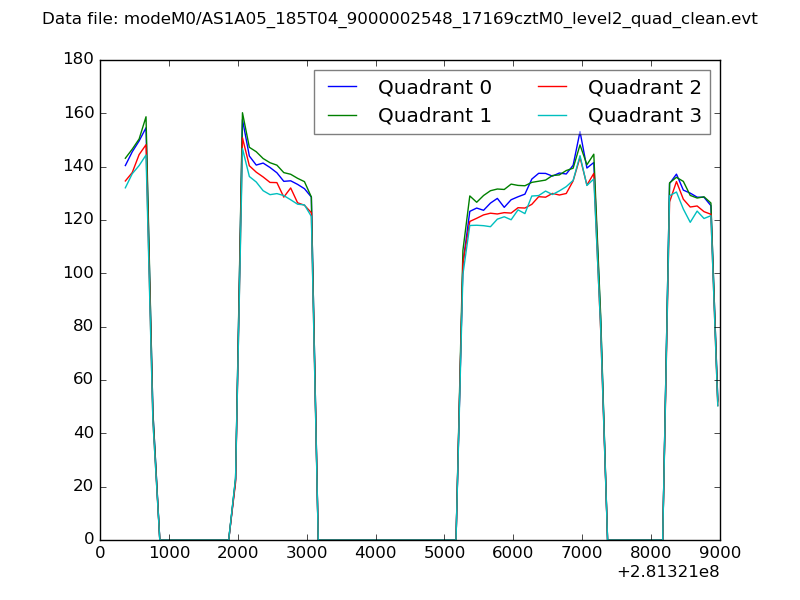
| Quadrant-wise count rates Data is divided into 100 sec bins |
 |
|
| Module-wise count rates for Quadrant A Data is divided into 100 sec bins |
 |
 |
| Module-wise count rates for Quadrant B Data is divided into 100 sec bins |
 |
 |
| Module-wise count rates for Quadrant C Data is divided into 100 sec bins |
 |
 |
| Module-wise count rates for Quadrant D Data is divided into 100 sec bins |
 |
 |
| Parameter | Plot |
|---|---|
| CZT HV Monitor |  |
| D_VDD |  |
| Temperature 1 |  |
| Veto HV Monitor |  |
| Veto LLD |  |
| Alpha Counter | 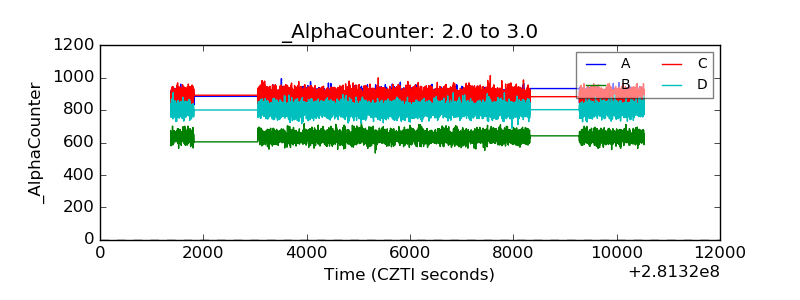 |
| _CPM_Rate | 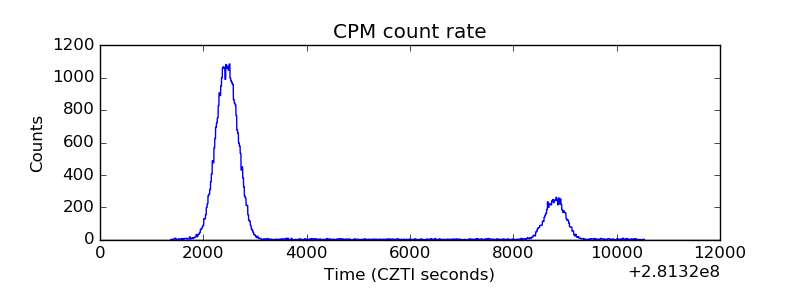 |
| CZT Counter |  |
| +2.5 Volts monitor |  |
| +5 Volts monitor |  |
| _ROLL_ROT |  |
| _Roll_DEC |  |
| _Roll_RA |  |
| Veto Counter |  |