| Param | Original file | Final file |
|---|---|---|
| Filename | modeM0/AS1A05_185T04_9000002548_17172cztM0_level2.evt | modeM0/AS1A05_185T04_9000002548_17172cztM0_level2_quad_clean.evt |
| Size (bytes) | 595,681,920 | 94,161,600 |
| Size | 568.1 MB | 89.8 MB |
| Events in quadrant A | 4,125,320 | 577,456 |
| Events in quadrant B | 4,280,394 | 578,598 |
| Events in quadrant C | 4,329,364 | 557,181 |
| Events in quadrant D | 4,724,085 | 543,649 |
| Mode SS | |||
|---|---|---|---|
| Quadrant | BADHDUFLAG | Total packets | Discarded packets |
| A | 0 | 174 | 0 |
| B | 0 | 174 | 0 |
| C | 0 | 174 | 0 |
| D | 0 | 174 | 0 |
| Mode M9 | |||
|---|---|---|---|
| Quadrant | BADHDUFLAG | Total packets | Discarded packets |
| A | 0 | 5 | 0 |
| B | 0 | 5 | 0 |
| C | 0 | 5 | 0 |
| D | 0 | 5 | 0 |
| Mode M0 | |||
|---|---|---|---|
| Quadrant | BADHDUFLAG | Total packets | Discarded packets |
| A | 0 | 17903 | 2 |
| B | 0 | 18277 | 2 |
| C | 0 | 18246 | 2 |
| D | 0 | 19953 | 2 |
| Quadrant | Total seconds | Saturated seconds | Saturation percentage |
|---|---|---|---|
| A | 8558 | 300 | 3.505492% |
| B | 8559 | 360 | 4.206099% |
| C | 8559 | 337 | 3.937376% |
| D | 8559 | 411 | 4.801963% |
Noise dominated data is calculated using 1-second bins in cleaned event files. If a bin has >2000 counts, and if more than 50% of those come from <1% of pixels, then it is considered to be noise-dominated and hence unusable.
| Quadrant | # 1 sec bins | Bins with >0 counts | Bins with >2000 counts | High rate bins dominated by noise | Noise dominated (total time) | Noise dominated (detector-on time) | Marked lightcurve |
|---|---|---|---|---|---|---|---|
| A | 9038 | 8559 | 0 | 0 | 0.00% | 0.00% | 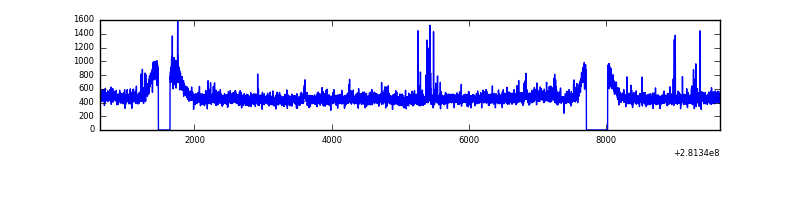 |
| B | 9039 | 8561 | 12 | 12 | 0.13% | 0.14% | 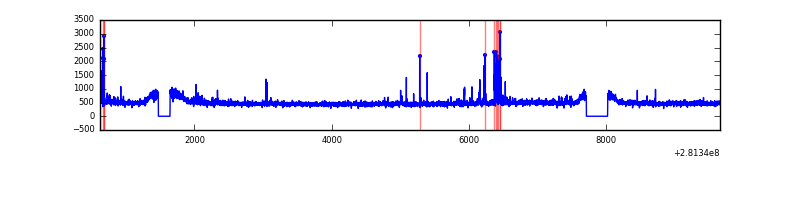 |
| C | 9039 | 8561 | 15 | 15 | 0.17% | 0.18% | 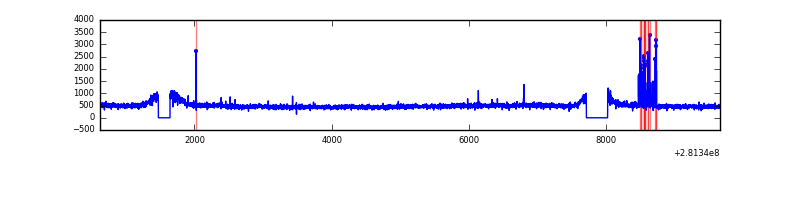 |
| D | 9039 | 8561 | 178 | 178 | 1.97% | 2.08% | 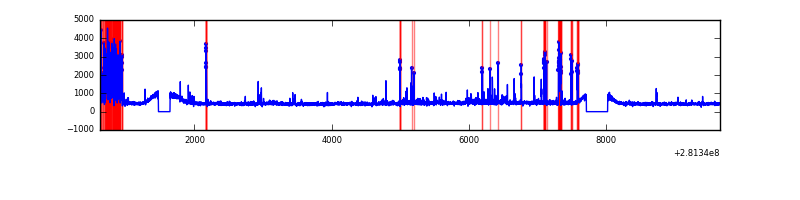 |
Top three noisy pixels from each quadrant. If the there are fewer than three noisy pixels in the level2.evt file, extra rows are filled as -1
| Pixel properties | Quadrant properties | ||||||
|---|---|---|---|---|---|---|---|
| Quadrant | DetID | PixID | Counts | Sigma | Mean | Median | Sigma |
| A | 12 | 189 | 65257 | 301.42 | 1048 | 1021 | 213.1 |
| A | 12 | 96 | 23545 | 105.69 | 1048 | 1021 | 213.1 |
| A | 0 | 226 | 8917 | 37.05 | 1048 | 1021 | 213.1 |
| B | 0 | 197 | 91726 | 445.42 | 1047 | 1016 | 203.6 |
| B | 0 | 219 | 41230 | 197.47 | 1047 | 1016 | 203.6 |
| B | 12 | 111 | 25028 | 117.91 | 1047 | 1016 | 203.6 |
| C | 14 | 238 | 151062 | 625.34 | 1009 | 1013 | 239.9 |
| C | 3 | 233 | 119925 | 495.57 | 1009 | 1013 | 239.9 |
| C | 4 | 254 | 116445 | 481.07 | 1009 | 1013 | 239.9 |
| D | 5 | 222 | 770590 | 3086.49 | 1016 | 982 | 249.3 |
| D | 7 | 38 | 62382 | 246.24 | 1016 | 982 | 249.3 |
| D | 2 | 234 | 32772 | 127.49 | 1016 | 982 | 249.3 |
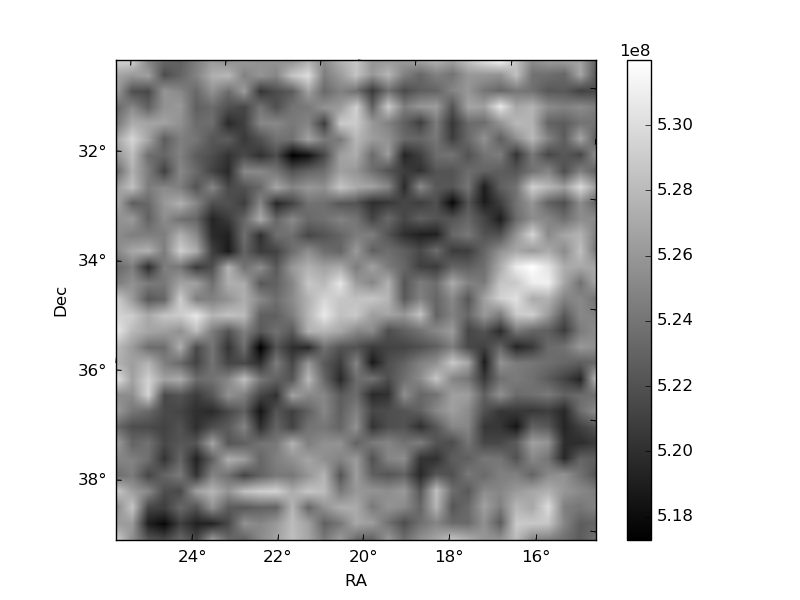
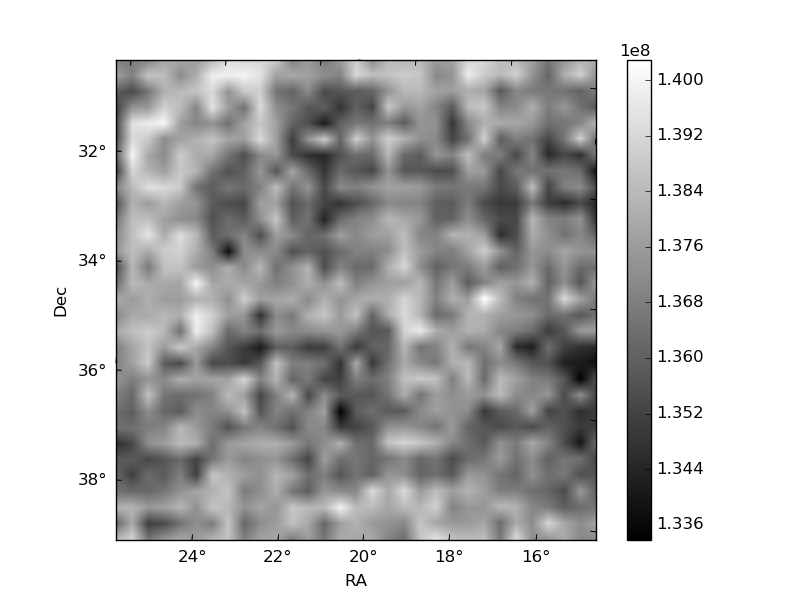
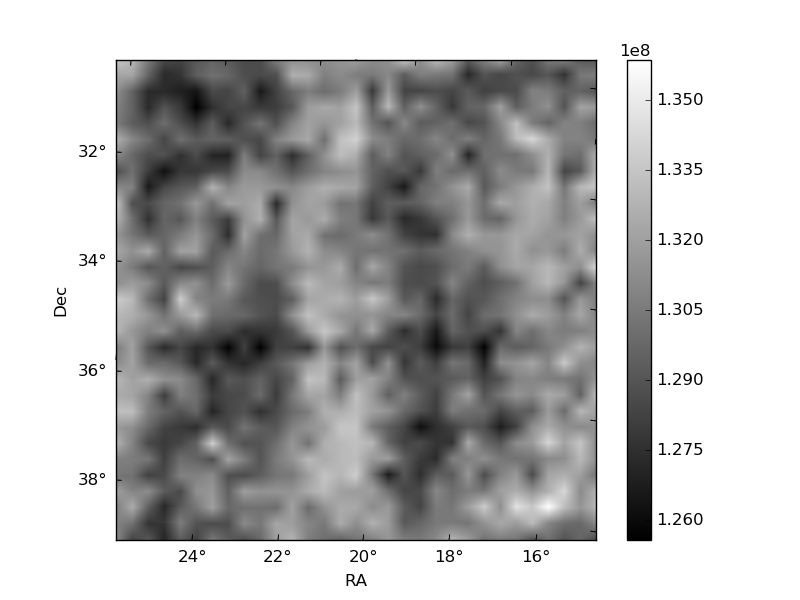
Histogram calculated using DETX and DETY for each event in the final _common_clean file
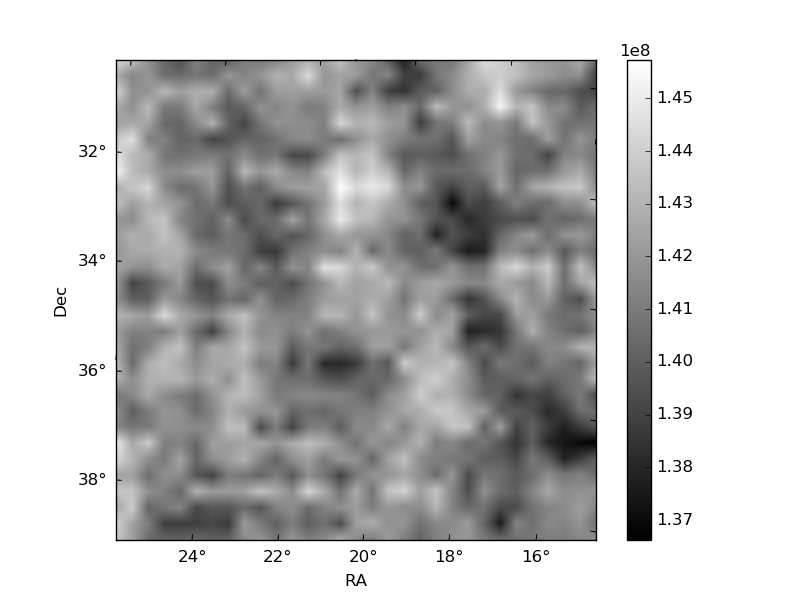
| Quadrant A | 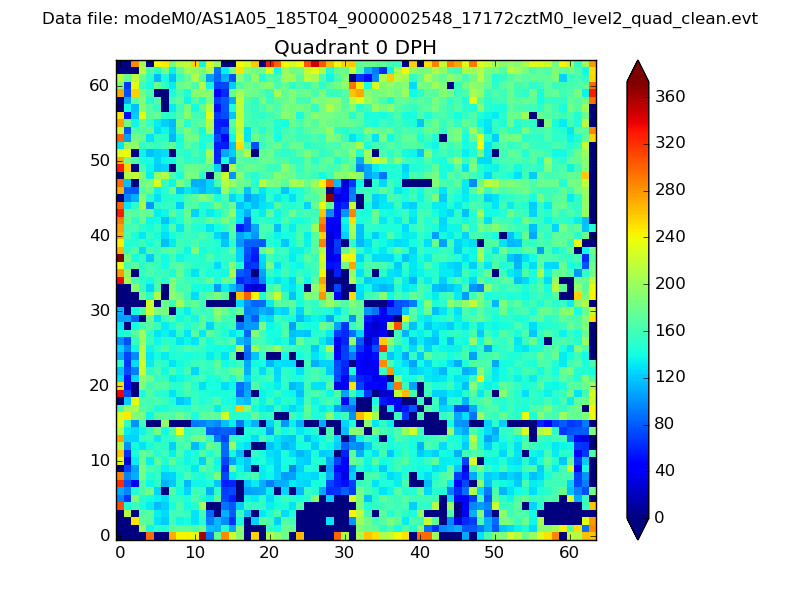 |
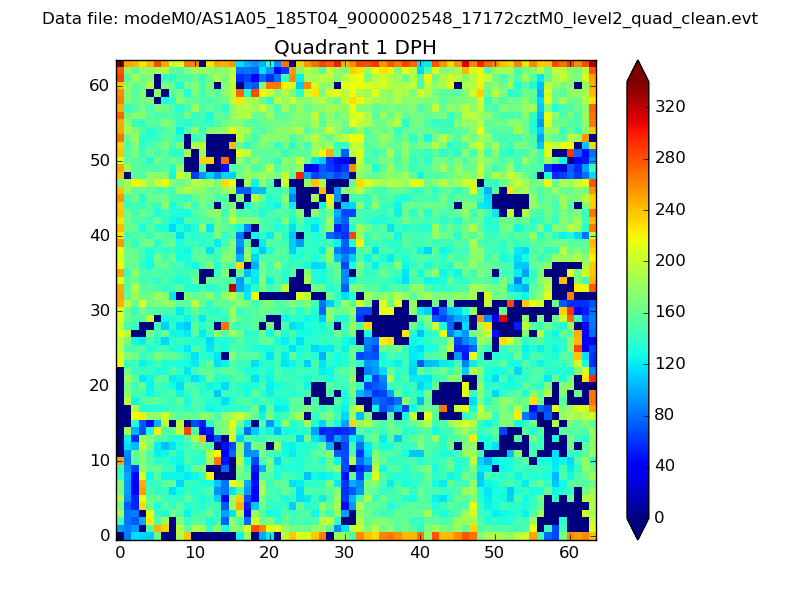 |
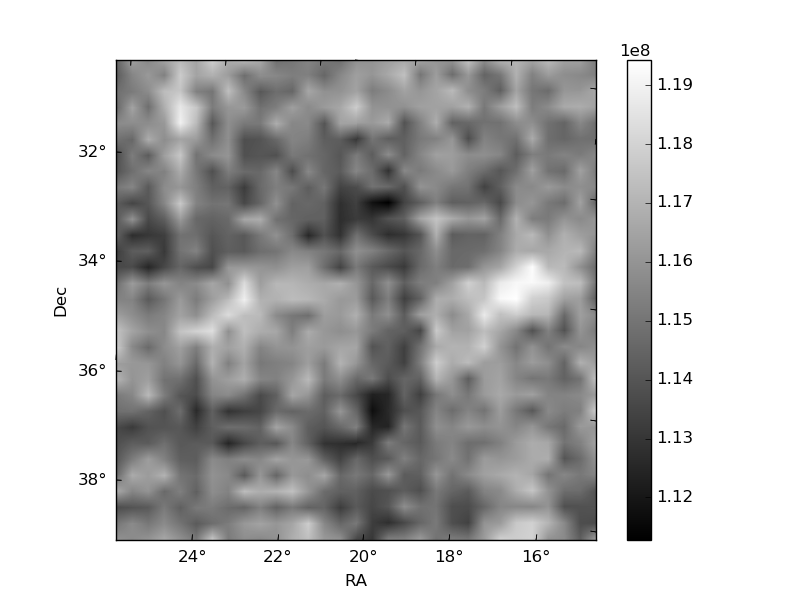
Quadrant B |
|---|---|---|---|
| Quadrant D | 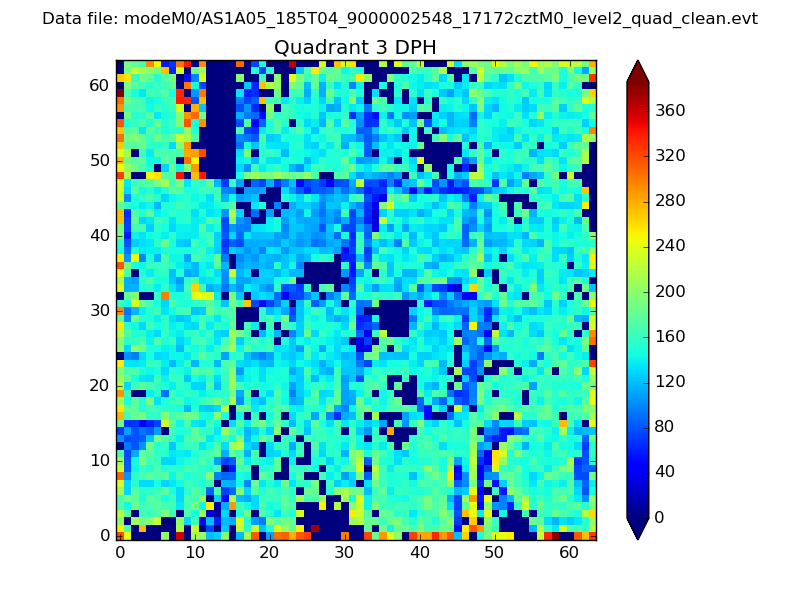 |
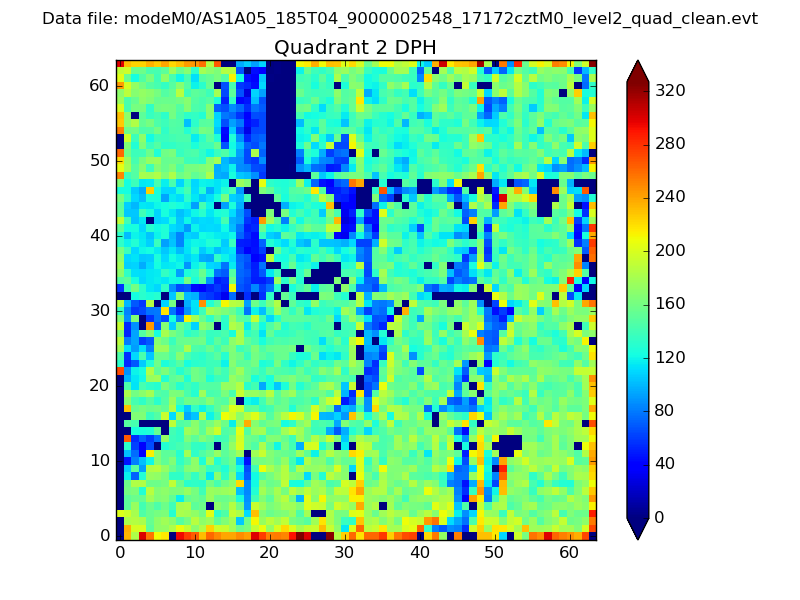 |
Quadrant C |
| Plot type | Count rate plots | Images |
|---|---|---|
| Comparison with Poisson distribution Blue bars denote a histogram of data divided into 1 sec bins. Red curve is a Poisson curve with rate = median count rate of data. |
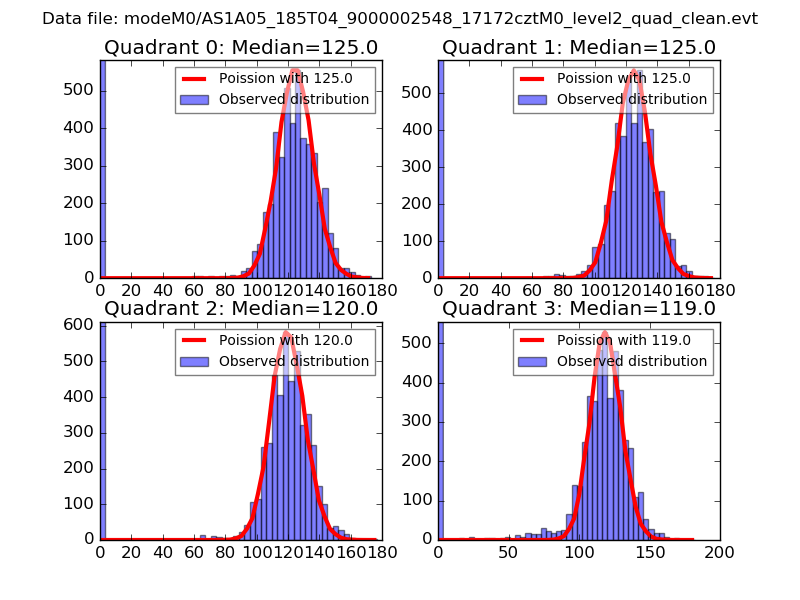 |
 |
| Quadrant-wise count rates Data is divided into 100 sec bins |
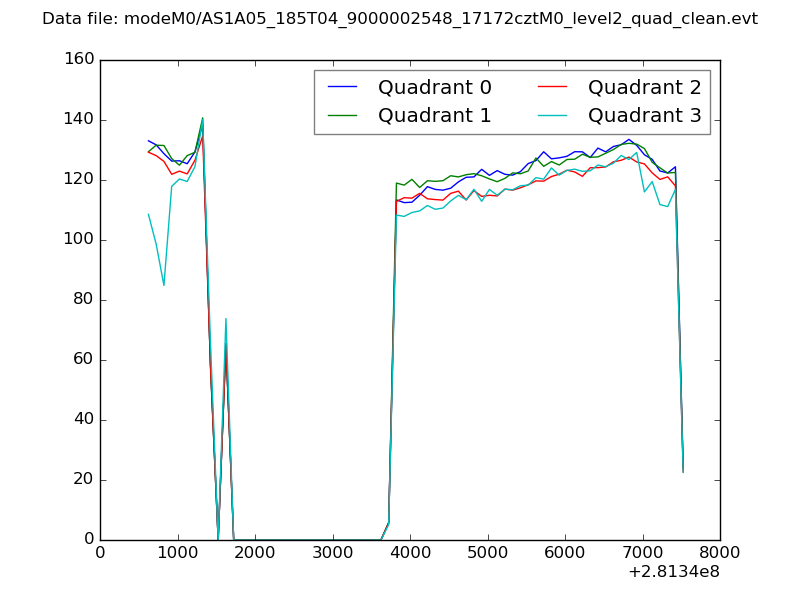 |
|
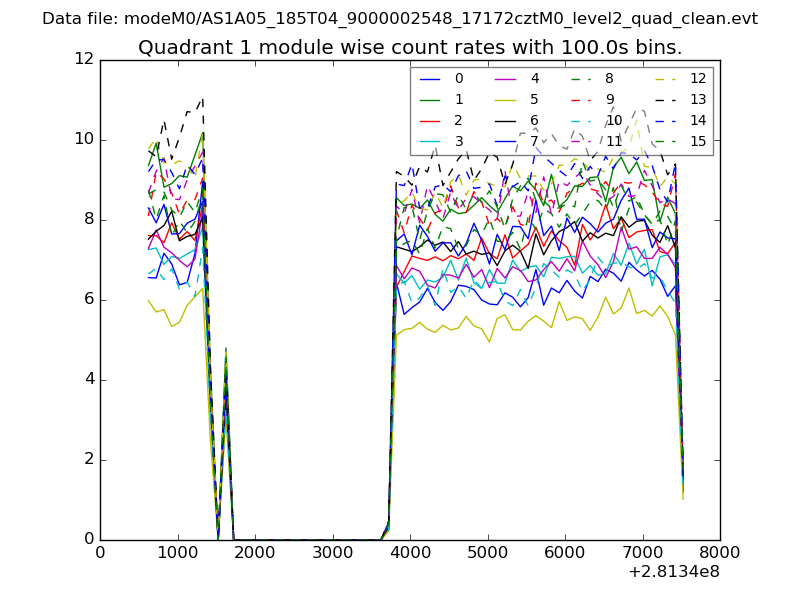
| Module-wise count rates for Quadrant A Data is divided into 100 sec bins |
 |
 |
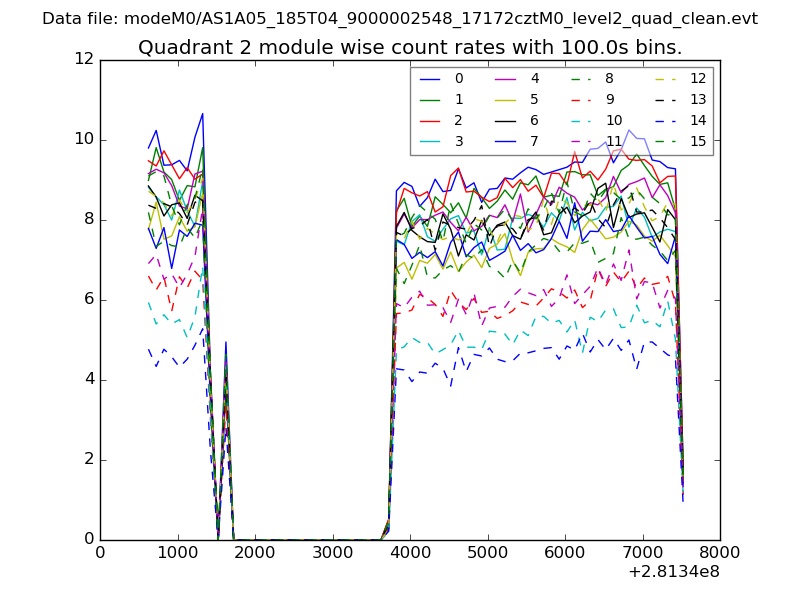
| Module-wise count rates for Quadrant B Data is divided into 100 sec bins |
 |
 |
| Module-wise count rates for Quadrant C Data is divided into 100 sec bins |
 |
 |
| Module-wise count rates for Quadrant D Data is divided into 100 sec bins |
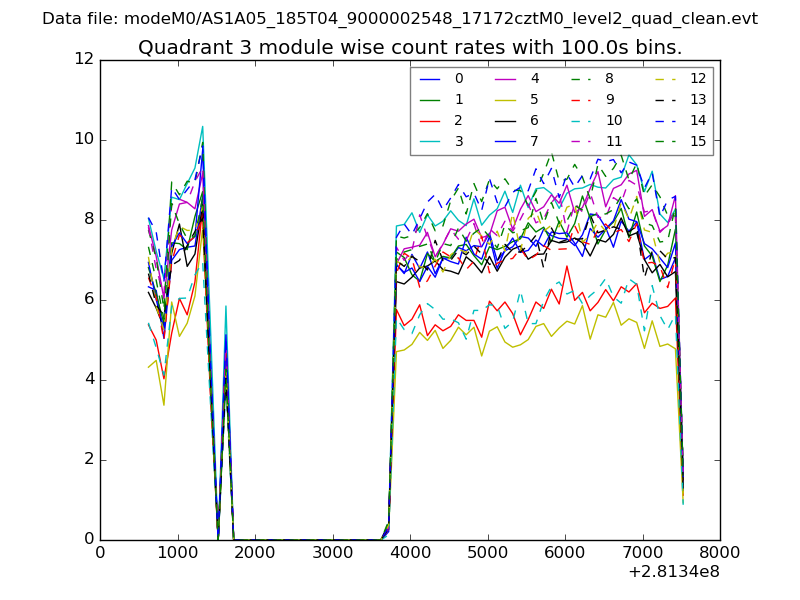 |
 |
| Parameter | Plot |
|---|---|
| CZT HV Monitor | 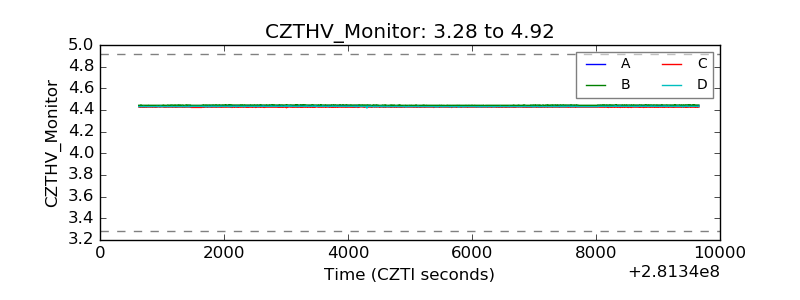 |
| D_VDD |  |
| Temperature 1 | 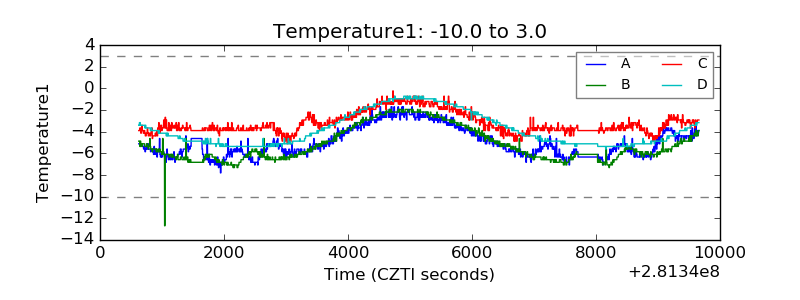 |
| Veto HV Monitor | 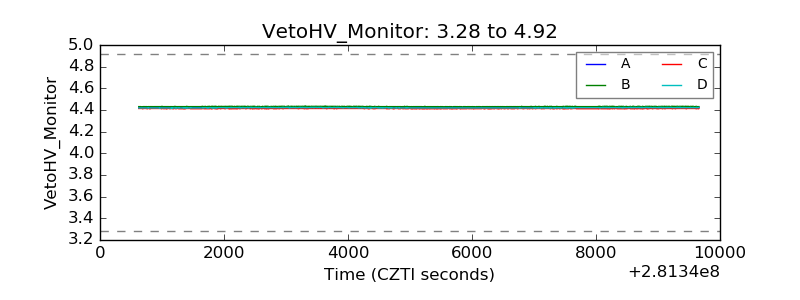 |
| Veto LLD |  |
| Alpha Counter | 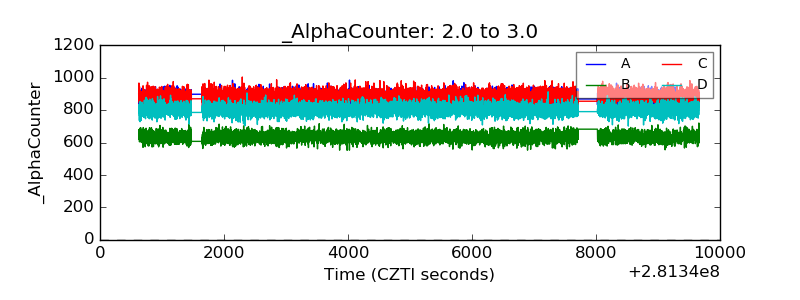 |
| _CPM_Rate | 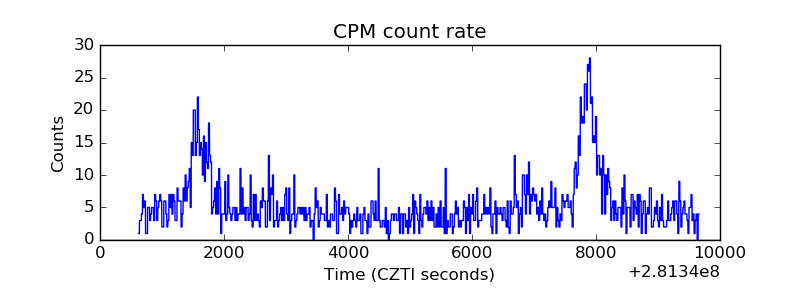 |
| CZT Counter | 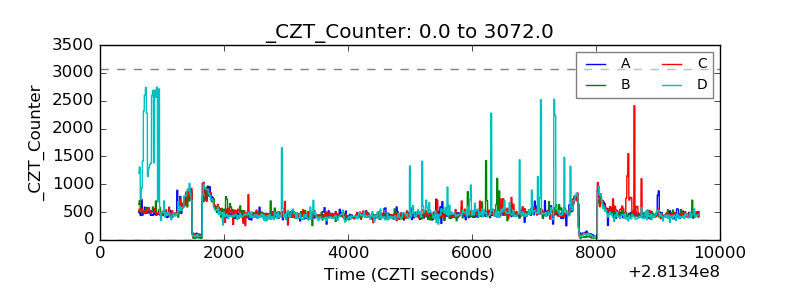 |
| +2.5 Volts monitor |  |
| +5 Volts monitor | 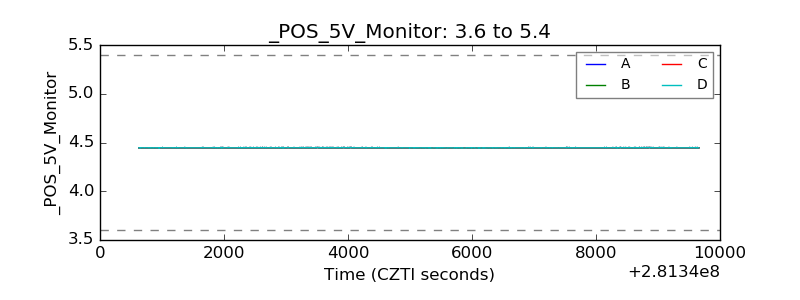 |
| _ROLL_ROT |  |
| _Roll_DEC | 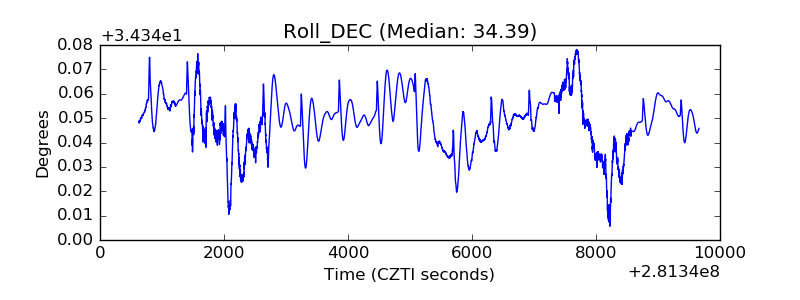 |
| _Roll_RA | 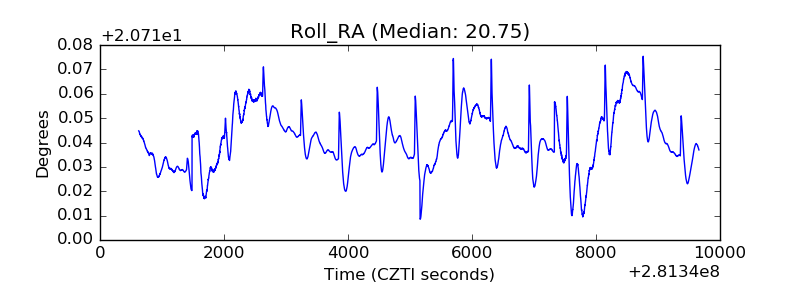 |
| Veto Counter |  |