| Param | Original file | Final file |
|---|---|---|
| Filename | modeM0/AS1A05_185T04_9000002548_17178cztM0_level2.evt | modeM0/AS1A05_185T04_9000002548_17178cztM0_level2_quad_clean.evt |
| Size (bytes) | 493,490,880 | 99,504,000 |
| Size | 470.6 MB | 94.9 MB |
| Events in quadrant A | 3,159,203 | 664,125 |
| Events in quadrant B | 3,292,505 | 661,846 |
| Events in quadrant C | 3,242,801 | 626,815 |
| Events in quadrant D | 4,807,746 | 605,369 |
| Mode SS | |||
|---|---|---|---|
| Quadrant | BADHDUFLAG | Total packets | Discarded packets |
| A | 0 | 134 | 0 |
| B | 0 | 134 | 0 |
| C | 0 | 134 | 0 |
| D | 0 | 134 | 0 |
| Mode M9 | |||
|---|---|---|---|
| Quadrant | BADHDUFLAG | Total packets | Discarded packets |
| A | 0 | 11 | 0 |
| B | 0 | 11 | 0 |
| C | 0 | 11 | 0 |
| D | 0 | 11 | 0 |
| Mode M0 | |||
|---|---|---|---|
| Quadrant | BADHDUFLAG | Total packets | Discarded packets |
| A | 0 | 13746 | 1 |
| B | 0 | 14069 | 1 |
| C | 0 | 13849 | 1 |
| D | 0 | 18790 | 1 |
| Quadrant | Total seconds | Saturated seconds | Saturation percentage |
|---|---|---|---|
| A | 6522 | 44 | 0.674640% |
| B | 6522 | 53 | 0.812634% |
| C | 6523 | 69 | 1.057795% |
| D | 6522 | 323 | 4.952469% |
Noise dominated data is calculated using 1-second bins in cleaned event files. If a bin has >2000 counts, and if more than 50% of those come from <1% of pixels, then it is considered to be noise-dominated and hence unusable.
| Quadrant | # 1 sec bins | Bins with >0 counts | Bins with >2000 counts | High rate bins dominated by noise | Noise dominated (total time) | Noise dominated (detector-on time) | Marked lightcurve |
|---|---|---|---|---|---|---|---|
| A | 7647 | 6522 | 0 | 0 | 0.00% | 0.00% | 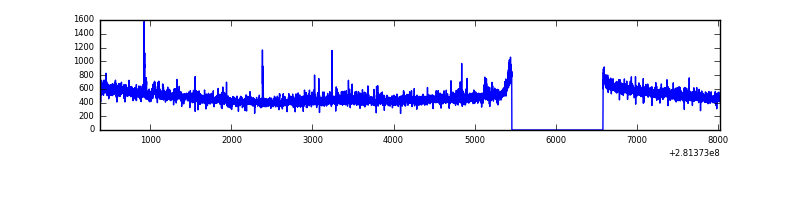 |
| B | 7647 | 6523 | 8 | 8 | 0.10% | 0.12% | 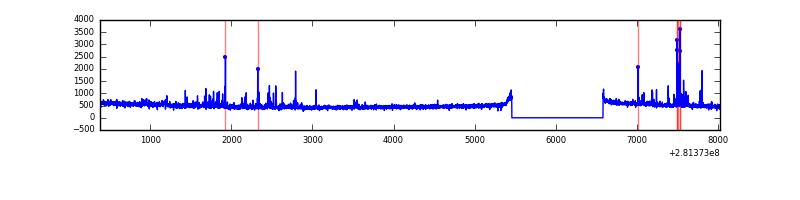 |
| C | 7648 | 6524 | 0 | 0 | 0.00% | 0.00% | 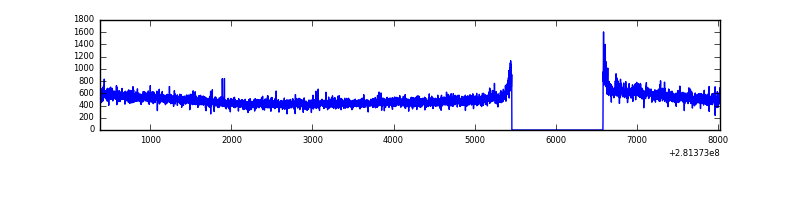 |
| D | 7647 | 6522 | 262 | 262 | 3.43% | 4.02% | 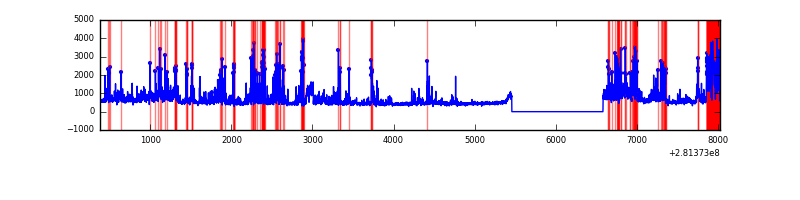 |
Top three noisy pixels from each quadrant. If the there are fewer than three noisy pixels in the level2.evt file, extra rows are filled as -1
| Pixel properties | Quadrant properties | ||||||
|---|---|---|---|---|---|---|---|
| Quadrant | DetID | PixID | Counts | Sigma | Mean | Median | Sigma |
| A | 12 | 189 | 49059 | 296.71 | 805 | 789 | 162.7 |
| A | 15 | 174 | 13640 | 78.99 | 805 | 789 | 162.7 |
| A | 0 | 226 | 7086 | 38.7 | 805 | 789 | 162.7 |
| B | 7 | 220 | 57423 | 376.31 | 797 | 778 | 150.5 |
| B | 0 | 189 | 44006 | 287.18 | 797 | 778 | 150.5 |
| B | 0 | 197 | 34050 | 221.04 | 797 | 778 | 150.5 |
| C | 3 | 233 | 136440 | 762.55 | 764 | 768 | 177.9 |
| C | 14 | 238 | 117219 | 654.52 | 764 | 768 | 177.9 |
| C | 7 | 220 | 9022 | 46.39 | 764 | 768 | 177.9 |
| D | 5 | 222 | 1089034 | 5804.71 | 772 | 751 | 187.5 |
| D | 1 | 52 | 576635 | 3071.67 | 772 | 751 | 187.5 |
| D | 12 | 233 | 111675 | 591.65 | 772 | 751 | 187.5 |
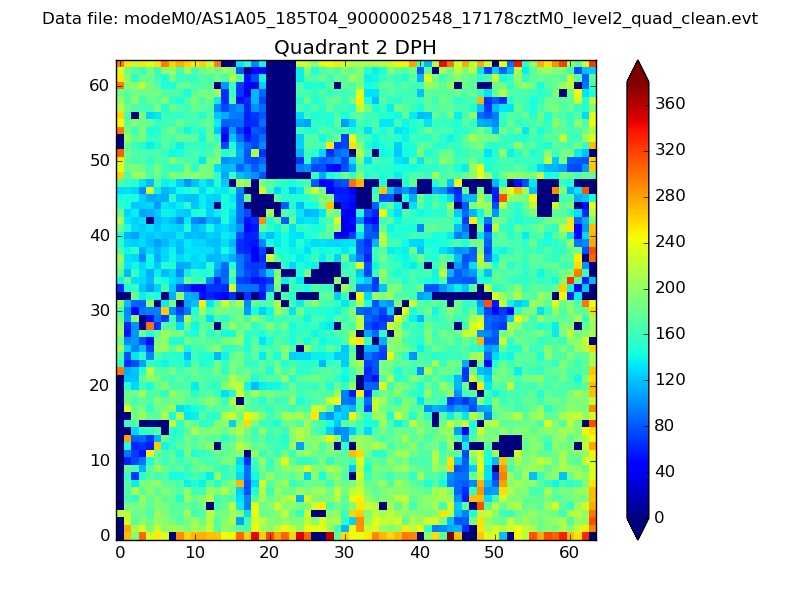
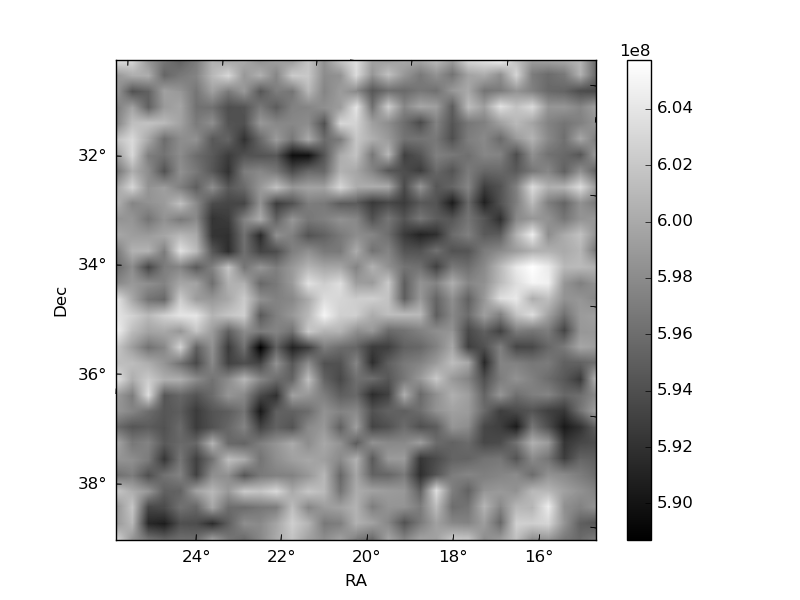
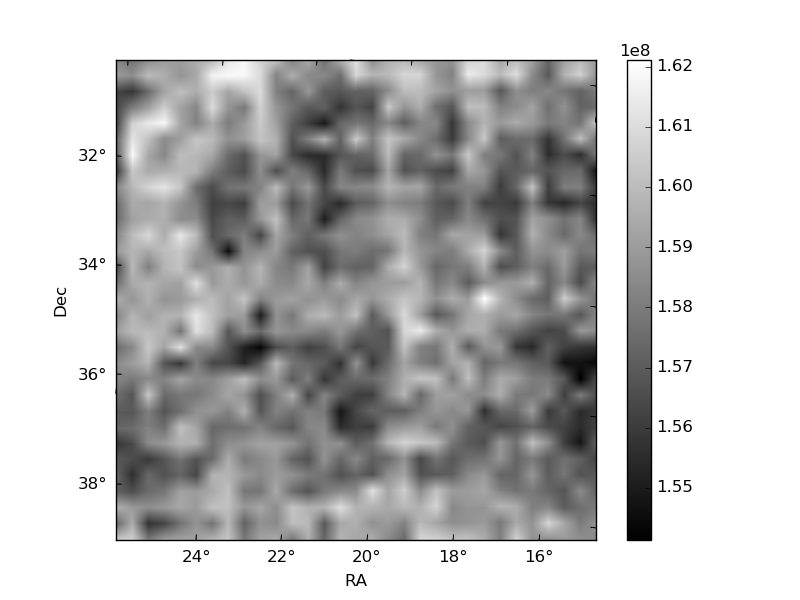
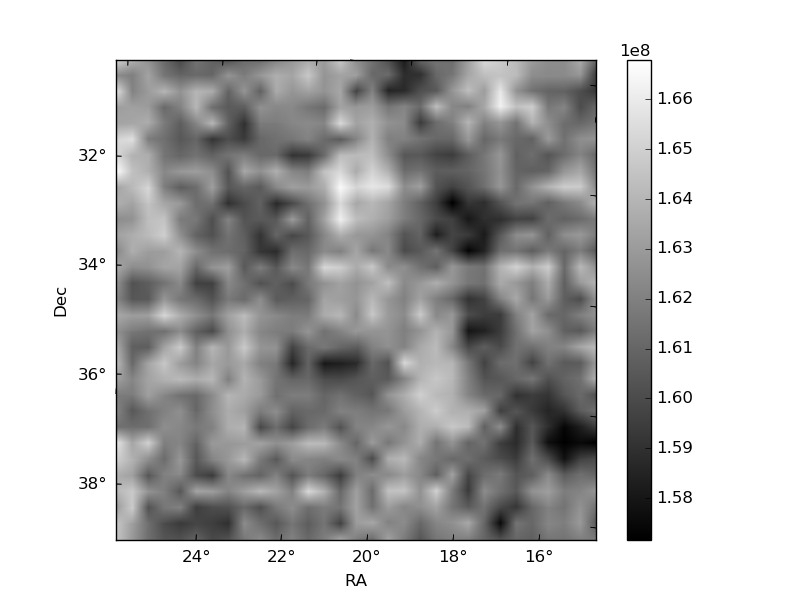
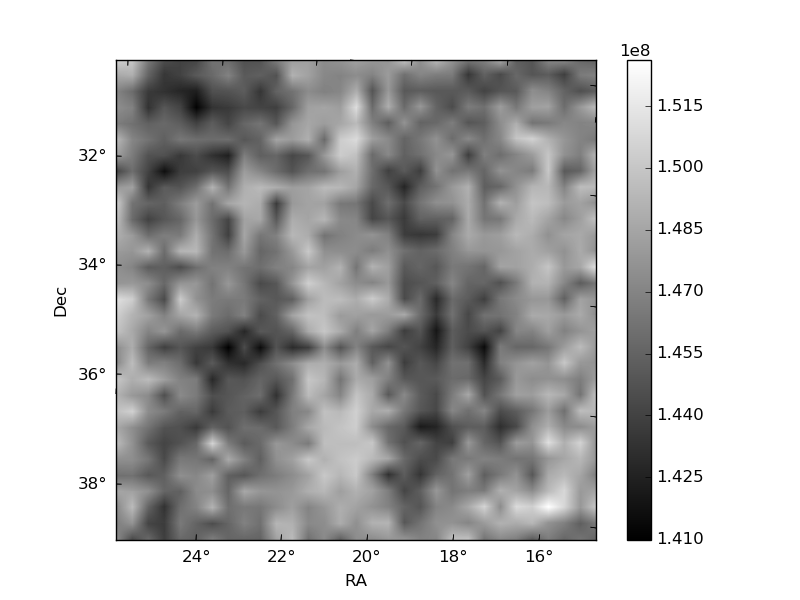
Histogram calculated using DETX and DETY for each event in the final _common_clean file
| Quadrant A | 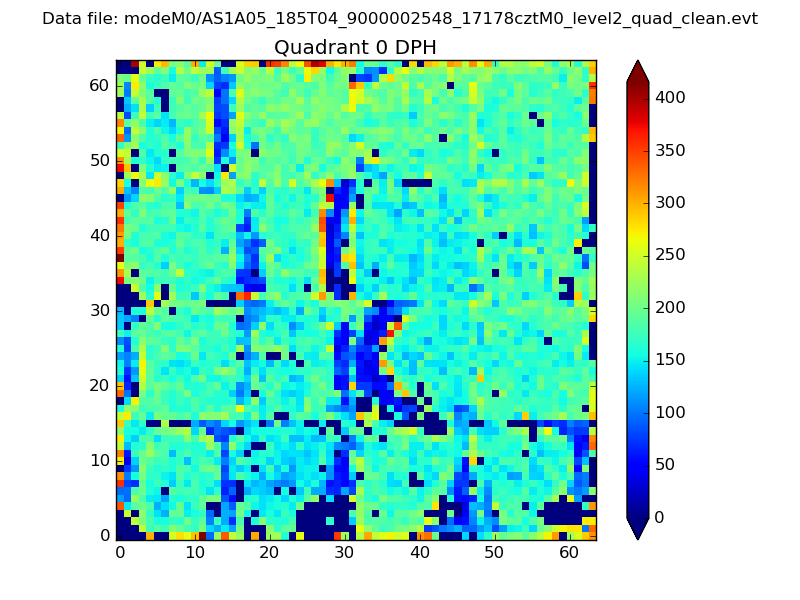 |
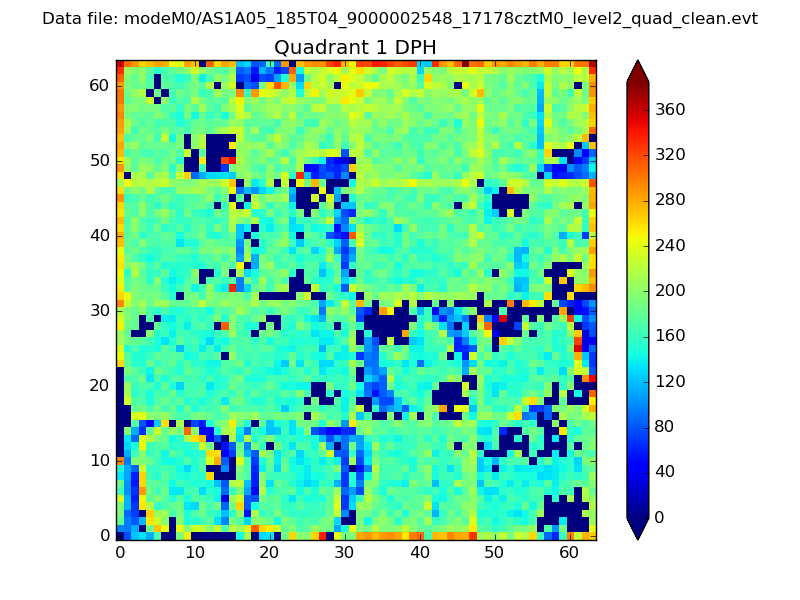 |
Quadrant B |
|---|---|---|---|
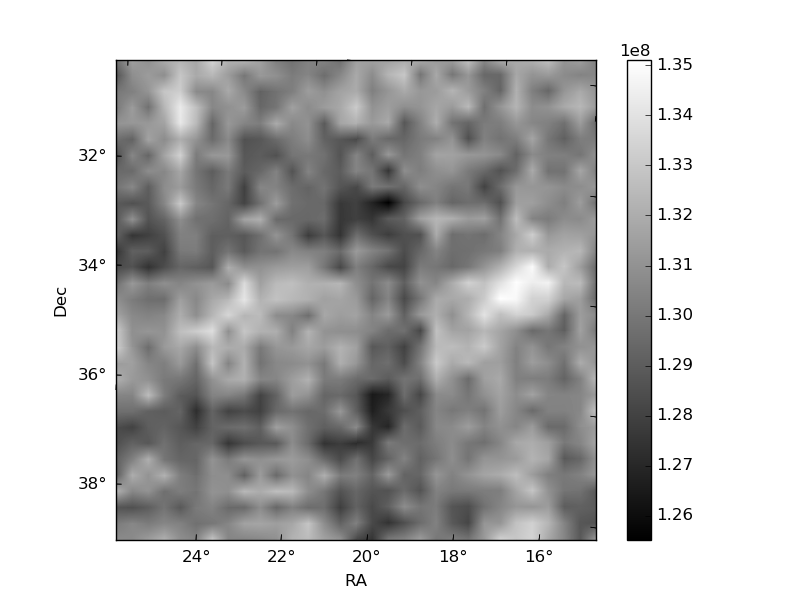
| Quadrant D | 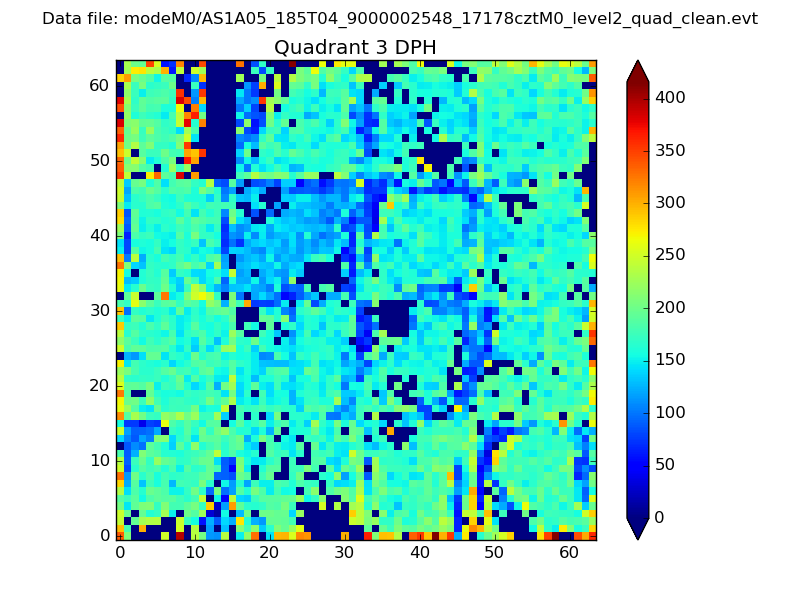 |
 |
Quadrant C |
| Plot type | Count rate plots | Images |
|---|---|---|
| Comparison with Poisson distribution Blue bars denote a histogram of data divided into 1 sec bins. Red curve is a Poisson curve with rate = median count rate of data. |
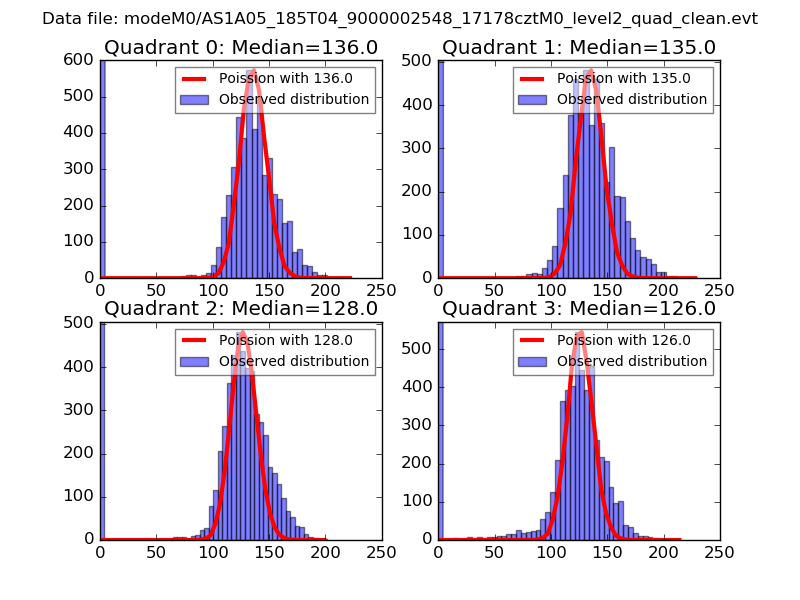 |
 |
| Quadrant-wise count rates Data is divided into 100 sec bins |
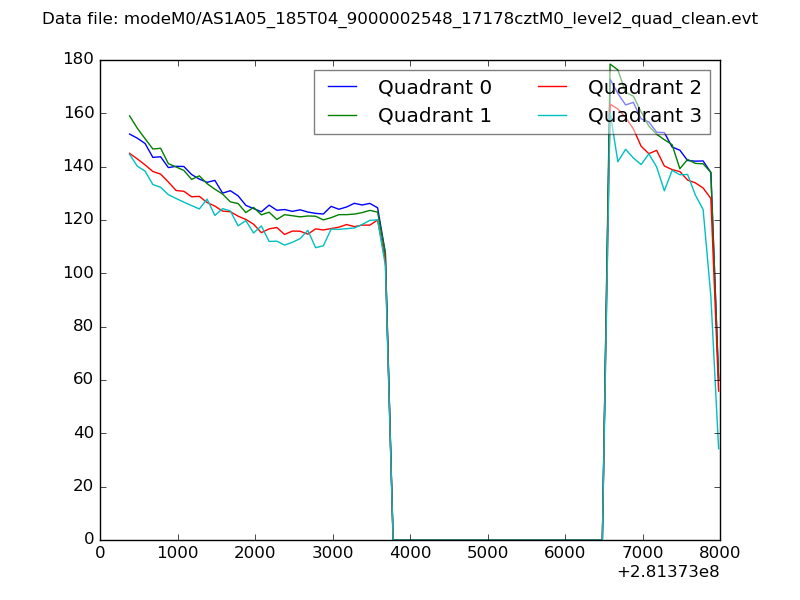 |
|
| Module-wise count rates for Quadrant A Data is divided into 100 sec bins |
 |
 |
| Module-wise count rates for Quadrant B Data is divided into 100 sec bins |
 |
 |
| Module-wise count rates for Quadrant C Data is divided into 100 sec bins |
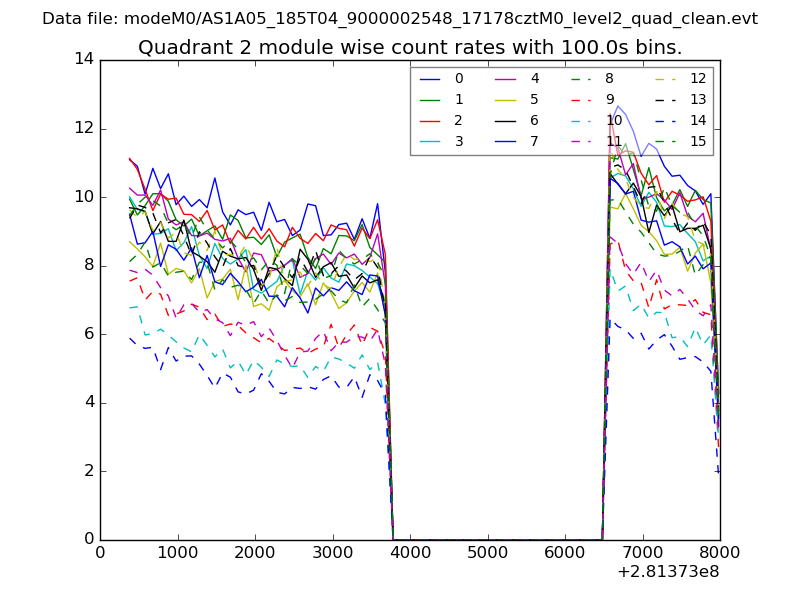 |
 |
| Module-wise count rates for Quadrant D Data is divided into 100 sec bins |
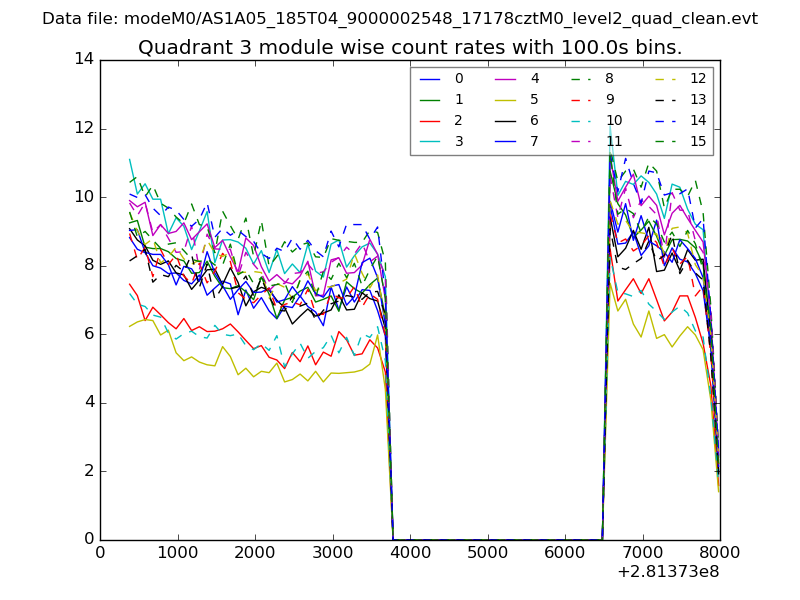 |
 |
| Parameter | Plot |
|---|---|
| CZT HV Monitor |  |
| D_VDD | 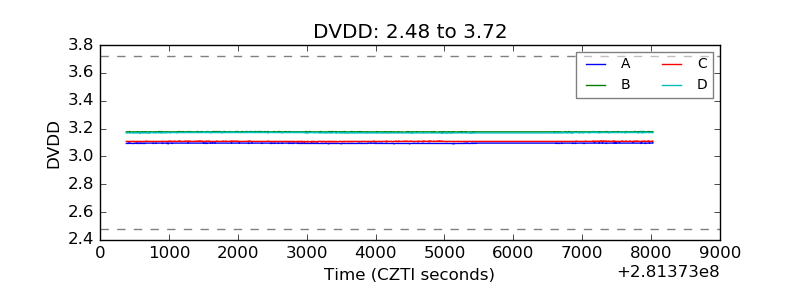 |
| Temperature 1 | 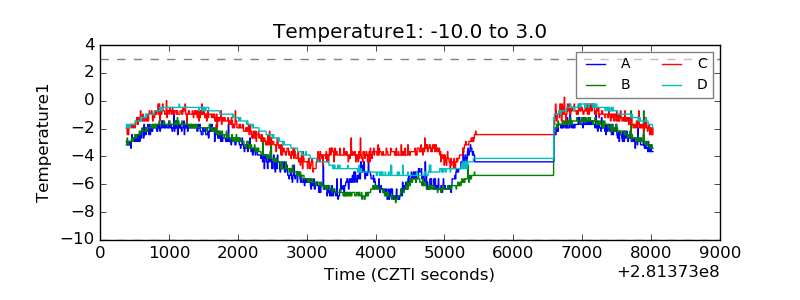 |
| Veto HV Monitor | 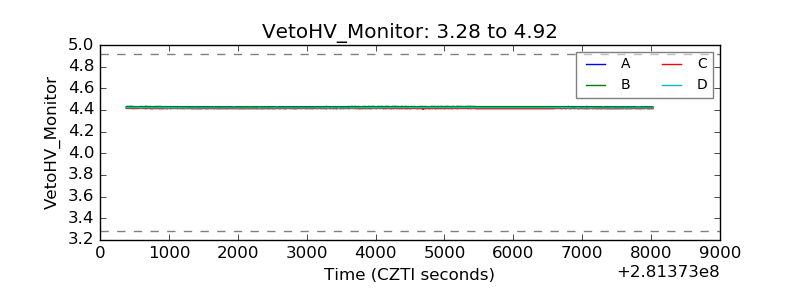 |
| Veto LLD | 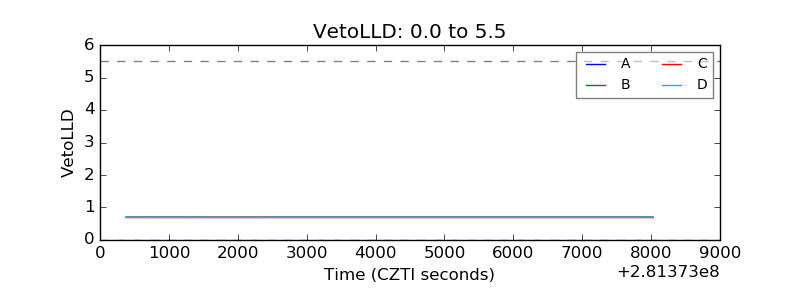 |
| Alpha Counter | 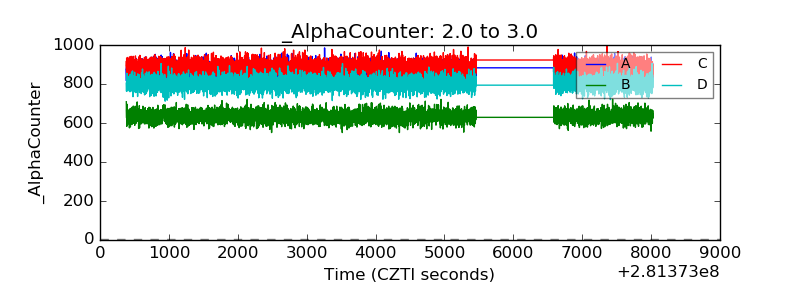 |
| _CPM_Rate | 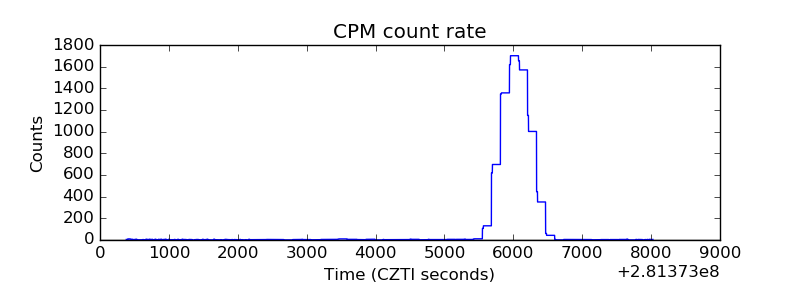 |
| CZT Counter | 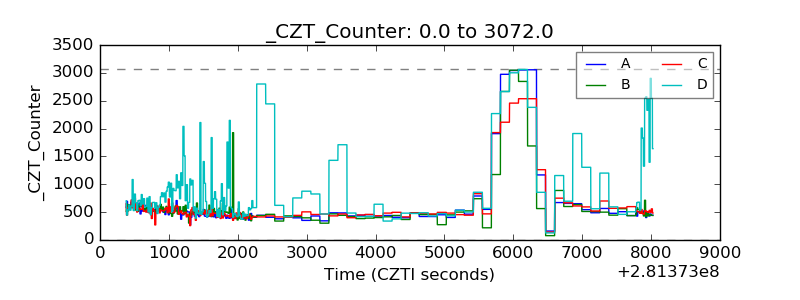 |
| +2.5 Volts monitor |  |
| +5 Volts monitor |  |
| _ROLL_ROT |  |
| _Roll_DEC | 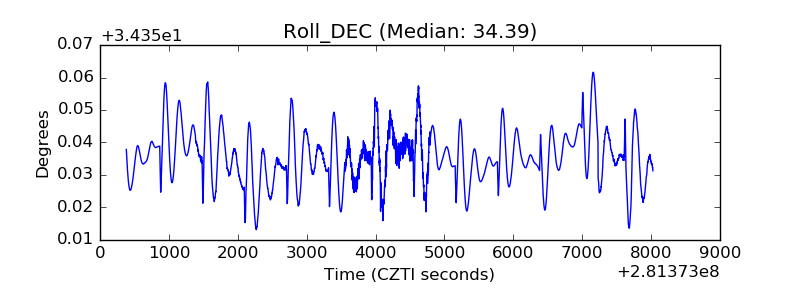 |
| _Roll_RA | 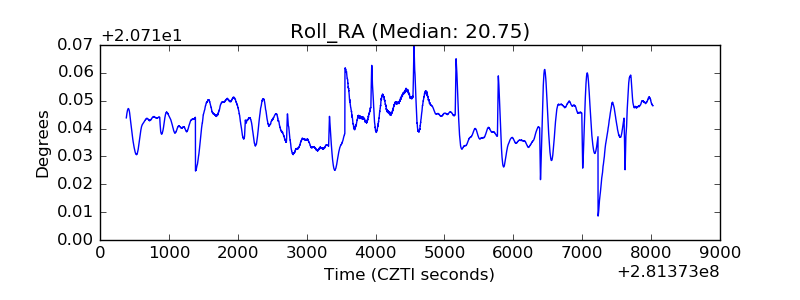 |
| Veto Counter | 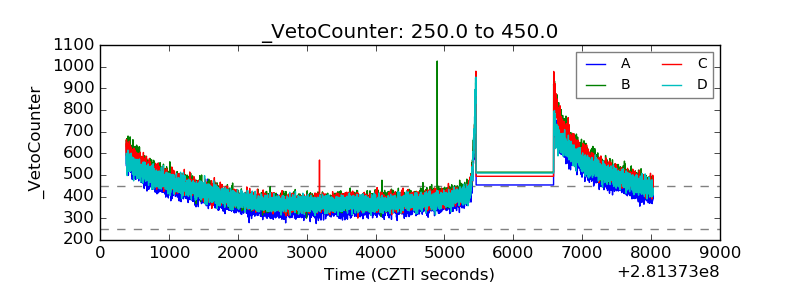 |