| Param | Original file | Final file |
|---|---|---|
| Filename | modeM0/AS1A05_185T04_9000002548_17179cztM0_level2.evt | modeM0/AS1A05_185T04_9000002548_17179cztM0_level2_quad_clean.evt |
| Size (bytes) | 494,562,240 | 97,070,400 |
| Size | 471.7 MB | 92.6 MB |
| Events in quadrant A | 3,191,445 | 648,370 |
| Events in quadrant B | 3,306,070 | 647,759 |
| Events in quadrant C | 3,332,499 | 612,256 |
| Events in quadrant D | 4,713,922 | 585,121 |
| Mode SS | |||
|---|---|---|---|
| Quadrant | BADHDUFLAG | Total packets | Discarded packets |
| A | 0 | 132 | 0 |
| B | 0 | 132 | 0 |
| C | 0 | 132 | 0 |
| D | 0 | 132 | 0 |
| Mode M9 | |||
|---|---|---|---|
| Quadrant | BADHDUFLAG | Total packets | Discarded packets |
| A | 0 | 17 | 0 |
| B | 0 | 18 | 0 |
| C | 0 | 18 | 0 |
| D | 0 | 18 | 0 |
| Mode M0 | |||
|---|---|---|---|
| Quadrant | BADHDUFLAG | Total packets | Discarded packets |
| A | 0 | 13625 | 2 |
| B | 0 | 14052 | 3 |
| C | 0 | 13873 | 2 |
| D | 0 | 18185 | 2 |
| Quadrant | Total seconds | Saturated seconds | Saturation percentage |
|---|---|---|---|
| A | 6386 | 35 | 0.548074% |
| B | 6385 | 53 | 0.830070% |
| C | 6385 | 73 | 1.143305% |
| D | 6385 | 424 | 6.640564% |
Noise dominated data is calculated using 1-second bins in cleaned event files. If a bin has >2000 counts, and if more than 50% of those come from <1% of pixels, then it is considered to be noise-dominated and hence unusable.
| Quadrant | # 1 sec bins | Bins with >0 counts | Bins with >2000 counts | High rate bins dominated by noise | Noise dominated (total time) | Noise dominated (detector-on time) | Marked lightcurve |
|---|---|---|---|---|---|---|---|
| A | 7611 | 6387 | 0 | 0 | 0.00% | 0.00% | 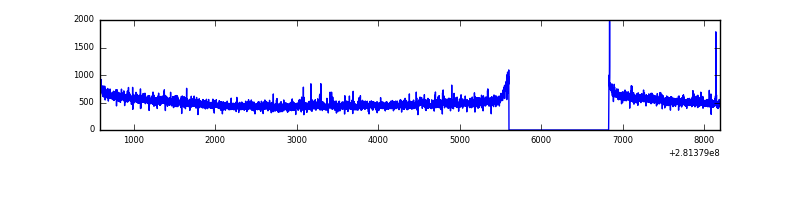 |
| B | 7610 | 6386 | 14 | 14 | 0.18% | 0.22% |  |
| C | 7610 | 6386 | 0 | 0 | 0.00% | 0.00% | 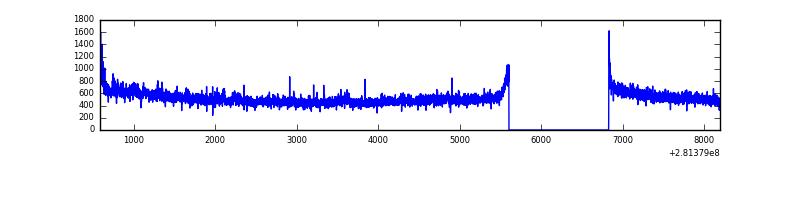 |
| D | 7610 | 6386 | 337 | 337 | 4.43% | 5.28% | 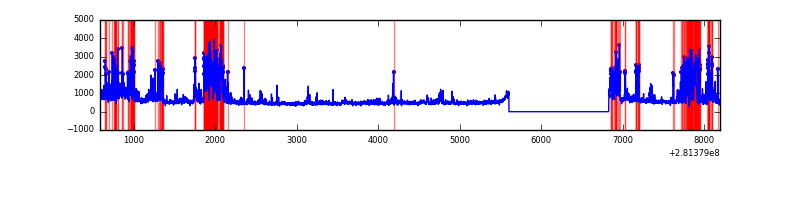 |
Top three noisy pixels from each quadrant. If the there are fewer than three noisy pixels in the level2.evt file, extra rows are filled as -1
| Pixel properties | Quadrant properties | ||||||
|---|---|---|---|---|---|---|---|
| Quadrant | DetID | PixID | Counts | Sigma | Mean | Median | Sigma |
| A | 12 | 189 | 61785 | 372.93 | 811 | 793 | 163.5 |
| A | 12 | 96 | 9883 | 55.58 | 811 | 793 | 163.5 |
| A | 0 | 226 | 7165 | 38.96 | 811 | 793 | 163.5 |
| B | 7 | 220 | 70822 | 463.24 | 803 | 783 | 151.2 |
| B | 0 | 197 | 36150 | 233.92 | 803 | 783 | 151.2 |
| B | 0 | 189 | 28231 | 181.54 | 803 | 783 | 151.2 |
| C | 3 | 233 | 192961 | 1076.04 | 772 | 778 | 178.6 |
| C | 14 | 238 | 119606 | 665.32 | 772 | 778 | 178.6 |
| C | 7 | 220 | 8734 | 44.55 | 772 | 778 | 178.6 |
| D | 5 | 222 | 702935 | 3802.95 | 773 | 751 | 184.6 |
| D | 1 | 52 | 603438 | 3264.09 | 773 | 751 | 184.6 |
| D | 15 | 0 | 358665 | 1938.42 | 773 | 751 | 184.6 |
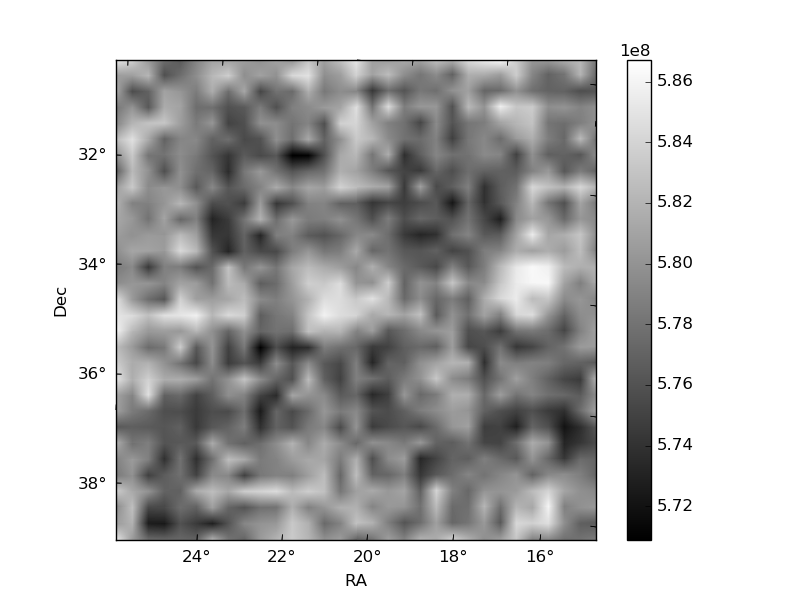
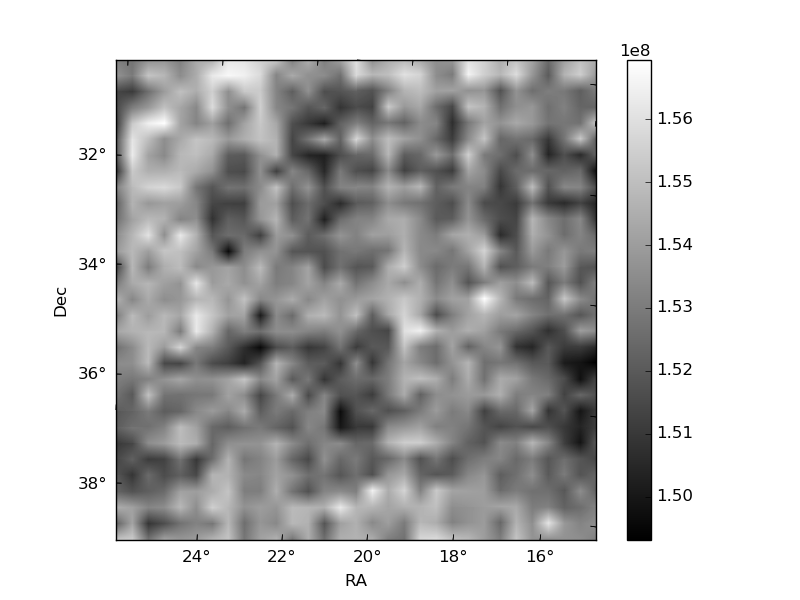
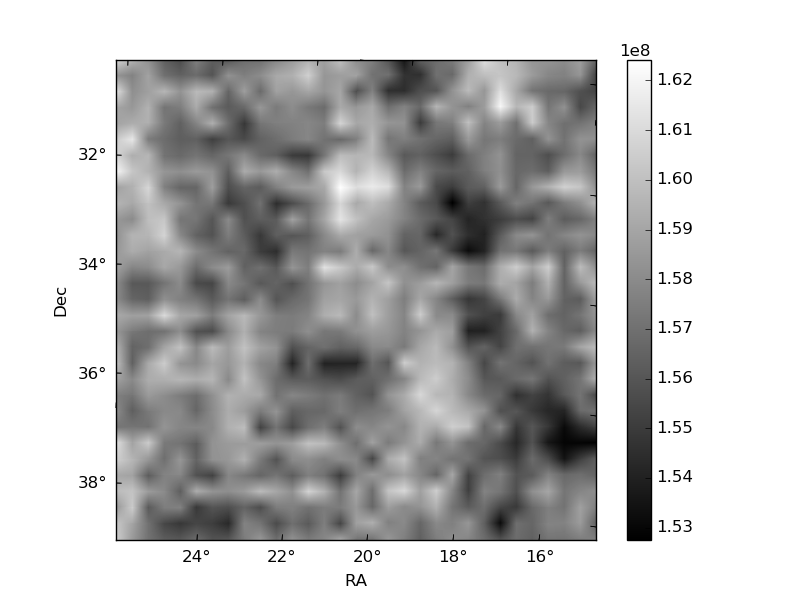
Histogram calculated using DETX and DETY for each event in the final _common_clean file
| Quadrant A | 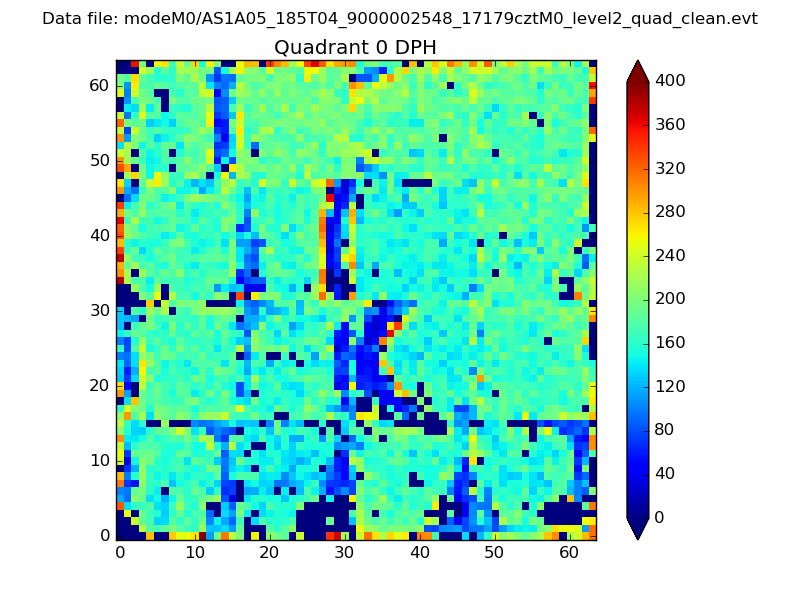 |
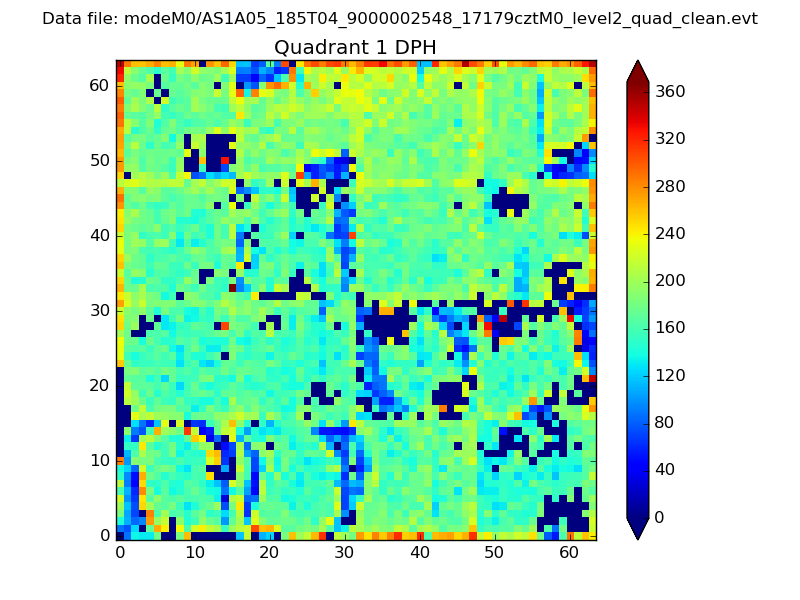 |
Quadrant B |
|---|---|---|---|
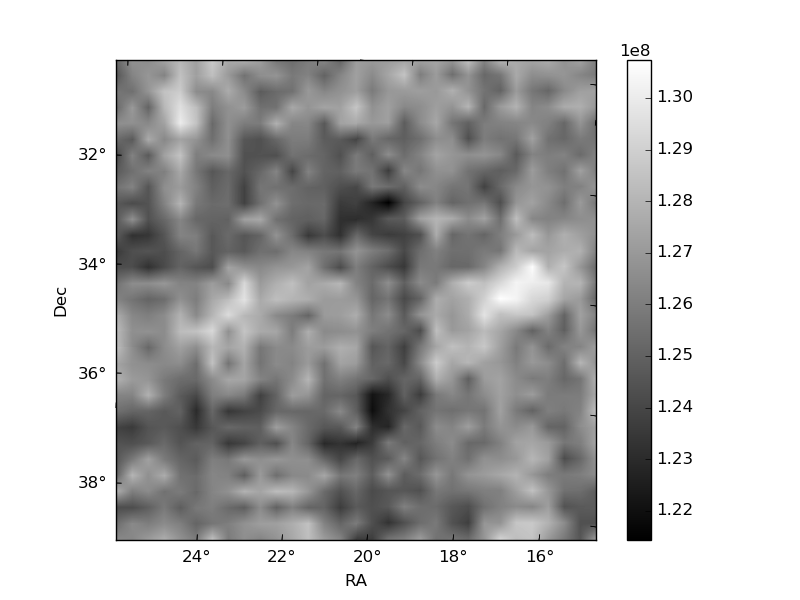
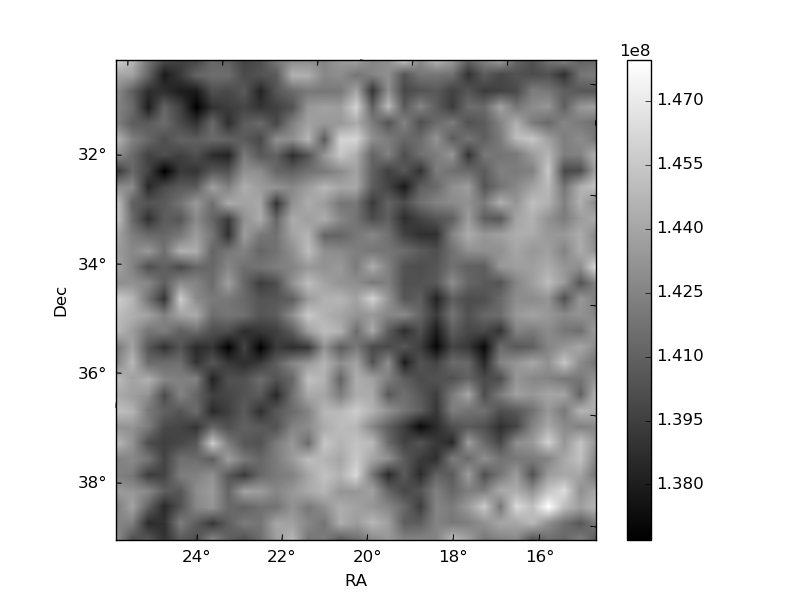
| Quadrant D | 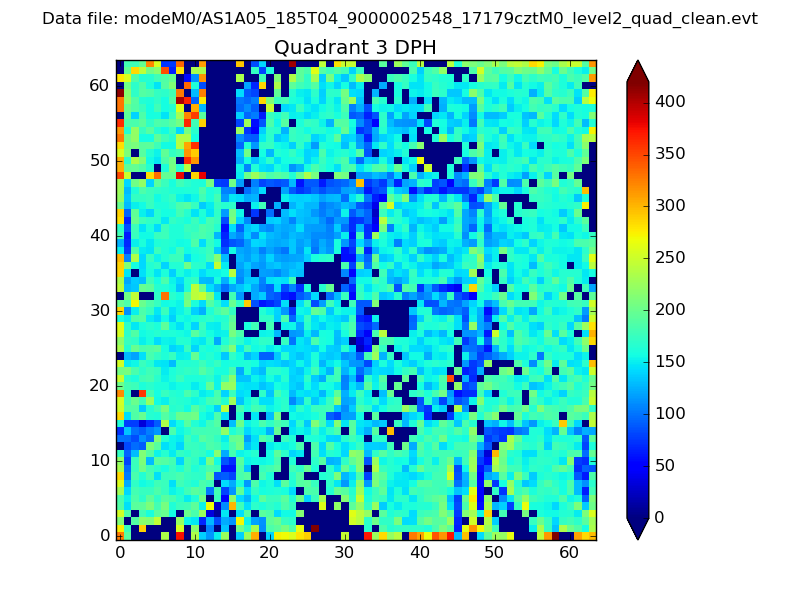 |
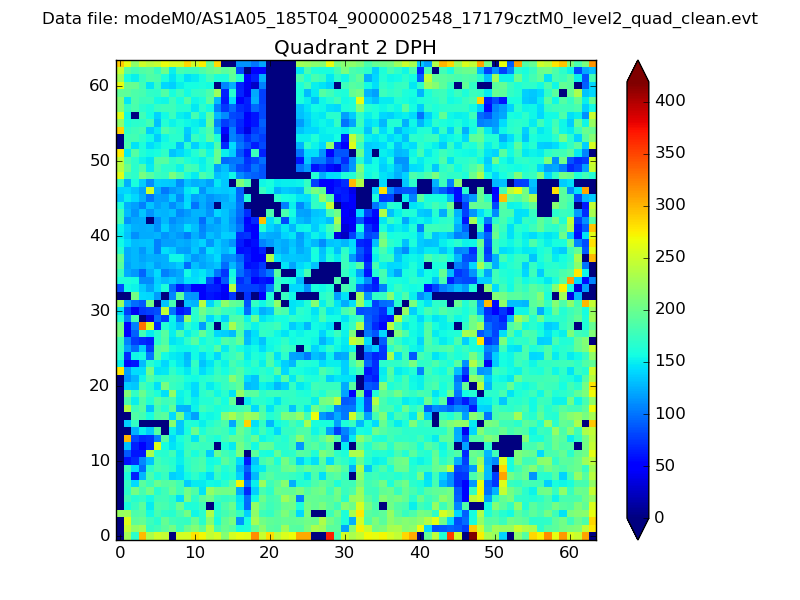 |
Quadrant C |
| Plot type | Count rate plots | Images |
|---|---|---|
| Comparison with Poisson distribution Blue bars denote a histogram of data divided into 1 sec bins. Red curve is a Poisson curve with rate = median count rate of data. |
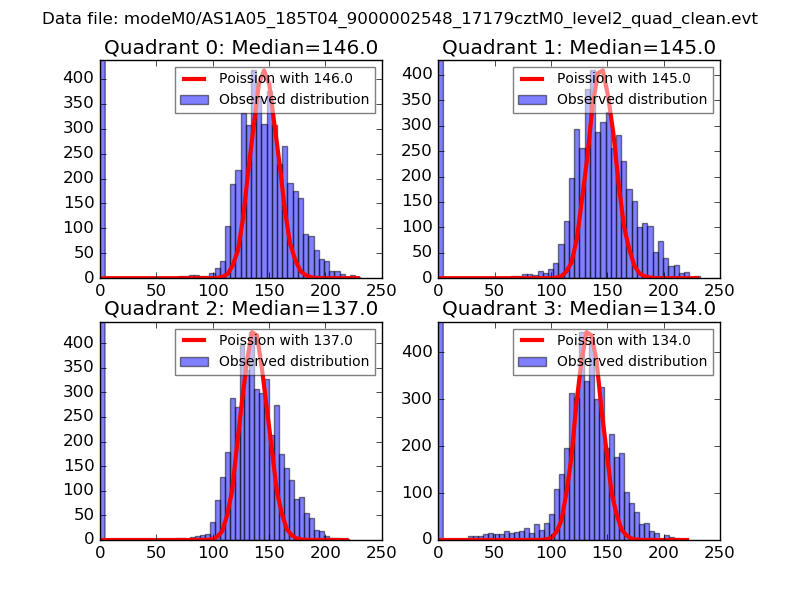 |
 |
| Quadrant-wise count rates Data is divided into 100 sec bins |
 |
|
| Module-wise count rates for Quadrant A Data is divided into 100 sec bins |
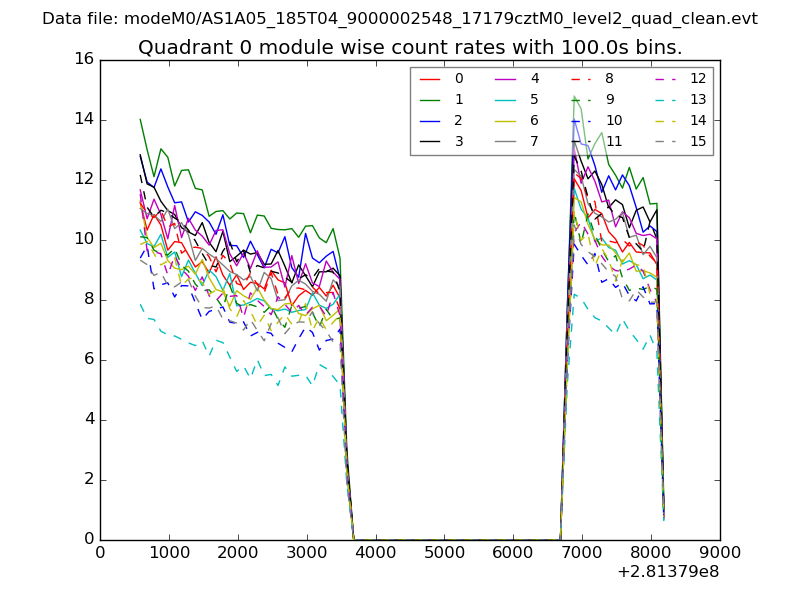 |
 |
| Module-wise count rates for Quadrant B Data is divided into 100 sec bins |
 |
 |
| Module-wise count rates for Quadrant C Data is divided into 100 sec bins |
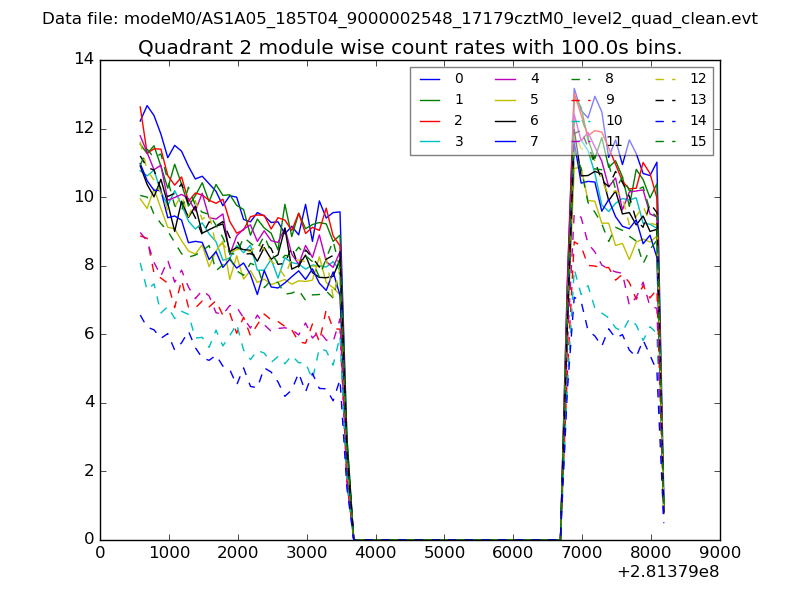 |
 |
| Module-wise count rates for Quadrant D Data is divided into 100 sec bins |
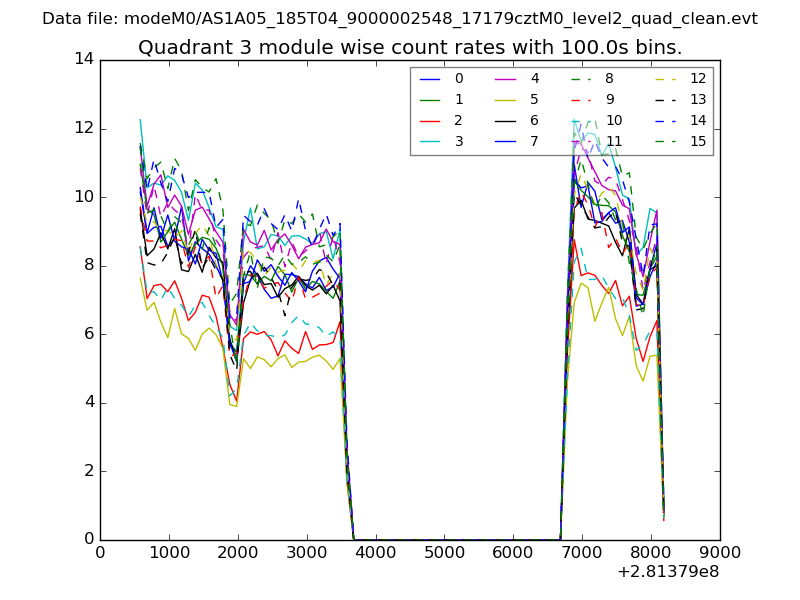 |
 |
| Parameter | Plot |
|---|---|
| CZT HV Monitor | 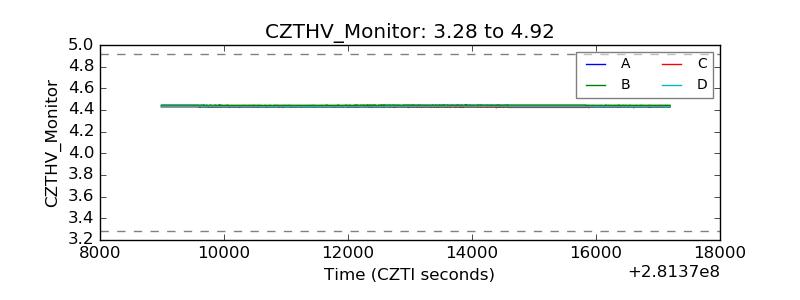 |
| D_VDD |  |
| Temperature 1 | 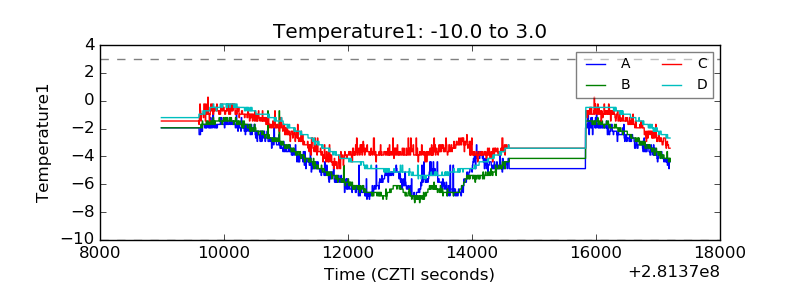 |
| Veto HV Monitor | 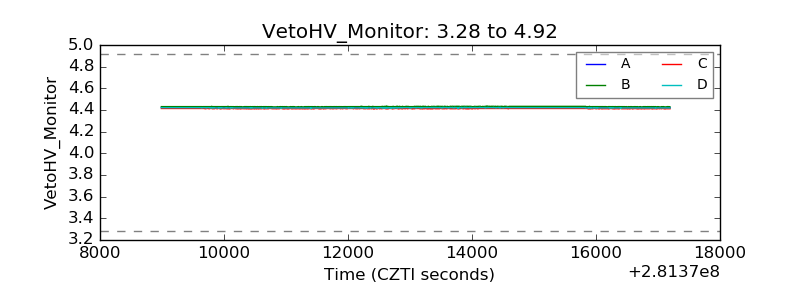 |
| Veto LLD |  |
| Alpha Counter | 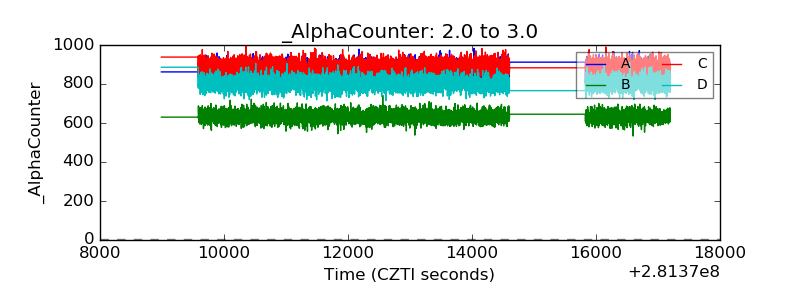 |
| _CPM_Rate |  |
| CZT Counter | 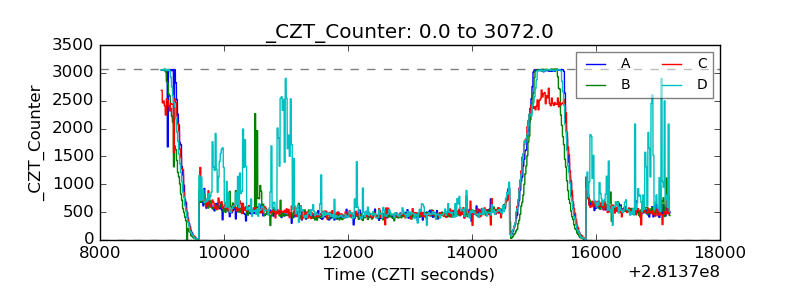 |
| +2.5 Volts monitor |  |
| +5 Volts monitor |  |
| _ROLL_ROT |  |
| _Roll_DEC | 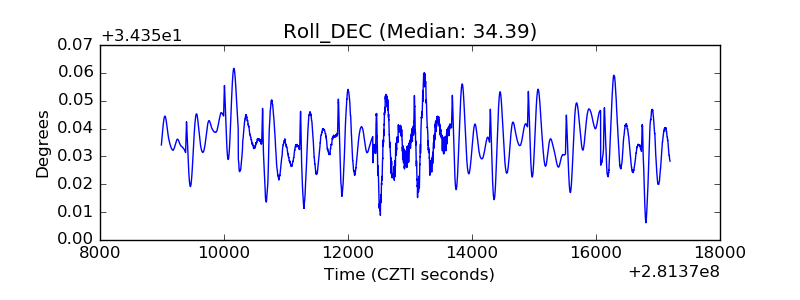 |
| _Roll_RA | 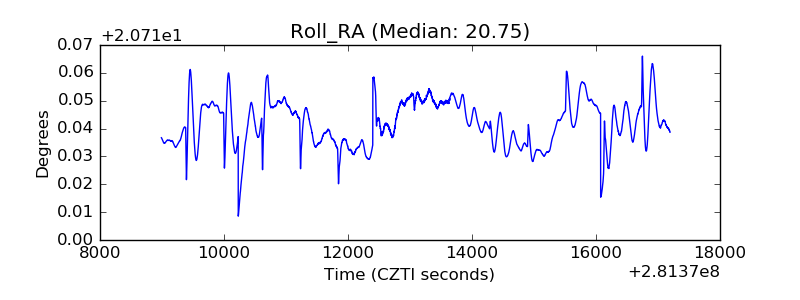 |
| Veto Counter | 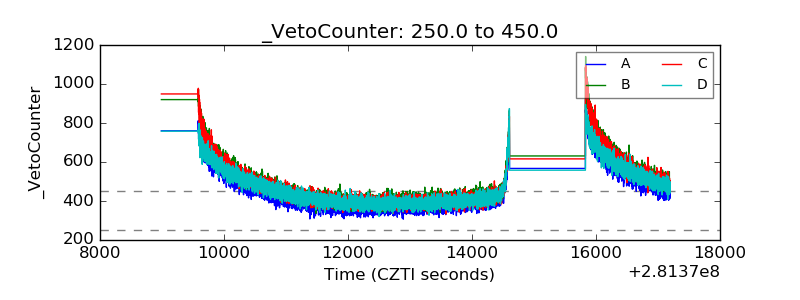 |