| Param | Original file | Final file |
|---|---|---|
| Filename | modeM0/AS1A05_185T04_9000002548_17180cztM0_level2.evt | modeM0/AS1A05_185T04_9000002548_17180cztM0_level2_quad_clean.evt |
| Size (bytes) | 466,827,840 | 94,072,320 |
| Size | 445.2 MB | 89.7 MB |
| Events in quadrant A | 3,111,106 | 625,255 |
| Events in quadrant B | 3,370,755 | 628,525 |
| Events in quadrant C | 3,159,317 | 594,191 |
| Events in quadrant D | 4,076,752 | 569,267 |
| Mode SS | |||
|---|---|---|---|
| Quadrant | BADHDUFLAG | Total packets | Discarded packets |
| A | 0 | 126 | 0 |
| B | 0 | 126 | 0 |
| C | 0 | 126 | 0 |
| D | 0 | 126 | 0 |
| Mode M9 | |||
|---|---|---|---|
| Quadrant | BADHDUFLAG | Total packets | Discarded packets |
| A | 0 | 15 | 0 |
| B | 0 | 16 | 0 |
| C | 0 | 16 | 0 |
| D | 0 | 16 | 0 |
| Mode M0 | |||
|---|---|---|---|
| Quadrant | BADHDUFLAG | Total packets | Discarded packets |
| A | 0 | 13184 | 2 |
| B | 0 | 14020 | 2 |
| C | 0 | 13214 | 2 |
| D | 0 | 16391 | 2 |
| Quadrant | Total seconds | Saturated seconds | Saturation percentage |
|---|---|---|---|
| A | 6183 | 45 | 0.727802% |
| B | 6183 | 56 | 0.905709% |
| C | 6183 | 74 | 1.196830% |
| D | 6182 | 300 | 4.852798% |
Noise dominated data is calculated using 1-second bins in cleaned event files. If a bin has >2000 counts, and if more than 50% of those come from <1% of pixels, then it is considered to be noise-dominated and hence unusable.
| Quadrant | # 1 sec bins | Bins with >0 counts | Bins with >2000 counts | High rate bins dominated by noise | Noise dominated (total time) | Noise dominated (detector-on time) | Marked lightcurve |
|---|---|---|---|---|---|---|---|
| A | 7488 | 6184 | 0 | 0 | 0.00% | 0.00% | 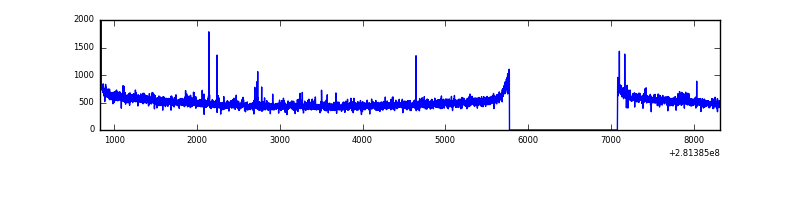 |
| B | 7488 | 6184 | 4 | 4 | 0.05% | 0.06% | 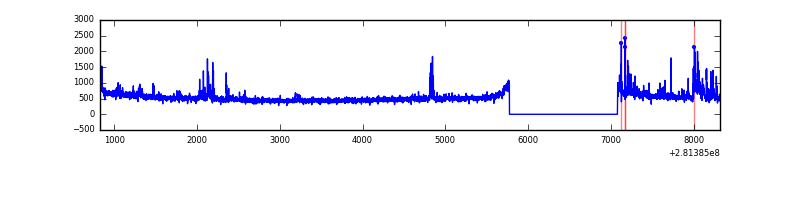 |
| C | 7488 | 6184 | 0 | 0 | 0.00% | 0.00% | 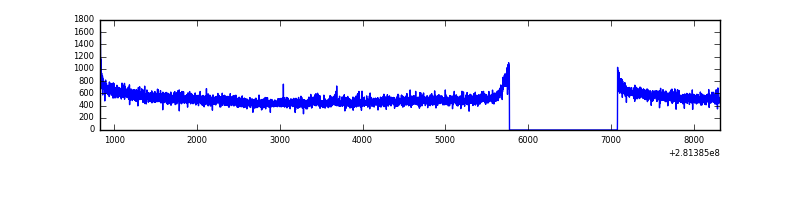 |
| D | 7487 | 6183 | 228 | 228 | 3.05% | 3.69% | 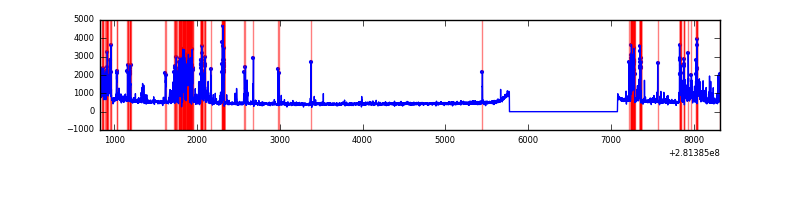 |
Top three noisy pixels from each quadrant. If the there are fewer than three noisy pixels in the level2.evt file, extra rows are filled as -1
| Pixel properties | Quadrant properties | ||||||
|---|---|---|---|---|---|---|---|
| Quadrant | DetID | PixID | Counts | Sigma | Mean | Median | Sigma |
| A | 12 | 189 | 29822 | 181.72 | 797 | 781 | 159.8 |
| A | 12 | 96 | 13245 | 77.99 | 797 | 781 | 159.8 |
| A | 0 | 226 | 7121 | 39.67 | 797 | 781 | 159.8 |
| B | 0 | 189 | 90571 | 605.33 | 797 | 779 | 148.3 |
| B | 0 | 197 | 49030 | 325.29 | 797 | 779 | 148.3 |
| B | 0 | 219 | 47516 | 315.08 | 797 | 779 | 148.3 |
| C | 14 | 238 | 118748 | 663.46 | 766 | 771 | 177.8 |
| C | 3 | 233 | 47469 | 262.61 | 766 | 771 | 177.8 |
| C | 13 | 61 | 5591 | 27.11 | 766 | 771 | 177.8 |
| D | 15 | 0 | 548671 | 2981.31 | 766 | 745 | 183.8 |
| D | 5 | 222 | 450160 | 2445.3 | 766 | 745 | 183.8 |
| D | 12 | 233 | 57628 | 309.5 | 766 | 745 | 183.8 |
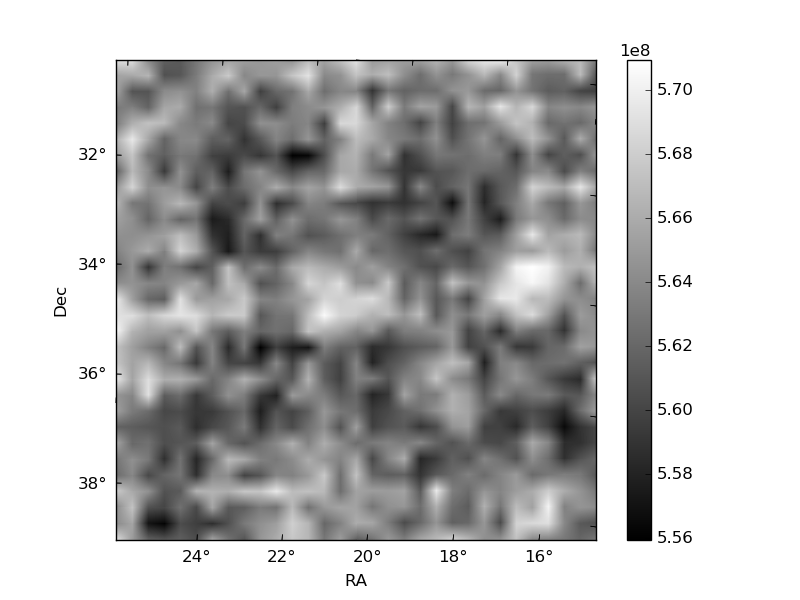
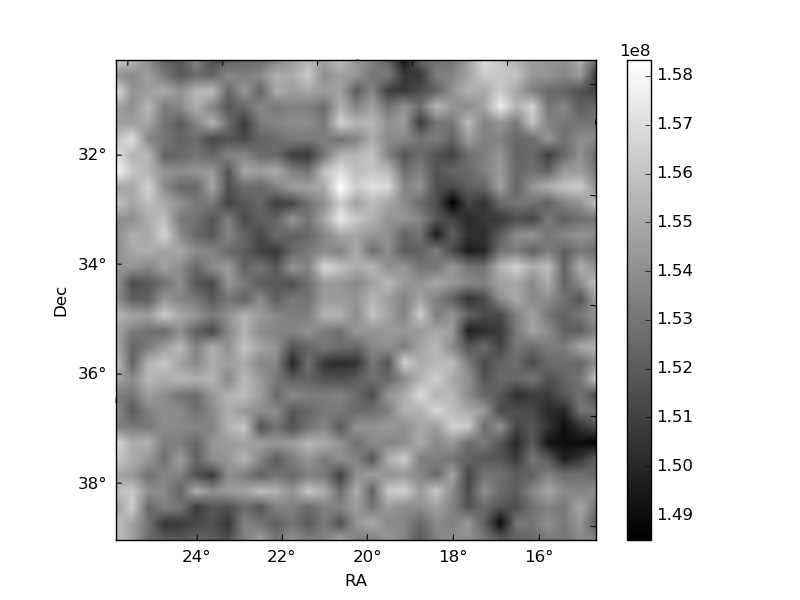
Histogram calculated using DETX and DETY for each event in the final _common_clean file
| Quadrant A | 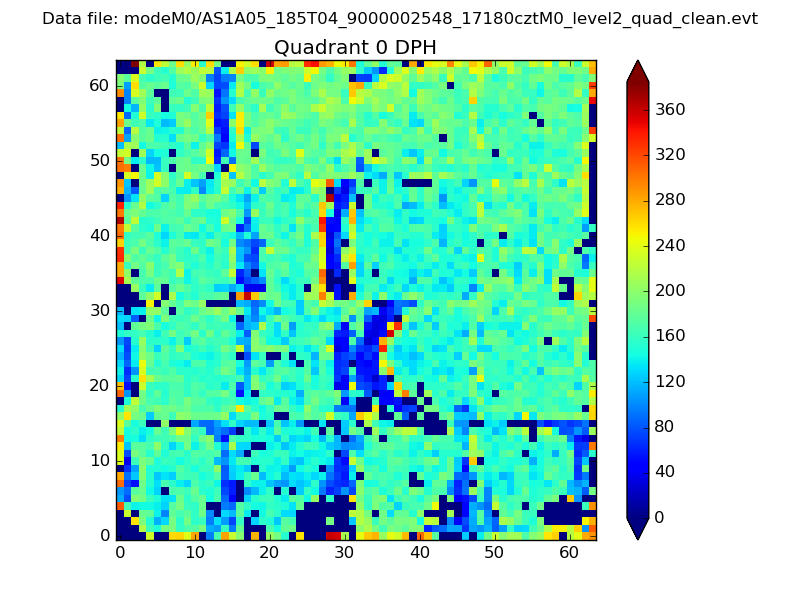 |
 |
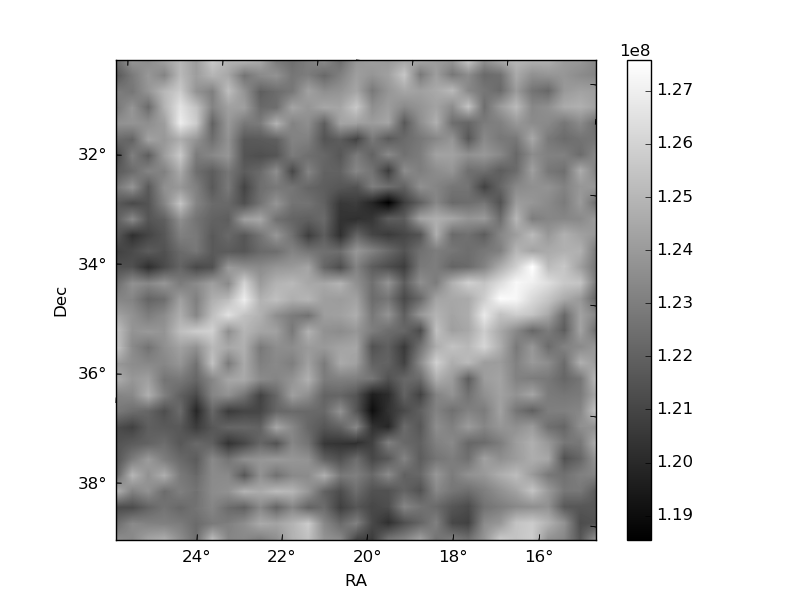
Quadrant B |
|---|---|---|---|
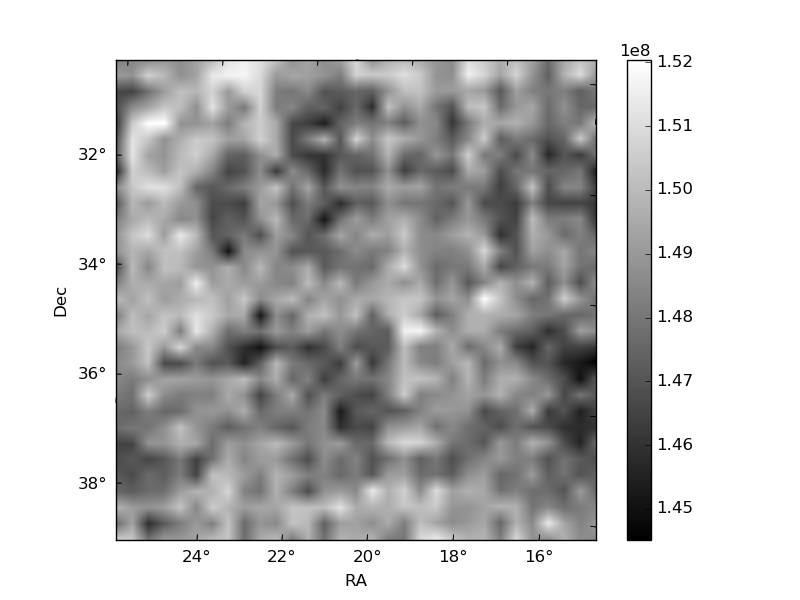
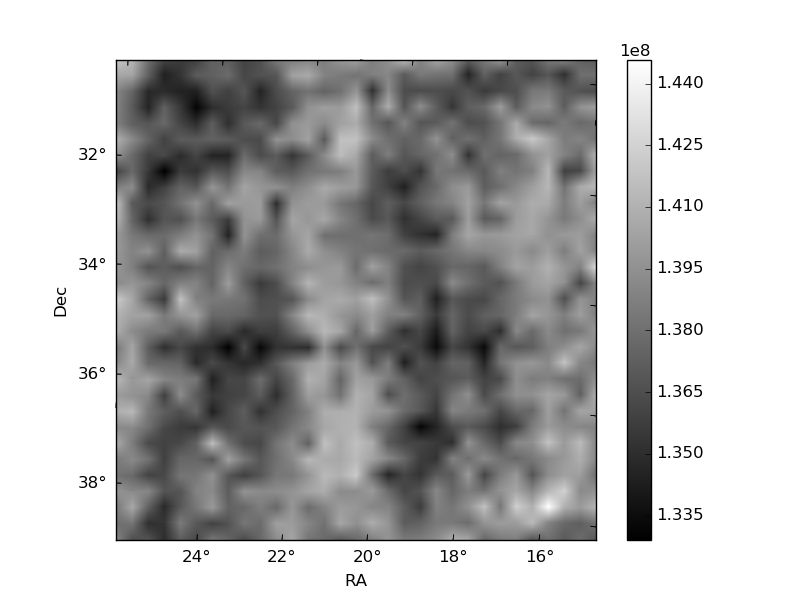
| Quadrant D | 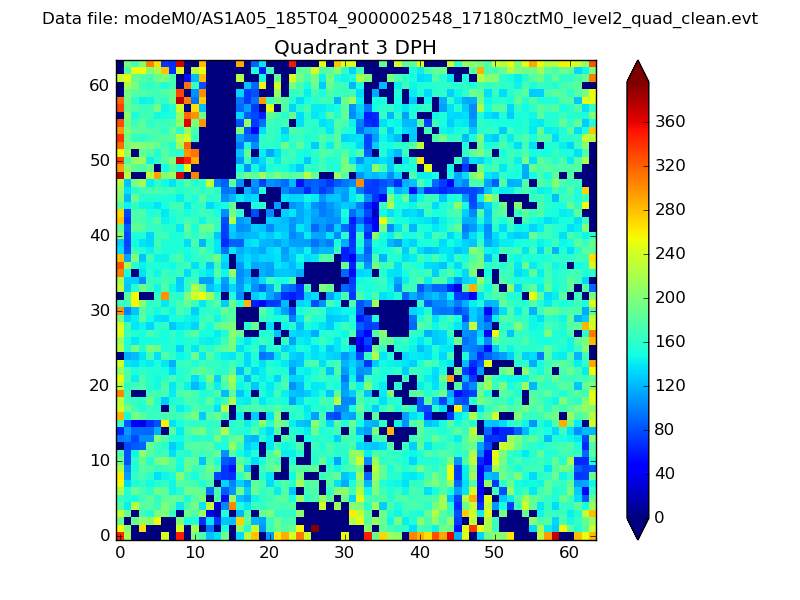 |
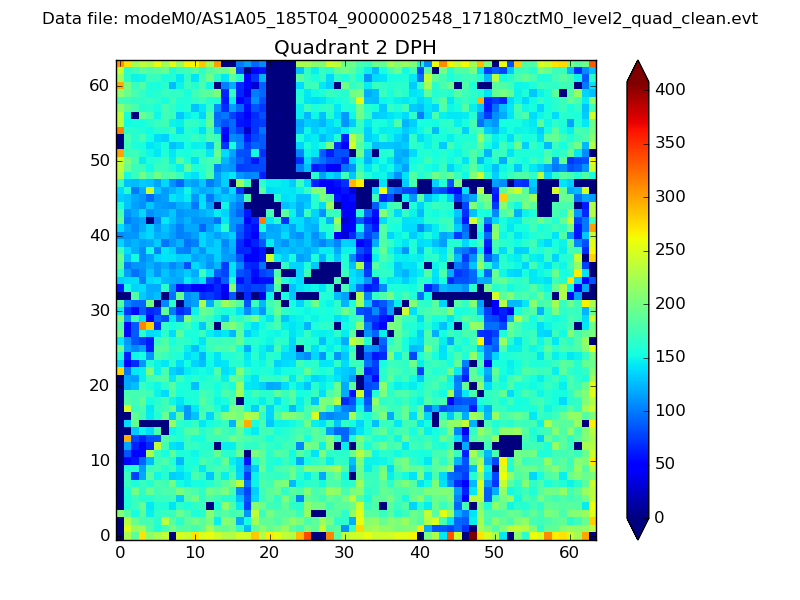 |
Quadrant C |
| Plot type | Count rate plots | Images |
|---|---|---|
| Comparison with Poisson distribution Blue bars denote a histogram of data divided into 1 sec bins. Red curve is a Poisson curve with rate = median count rate of data. |
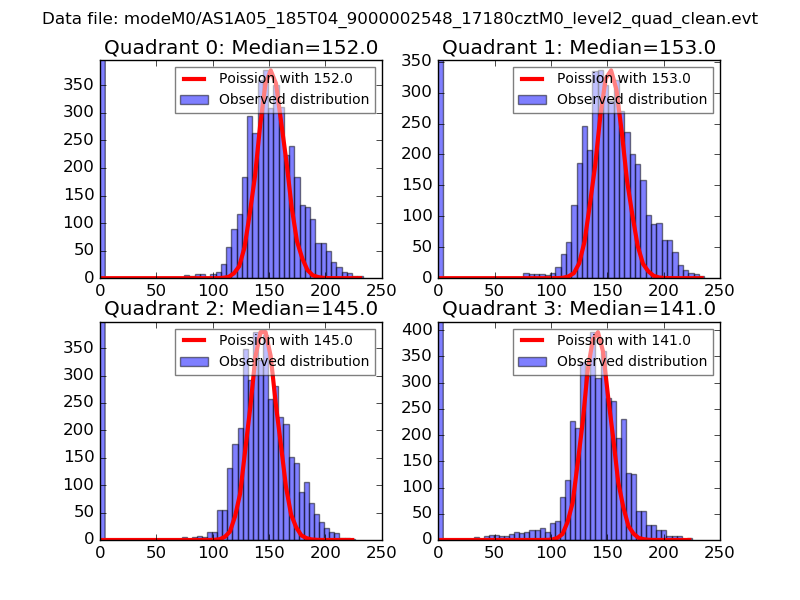 |
 |
| Quadrant-wise count rates Data is divided into 100 sec bins |
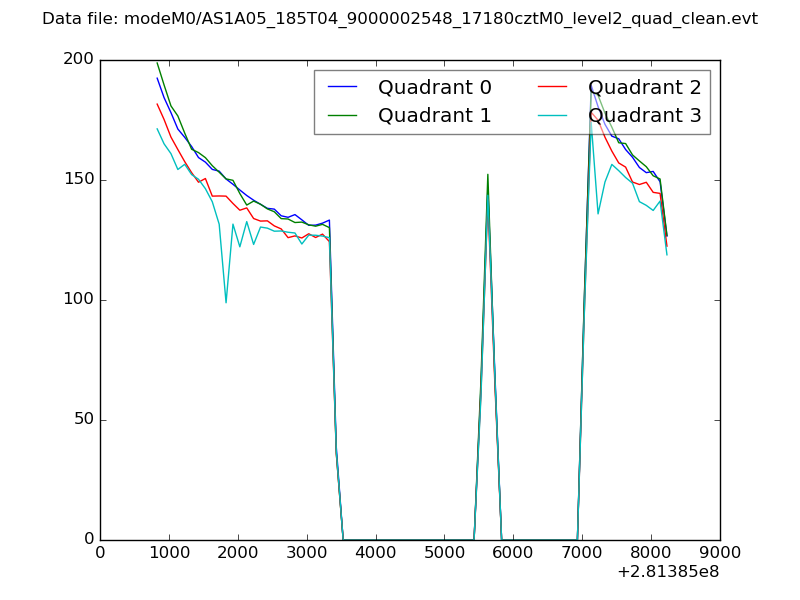 |
|
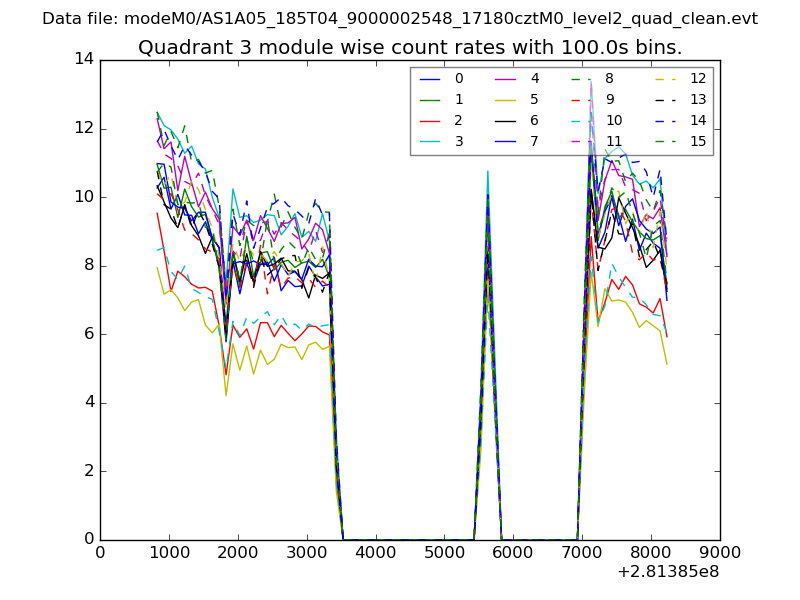
| Module-wise count rates for Quadrant A Data is divided into 100 sec bins |
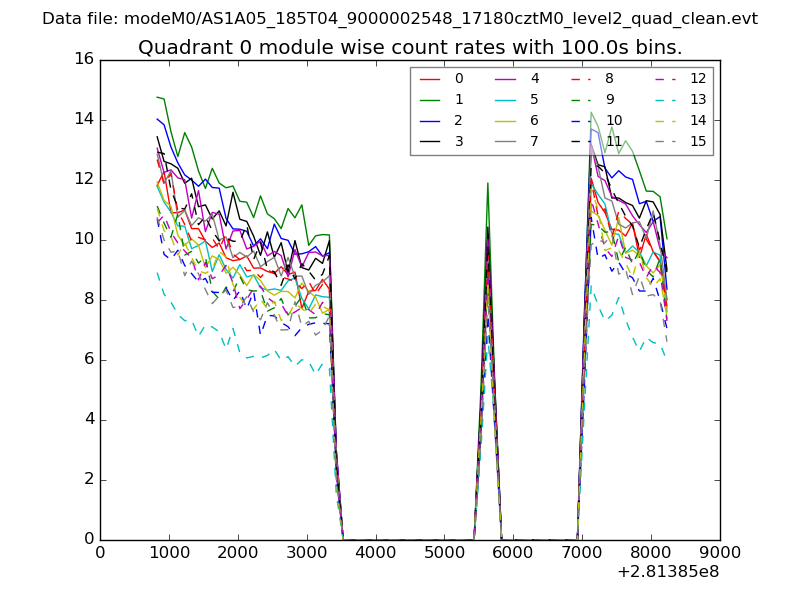 |
 |
| Module-wise count rates for Quadrant B Data is divided into 100 sec bins |
 |
 |
| Module-wise count rates for Quadrant C Data is divided into 100 sec bins |
 |
 |
| Module-wise count rates for Quadrant D Data is divided into 100 sec bins |
 |
 |
| Parameter | Plot |
|---|---|
| CZT HV Monitor | 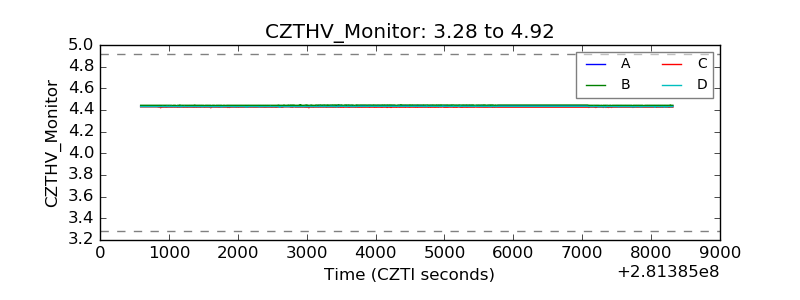 |
| D_VDD | 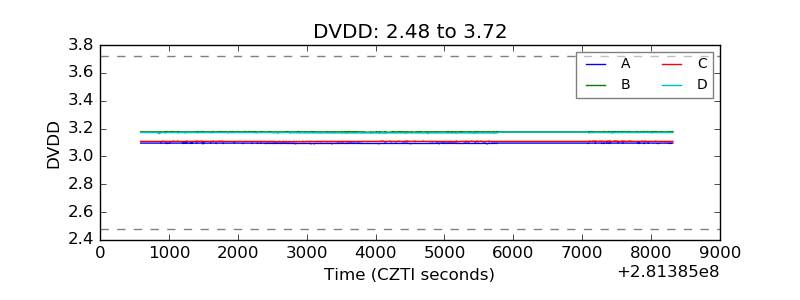 |
| Temperature 1 | 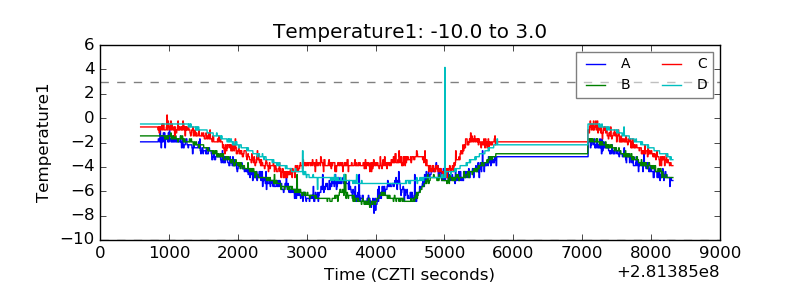 |
| Veto HV Monitor | 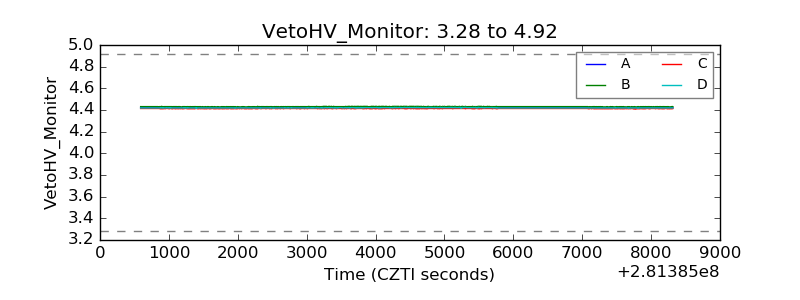 |
| Veto LLD | 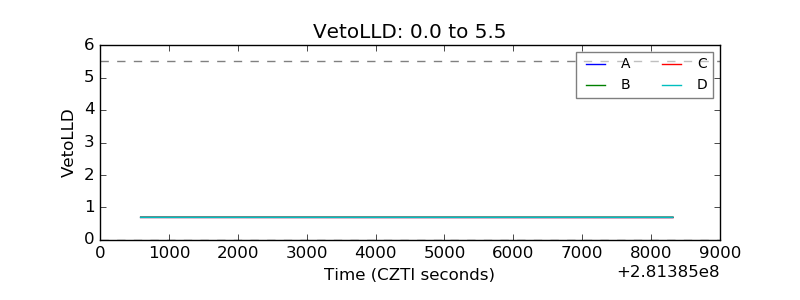 |
| Alpha Counter | 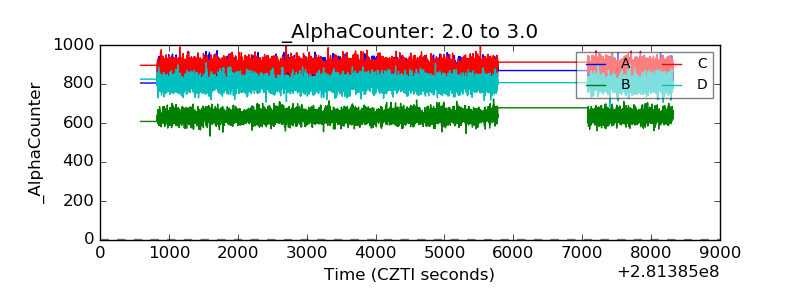 |
| _CPM_Rate | 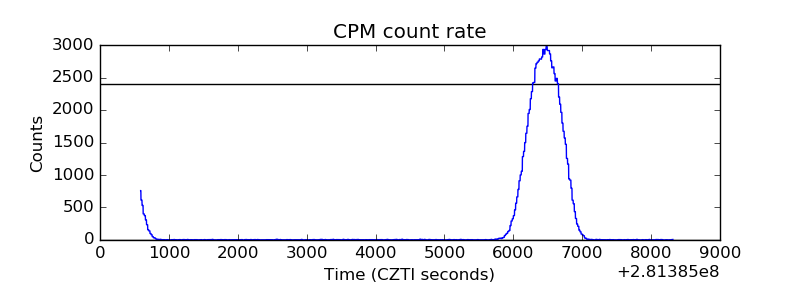 |
| CZT Counter |  |
| +2.5 Volts monitor |  |
| +5 Volts monitor |  |
| _ROLL_ROT | 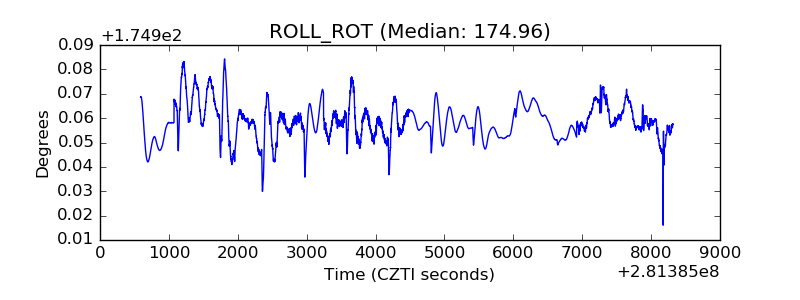 |
| _Roll_DEC | 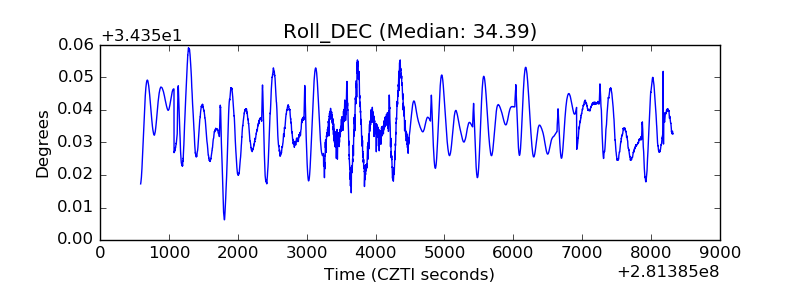 |
| _Roll_RA | 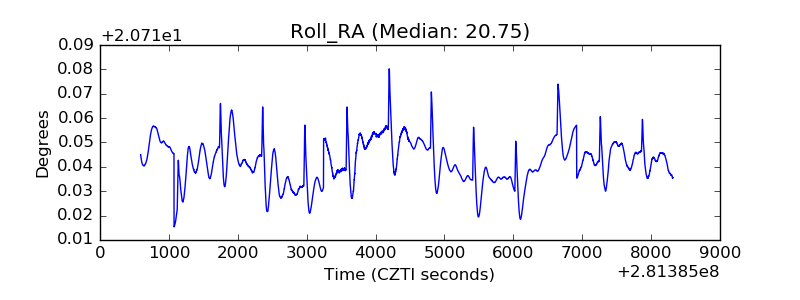 |
| Veto Counter | 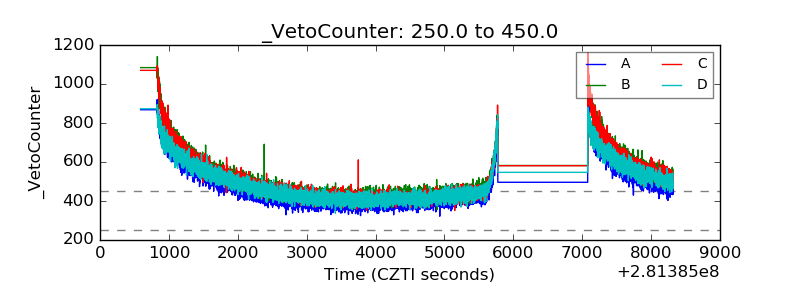 |