| Param | Original file | Final file |
|---|---|---|
| Filename | modeM0/AS1A05_185T04_9000002548_17181cztM0_level2.evt | modeM0/AS1A05_185T04_9000002548_17181cztM0_level2_quad_clean.evt |
| Size (bytes) | 464,428,800 | 94,294,080 |
| Size | 442.9 MB | 89.9 MB |
| Events in quadrant A | 3,095,984 | 622,361 |
| Events in quadrant B | 3,468,589 | 628,873 |
| Events in quadrant C | 3,138,379 | 597,420 |
| Events in quadrant D | 3,940,075 | 572,896 |
| Mode SS | |||
|---|---|---|---|
| Quadrant | BADHDUFLAG | Total packets | Discarded packets |
| A | 0 | 128 | 0 |
| B | 0 | 128 | 0 |
| C | 0 | 128 | 0 |
| D | 0 | 128 | 0 |
| Mode M9 | |||
|---|---|---|---|
| Quadrant | BADHDUFLAG | Total packets | Discarded packets |
| A | 0 | 21 | 0 |
| B | 0 | 22 | 0 |
| C | 0 | 22 | 0 |
| D | 0 | 22 | 0 |
| Mode M0 | |||
|---|---|---|---|
| Quadrant | BADHDUFLAG | Total packets | Discarded packets |
| A | 0 | 13084 | 2 |
| B | 0 | 14231 | 2 |
| C | 0 | 13117 | 2 |
| D | 0 | 15822 | 3 |
| Quadrant | Total seconds | Saturated seconds | Saturation percentage |
|---|---|---|---|
| A | 6211 | 52 | 0.837224% |
| B | 6211 | 106 | 1.706649% |
| C | 6211 | 89 | 1.432942% |
| D | 6210 | 220 | 3.542673% |
Noise dominated data is calculated using 1-second bins in cleaned event files. If a bin has >2000 counts, and if more than 50% of those come from <1% of pixels, then it is considered to be noise-dominated and hence unusable.
| Quadrant | # 1 sec bins | Bins with >0 counts | Bins with >2000 counts | High rate bins dominated by noise | Noise dominated (total time) | Noise dominated (detector-on time) | Marked lightcurve |
|---|---|---|---|---|---|---|---|
| A | 7546 | 6212 | 0 | 0 | 0.00% | 0.00% | 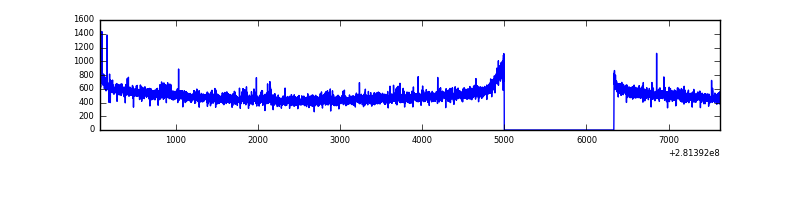 |
| B | 7546 | 6211 | 18 | 18 | 0.24% | 0.29% | 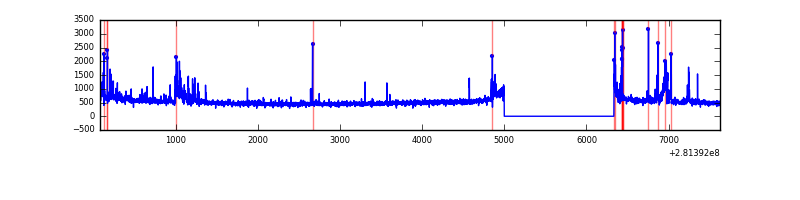 |
| C | 7546 | 6212 | 0 | 0 | 0.00% | 0.00% | 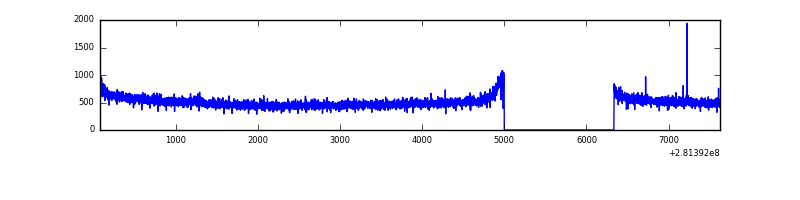 |
| D | 7545 | 6211 | 103 | 103 | 1.37% | 1.66% | 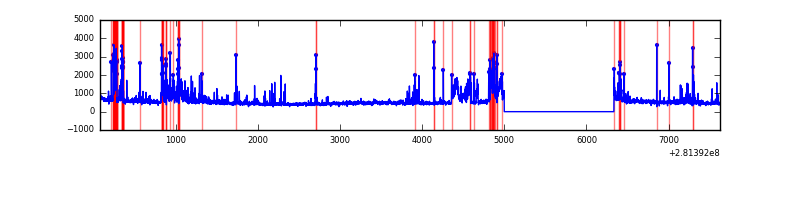 |
Top three noisy pixels from each quadrant. If the there are fewer than three noisy pixels in the level2.evt file, extra rows are filled as -1
| Pixel properties | Quadrant properties | ||||||
|---|---|---|---|---|---|---|---|
| Quadrant | DetID | PixID | Counts | Sigma | Mean | Median | Sigma |
| A | 12 | 189 | 26766 | 161.78 | 797 | 782 | 160.6 |
| A | 0 | 226 | 6953 | 38.42 | 797 | 782 | 160.6 |
| A | 12 | 96 | 6263 | 34.13 | 797 | 782 | 160.6 |
| B | 0 | 189 | 127481 | 849.98 | 799 | 779 | 149.1 |
| B | 0 | 219 | 60414 | 400.06 | 799 | 779 | 149.1 |
| B | 0 | 197 | 49069 | 323.95 | 799 | 779 | 149.1 |
| C | 14 | 238 | 120425 | 666.93 | 770 | 778 | 179.4 |
| C | 3 | 233 | 13654 | 71.77 | 770 | 778 | 179.4 |
| C | 13 | 61 | 5439 | 25.98 | 770 | 778 | 179.4 |
| D | 5 | 222 | 715958 | 3856.51 | 767 | 746 | 185.5 |
| D | 15 | 0 | 143912 | 771.97 | 767 | 746 | 185.5 |
| D | 12 | 233 | 82406 | 440.32 | 767 | 746 | 185.5 |
Histogram calculated using DETX and DETY for each event in the final _common_clean file
| Quadrant A | 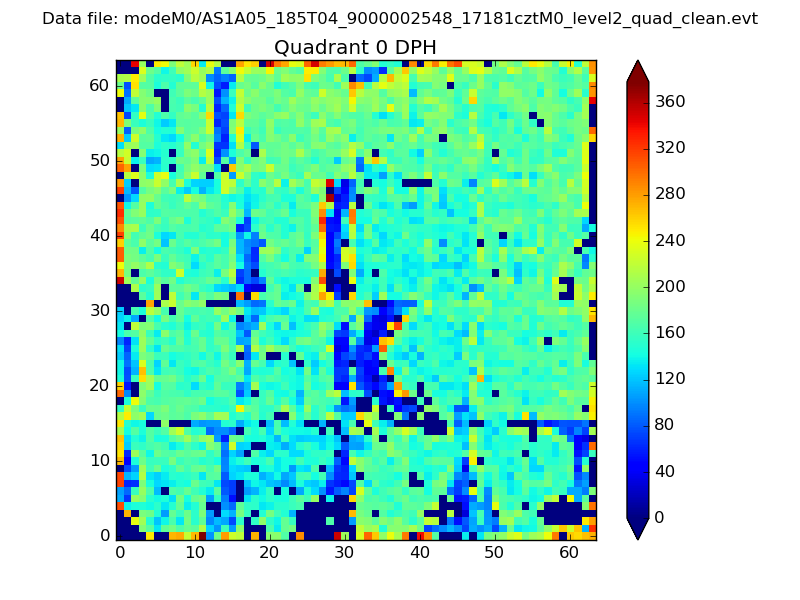 |
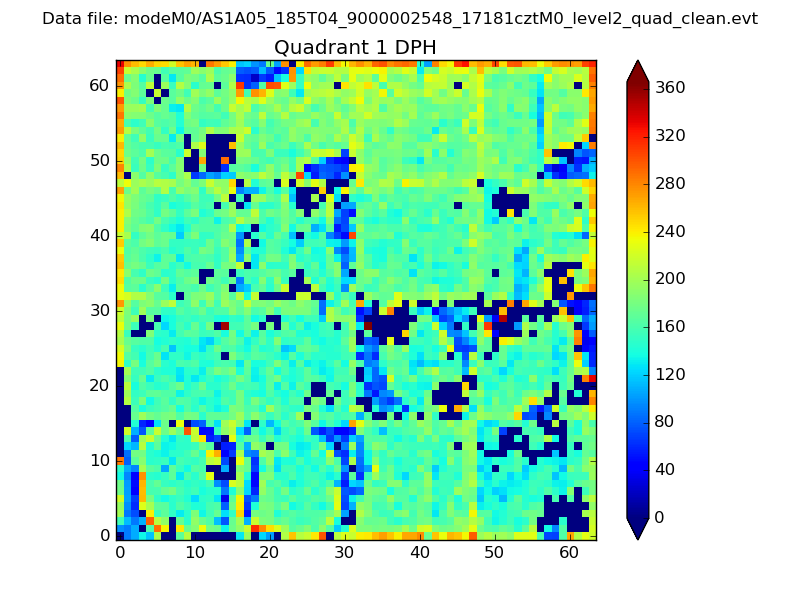 |
Quadrant B |
|---|---|---|---|
| Quadrant D | 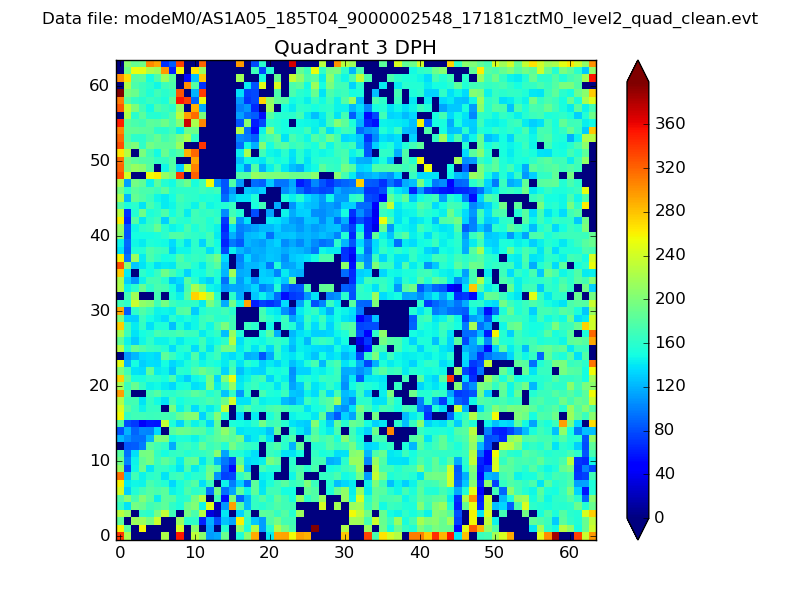 |
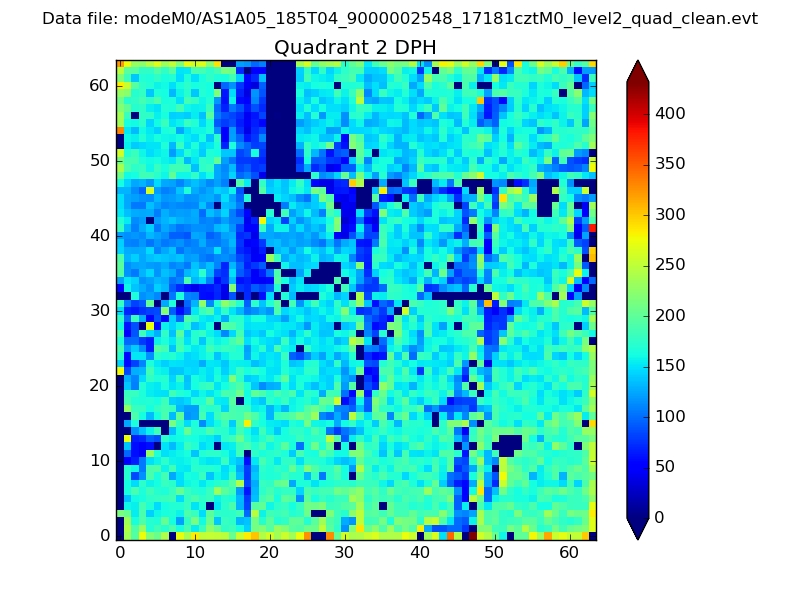 |
Quadrant C |
| Plot type | Count rate plots | Images |
|---|---|---|
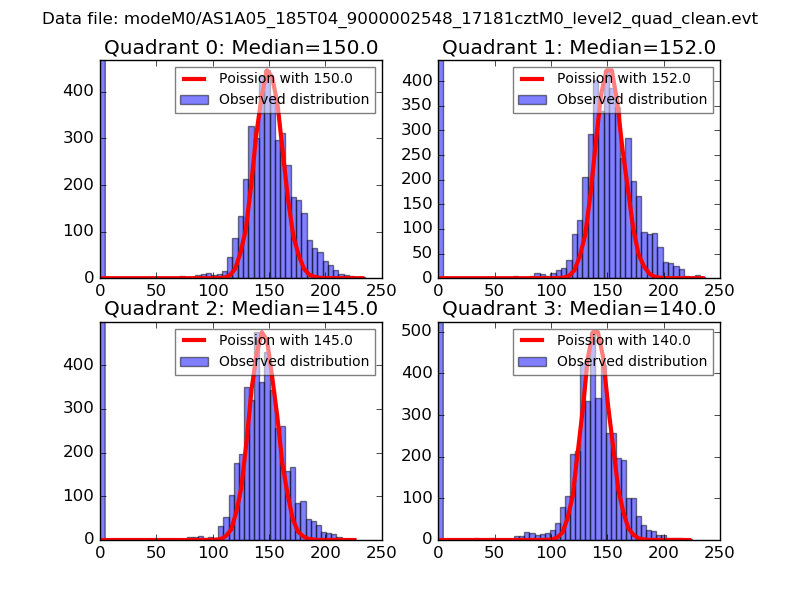
| Comparison with Poisson distribution Blue bars denote a histogram of data divided into 1 sec bins. Red curve is a Poisson curve with rate = median count rate of data. |
 |
 |
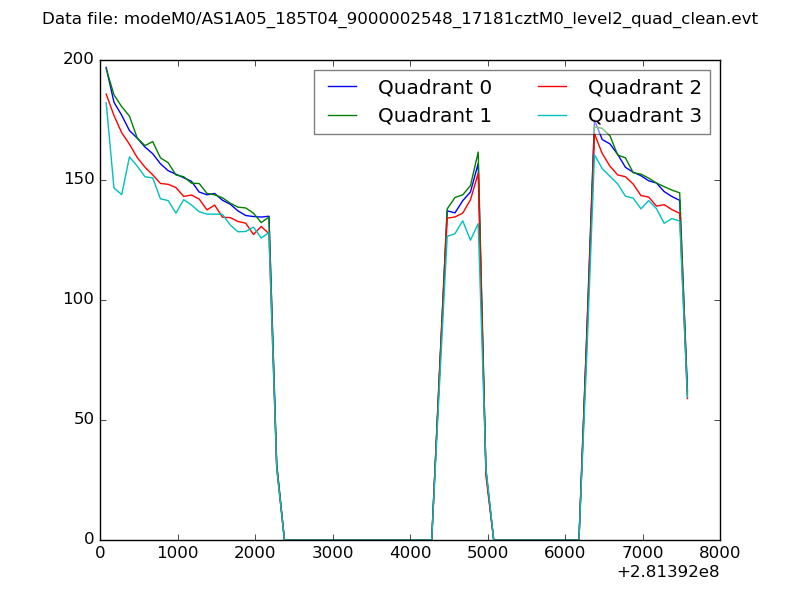
| Quadrant-wise count rates Data is divided into 100 sec bins |
 |
|
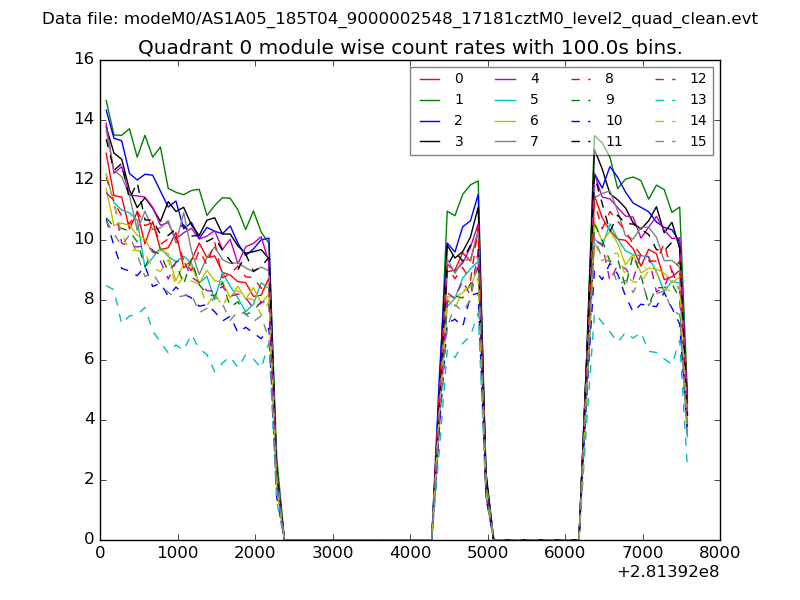
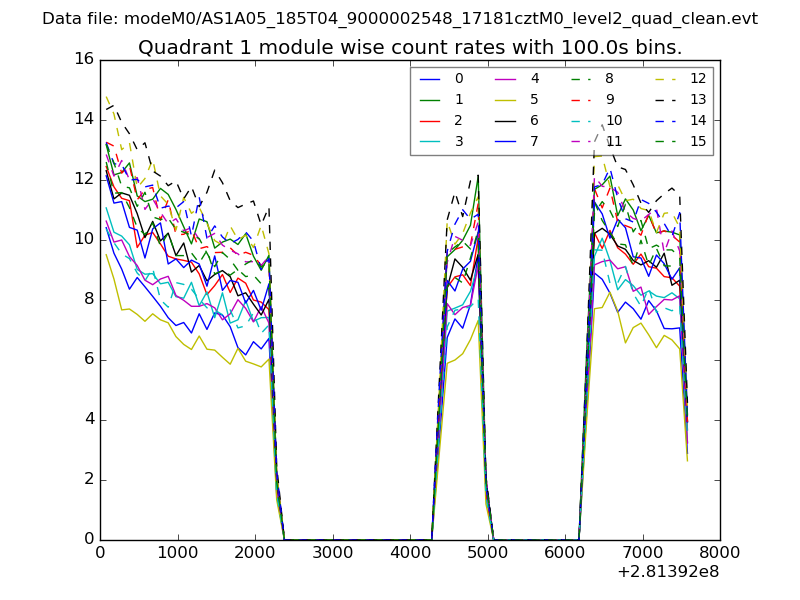
| Module-wise count rates for Quadrant A Data is divided into 100 sec bins |
 |
 |
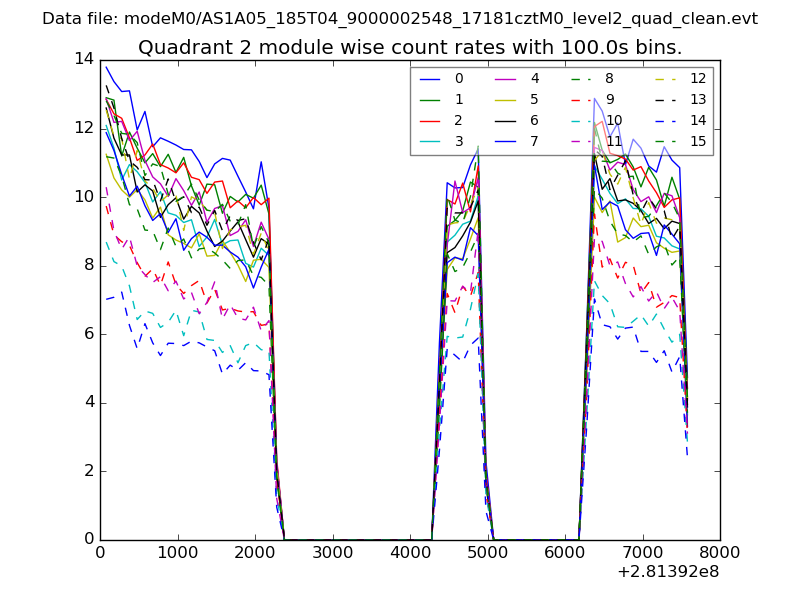
| Module-wise count rates for Quadrant B Data is divided into 100 sec bins |
 |
 |
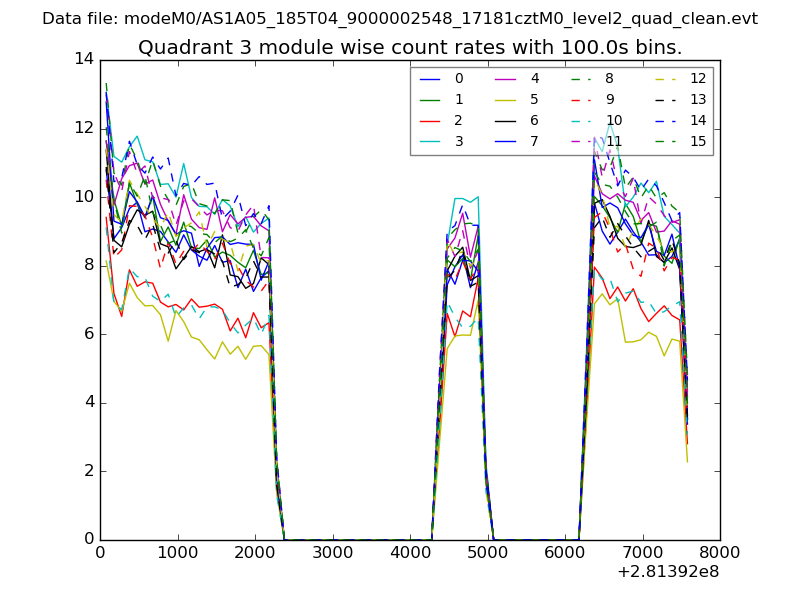
| Module-wise count rates for Quadrant C Data is divided into 100 sec bins |
 |
 |
| Module-wise count rates for Quadrant D Data is divided into 100 sec bins |
 |
 |
| Parameter | Plot |
|---|---|
| CZT HV Monitor | 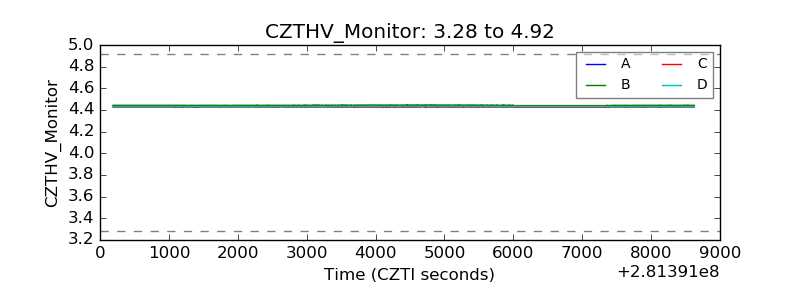 |
| D_VDD | 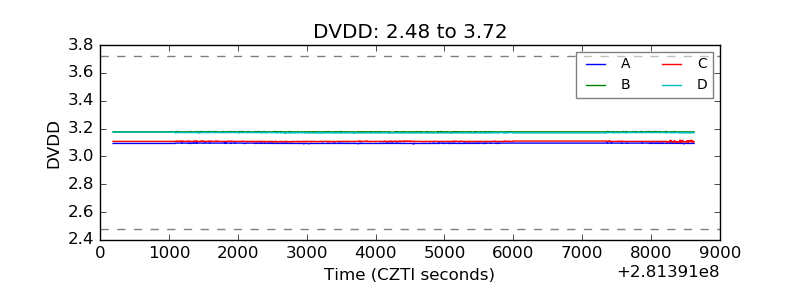 |
| Temperature 1 |  |
| Veto HV Monitor | 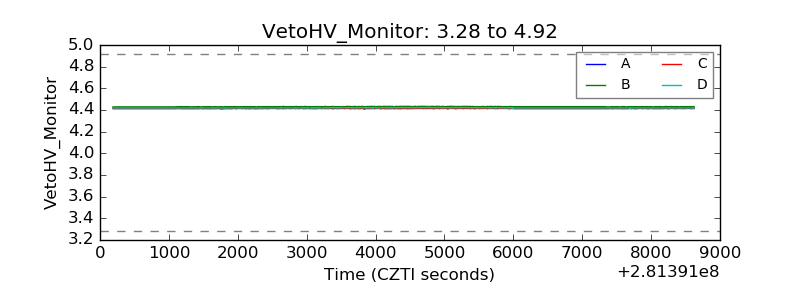 |
| Veto LLD | 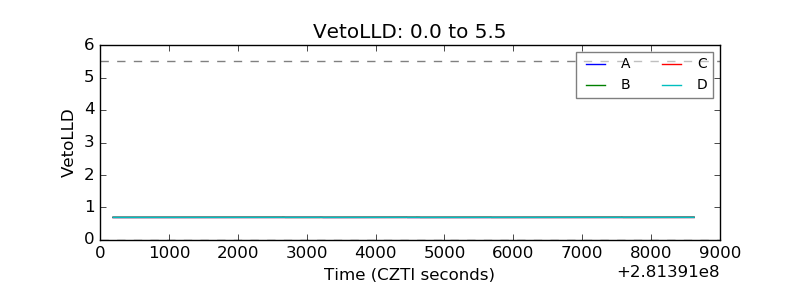 |
| Alpha Counter | 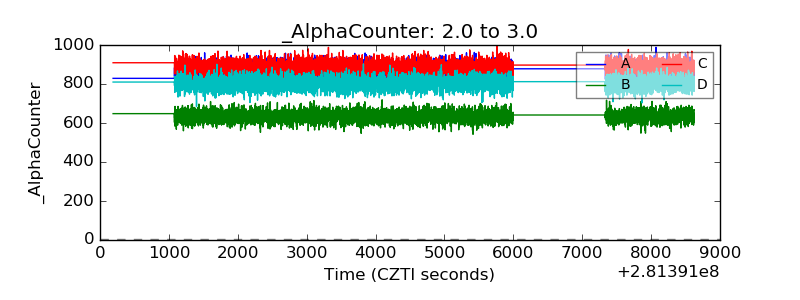 |
| _CPM_Rate | 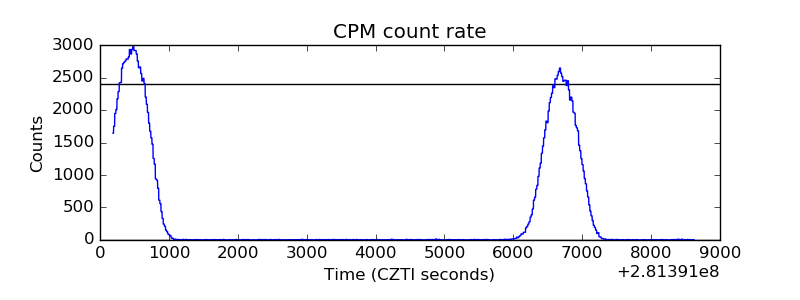 |
| CZT Counter | 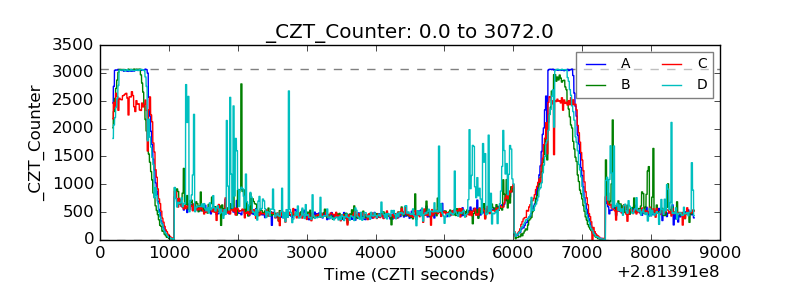 |
| +2.5 Volts monitor |  |
| +5 Volts monitor |  |
| _ROLL_ROT | 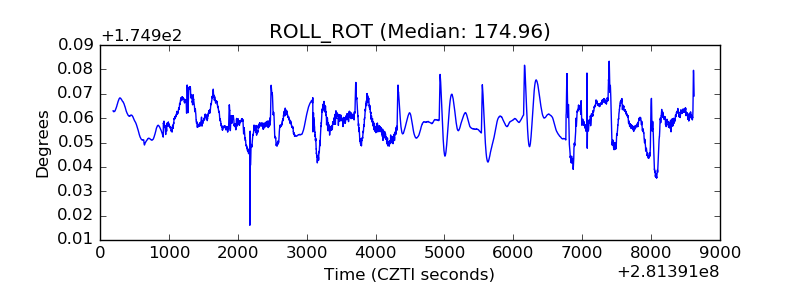 |
| _Roll_DEC | 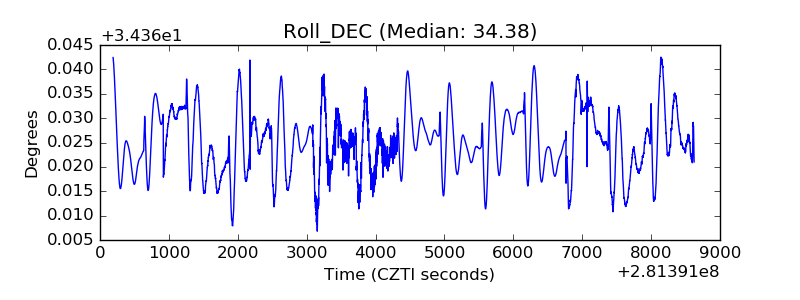 |
| _Roll_RA | 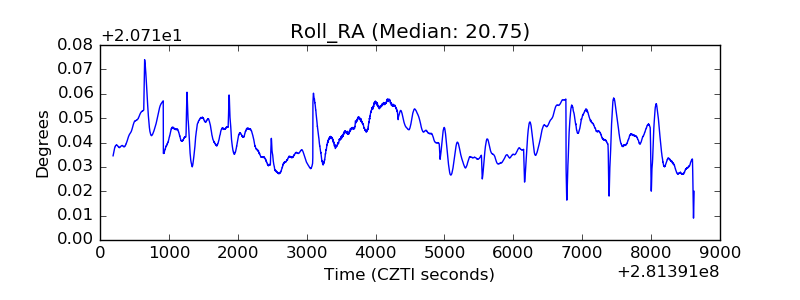 |
| Veto Counter | 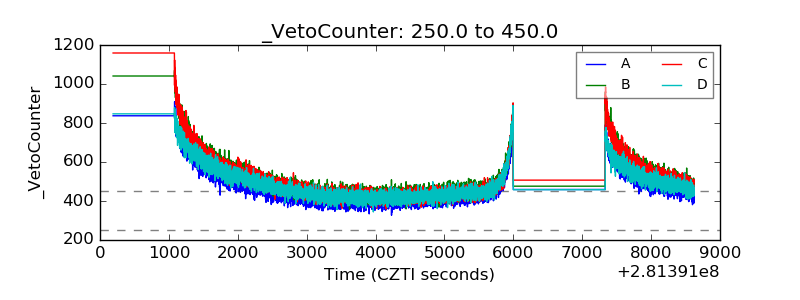 |