| Param | Original file | Final file |
|---|---|---|
| Filename | modeM0/AS1A05_185T04_9000002548_17182cztM0_level2.evt | modeM0/AS1A05_185T04_9000002548_17182cztM0_level2_quad_clean.evt |
| Size (bytes) | 445,786,560 | 91,229,760 |
| Size | 425.1 MB | 87.0 MB |
| Events in quadrant A | 3,028,778 | 595,402 |
| Events in quadrant B | 3,267,090 | 604,606 |
| Events in quadrant C | 3,079,297 | 572,587 |
| Events in quadrant D | 3,701,703 | 554,829 |
| Mode SS | |||
|---|---|---|---|
| Quadrant | BADHDUFLAG | Total packets | Discarded packets |
| A | 0 | 128 | 0 |
| B | 0 | 128 | 0 |
| C | 0 | 128 | 0 |
| D | 0 | 128 | 0 |
| Mode M9 | |||
|---|---|---|---|
| Quadrant | BADHDUFLAG | Total packets | Discarded packets |
| A | 0 | 20 | 0 |
| B | 0 | 21 | 0 |
| C | 0 | 21 | 0 |
| D | 0 | 21 | 0 |
| Mode M0 | |||
|---|---|---|---|
| Quadrant | BADHDUFLAG | Total packets | Discarded packets |
| A | 0 | 12999 | 2 |
| B | 0 | 13683 | 2 |
| C | 0 | 12974 | 3 |
| D | 0 | 15136 | 2 |
| Quadrant | Total seconds | Saturated seconds | Saturation percentage |
|---|---|---|---|
| A | 6233 | 18 | 0.288785% |
| B | 6233 | 58 | 0.930531% |
| C | 6232 | 57 | 0.914634% |
| D | 6232 | 81 | 1.299743% |
Noise dominated data is calculated using 1-second bins in cleaned event files. If a bin has >2000 counts, and if more than 50% of those come from <1% of pixels, then it is considered to be noise-dominated and hence unusable.
| Quadrant | # 1 sec bins | Bins with >0 counts | Bins with >2000 counts | High rate bins dominated by noise | Noise dominated (total time) | Noise dominated (detector-on time) | Marked lightcurve |
|---|---|---|---|---|---|---|---|
| A | 7563 | 6235 | 0 | 0 | 0.00% | 0.00% | 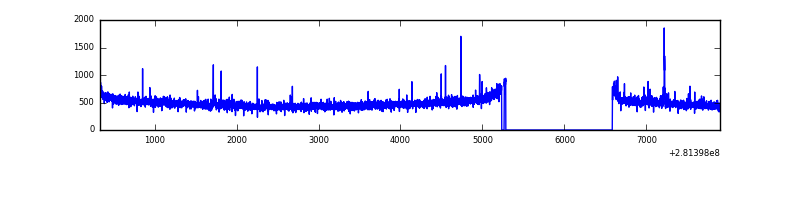 |
| B | 7563 | 6235 | 14 | 14 | 0.19% | 0.22% | 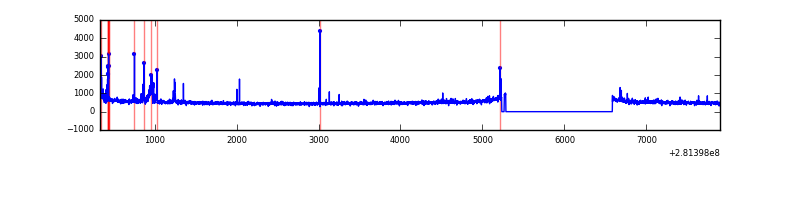 |
| C | 7562 | 6234 | 0 | 0 | 0.00% | 0.00% | 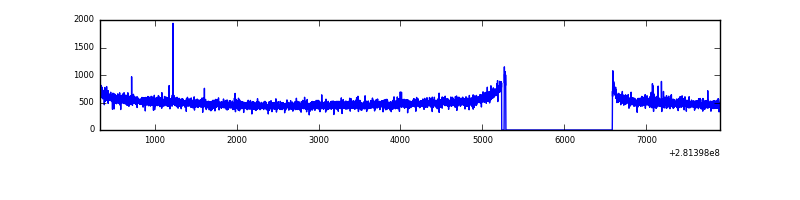 |
| D | 7562 | 6234 | 61 | 61 | 0.81% | 0.98% | 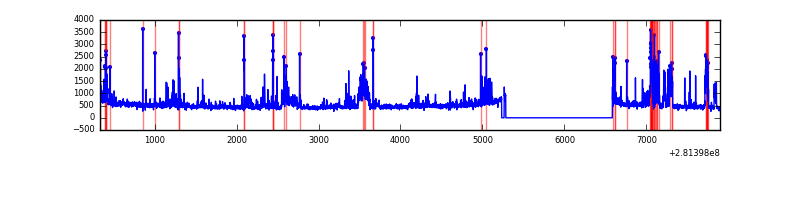 |
Top three noisy pixels from each quadrant. If the there are fewer than three noisy pixels in the level2.evt file, extra rows are filled as -1
| Pixel properties | Quadrant properties | ||||||
|---|---|---|---|---|---|---|---|
| Quadrant | DetID | PixID | Counts | Sigma | Mean | Median | Sigma |
| A | 12 | 189 | 18660 | 114.91 | 776 | 762 | 155.8 |
| A | 12 | 96 | 14597 | 88.82 | 776 | 762 | 155.8 |
| A | 15 | 174 | 10543 | 62.79 | 776 | 762 | 155.8 |
| B | 0 | 189 | 75186 | 507.17 | 782 | 764 | 146.7 |
| B | 0 | 197 | 39880 | 266.57 | 782 | 764 | 146.7 |
| B | 0 | 219 | 31953 | 212.55 | 782 | 764 | 146.7 |
| C | 14 | 238 | 115379 | 656.44 | 751 | 759 | 174.6 |
| C | 3 | 233 | 14788 | 80.35 | 751 | 759 | 174.6 |
| C | 8 | 128 | 7590 | 39.12 | 751 | 759 | 174.6 |
| D | 5 | 222 | 557482 | 3078.51 | 750 | 730 | 180.9 |
| D | 15 | 0 | 131268 | 721.8 | 750 | 730 | 180.9 |
| D | 10 | 70 | 85857 | 470.7 | 750 | 730 | 180.9 |
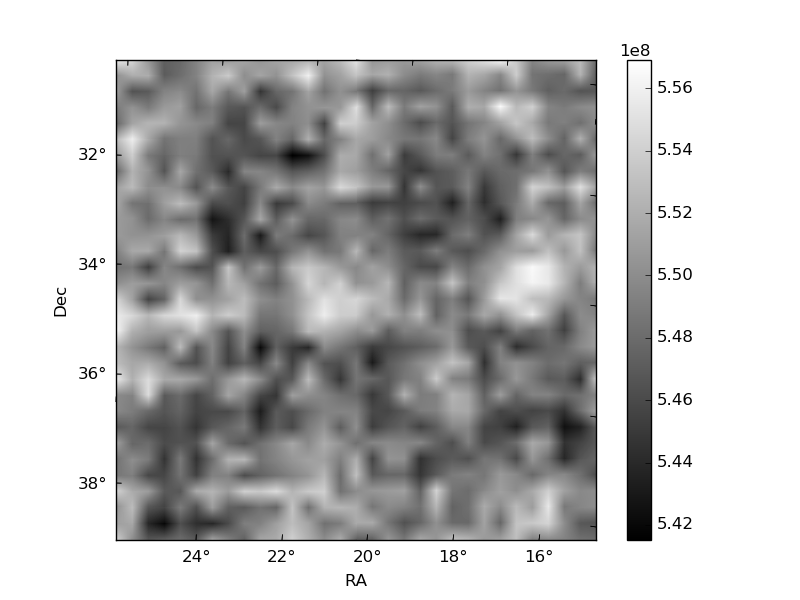
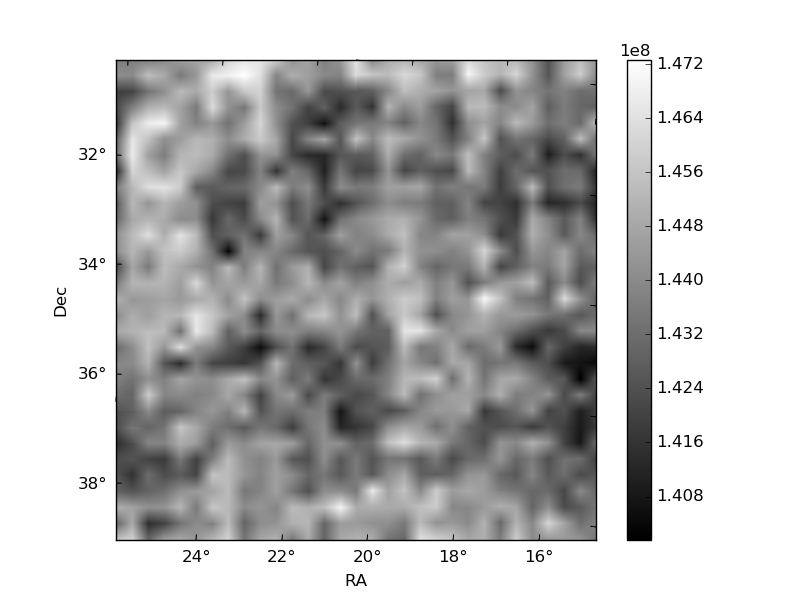
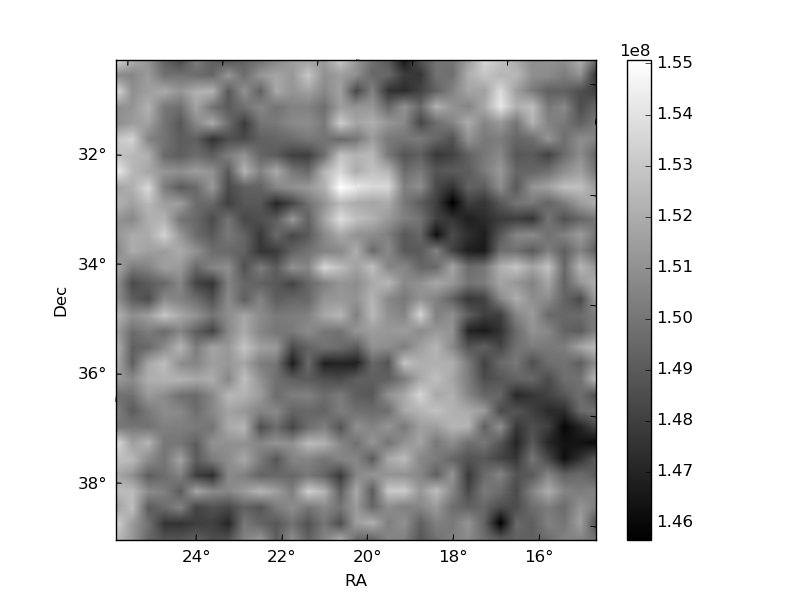
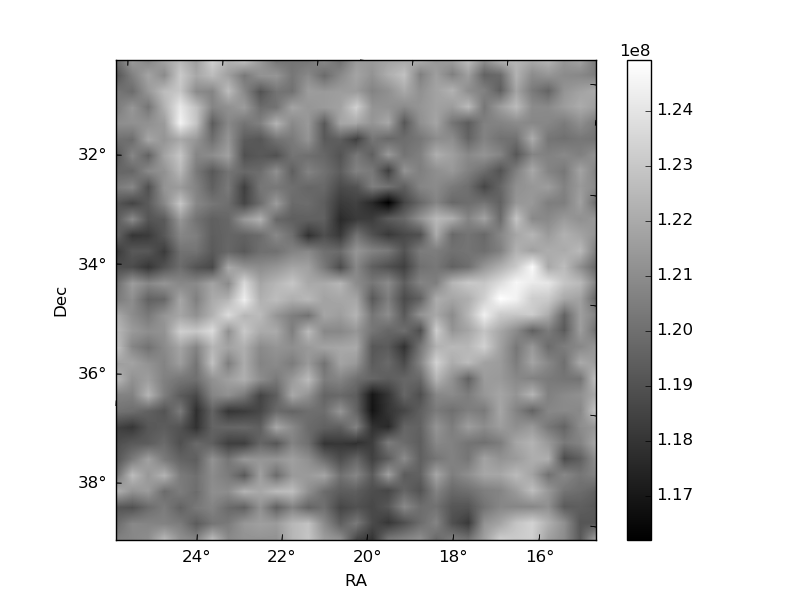
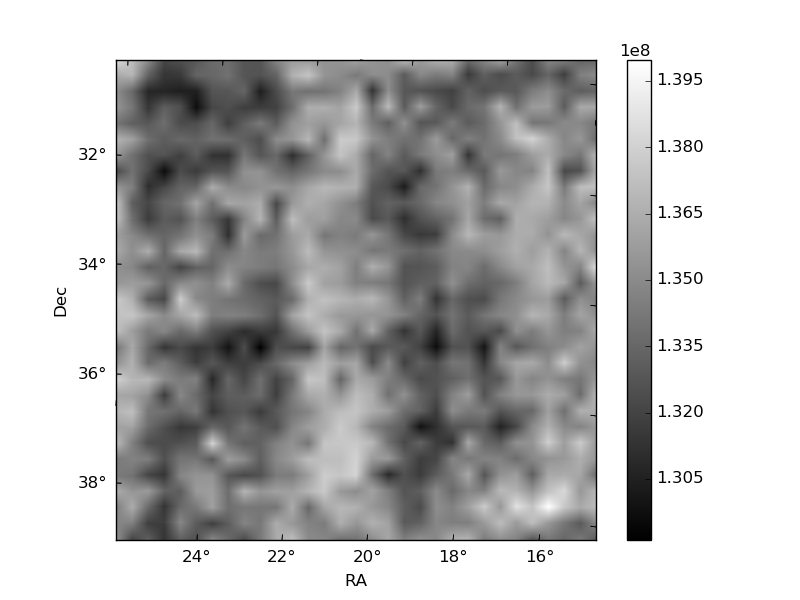
Histogram calculated using DETX and DETY for each event in the final _common_clean file
| Quadrant A | 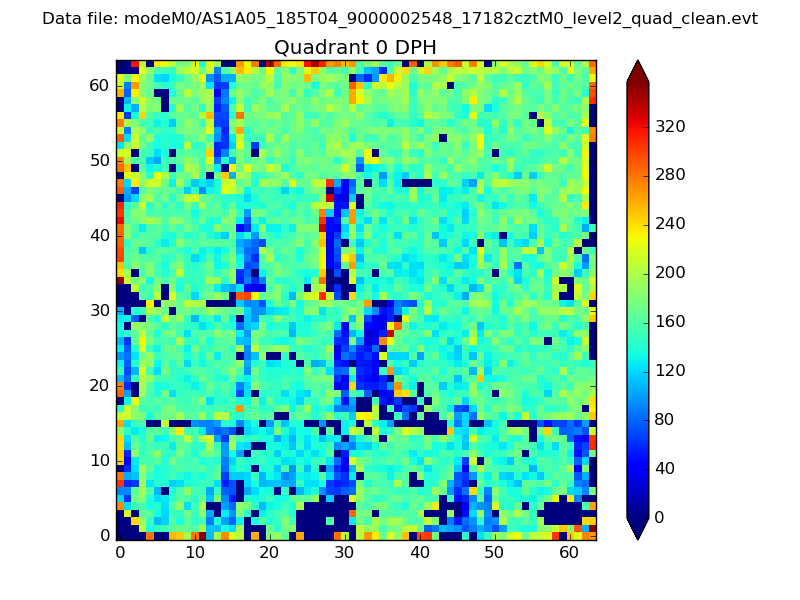 |
 |
Quadrant B |
|---|---|---|---|
| Quadrant D | 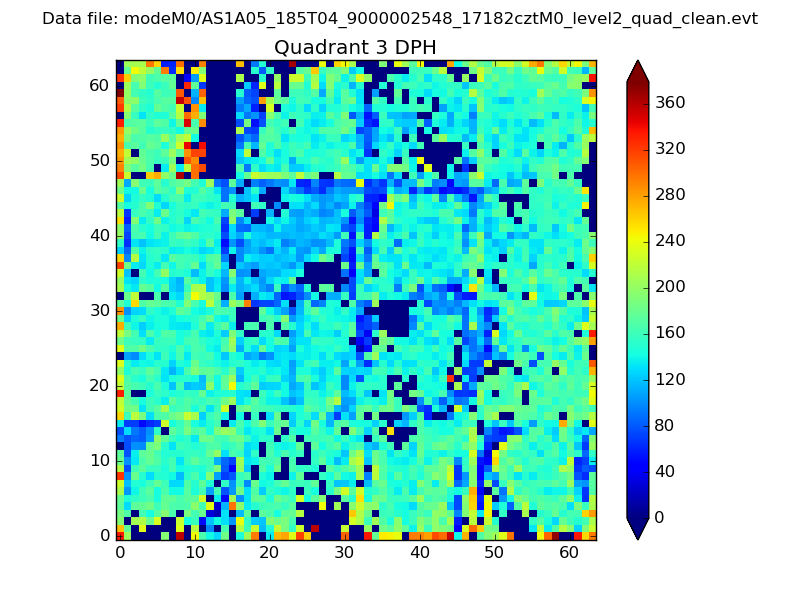 |
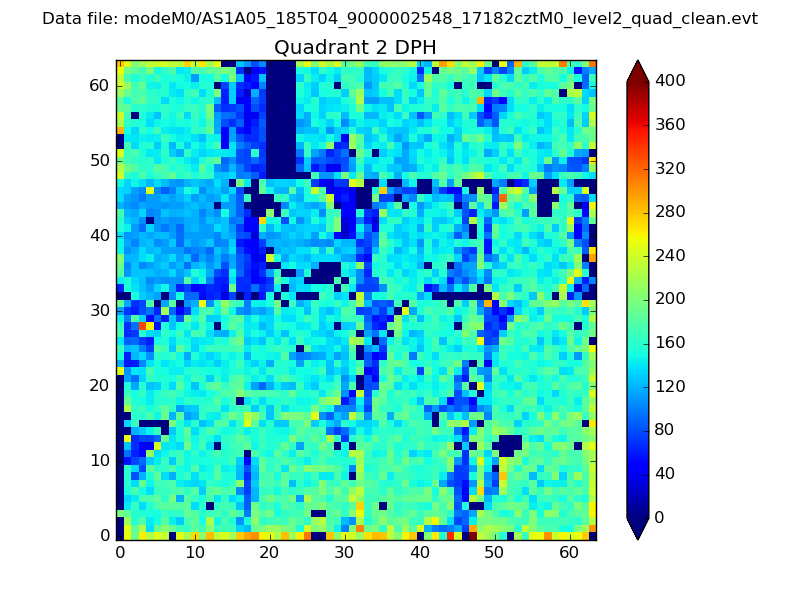 |
Quadrant C |
| Plot type | Count rate plots | Images |
|---|---|---|
| Comparison with Poisson distribution Blue bars denote a histogram of data divided into 1 sec bins. Red curve is a Poisson curve with rate = median count rate of data. |
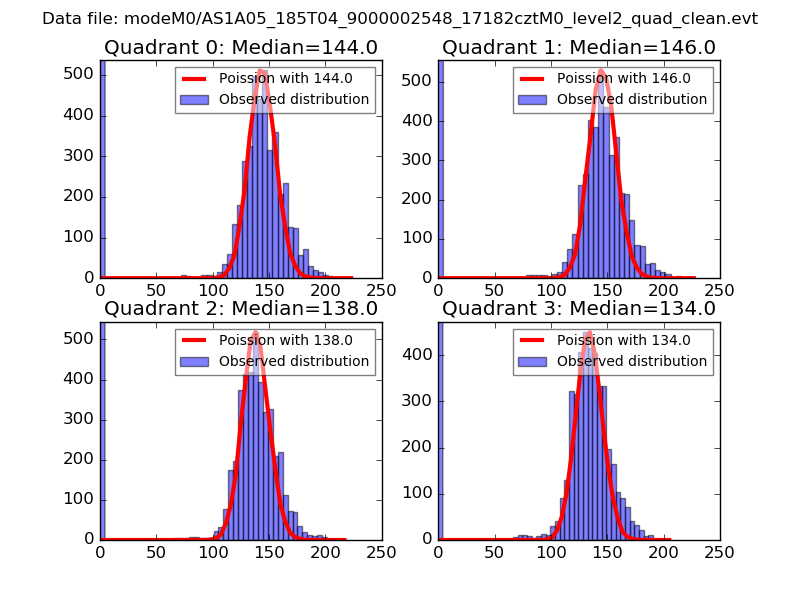 |
 |
| Quadrant-wise count rates Data is divided into 100 sec bins |
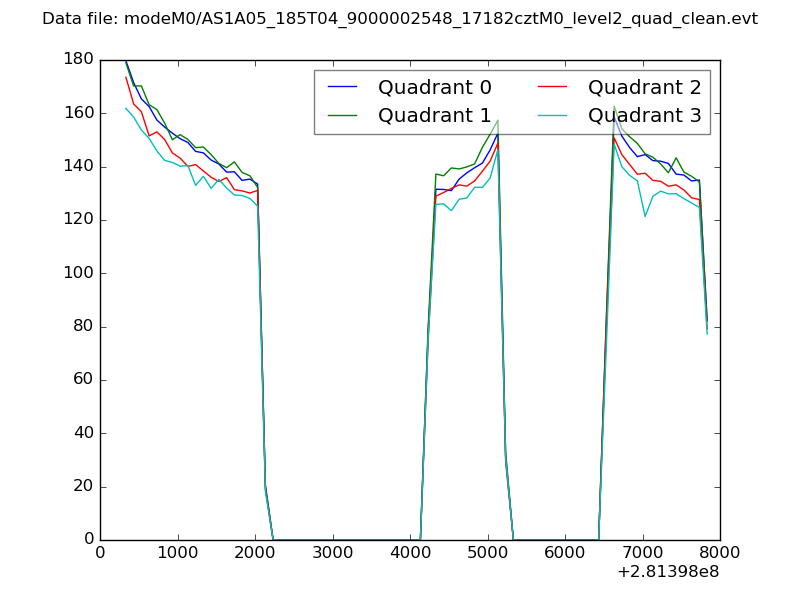 |
|
| Module-wise count rates for Quadrant A Data is divided into 100 sec bins |
 |
 |
| Module-wise count rates for Quadrant B Data is divided into 100 sec bins |
 |
 |
| Module-wise count rates for Quadrant C Data is divided into 100 sec bins |
 |
 |
| Module-wise count rates for Quadrant D Data is divided into 100 sec bins |
 |
 |
| Parameter | Plot |
|---|---|
| CZT HV Monitor |  |
| D_VDD | 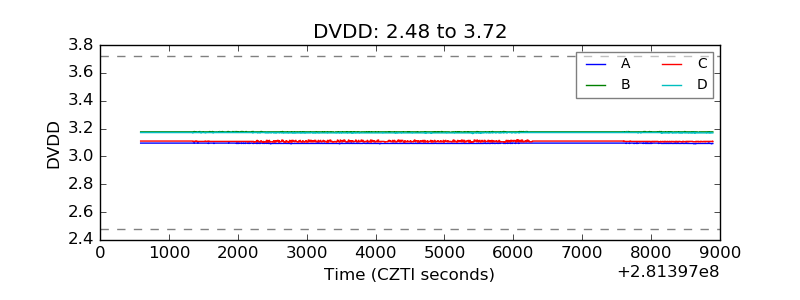 |
| Temperature 1 | 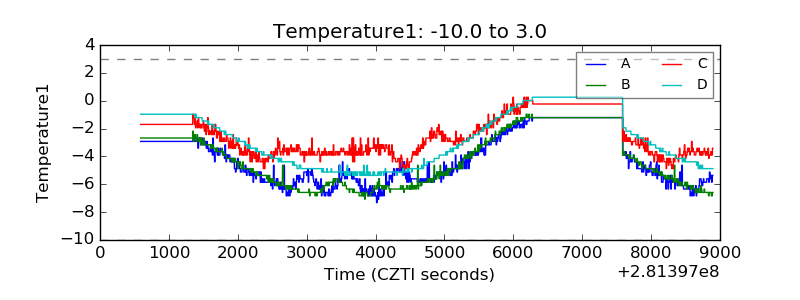 |
| Veto HV Monitor | 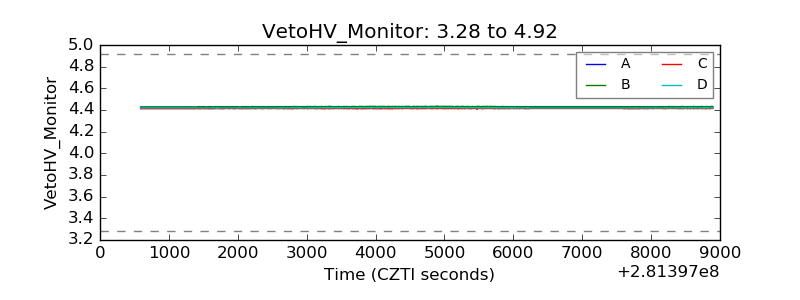 |
| Veto LLD | 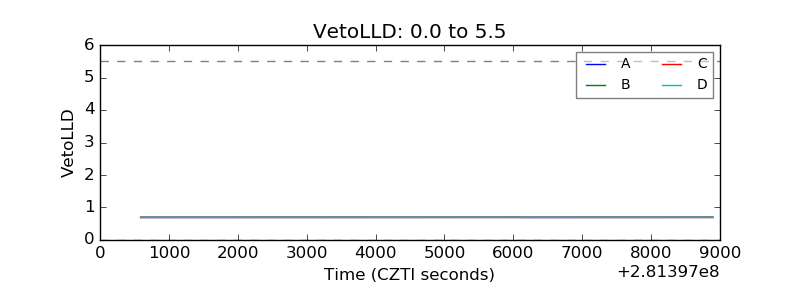 |
| Alpha Counter | 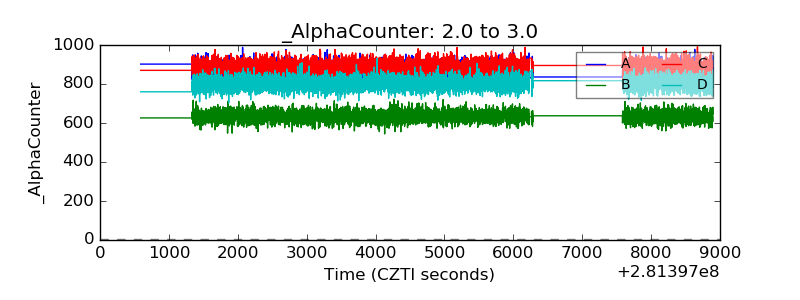 |
| _CPM_Rate | 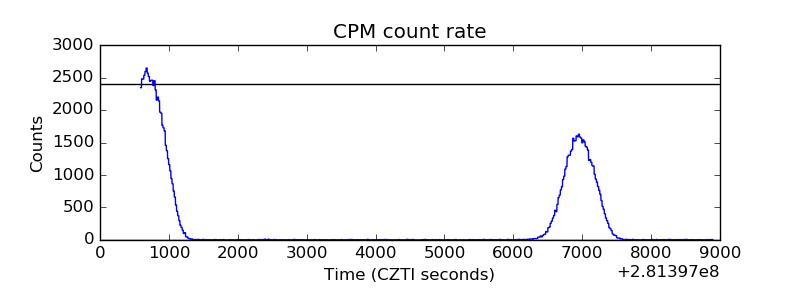 |
| CZT Counter | 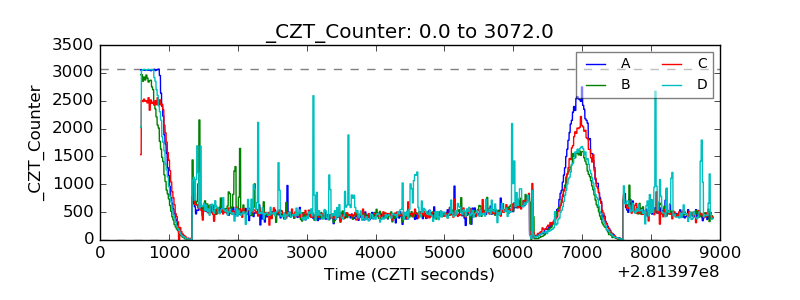 |
| +2.5 Volts monitor |  |
| +5 Volts monitor |  |
| _ROLL_ROT | 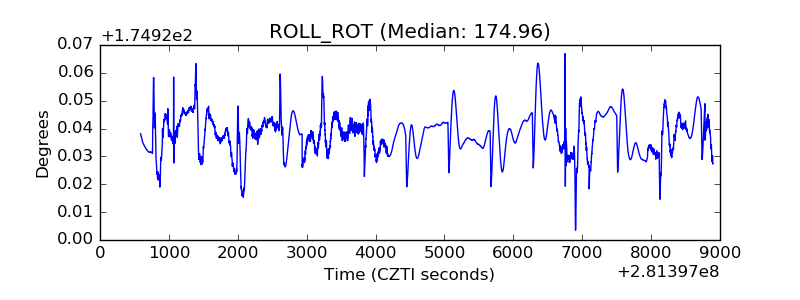 |
| _Roll_DEC | 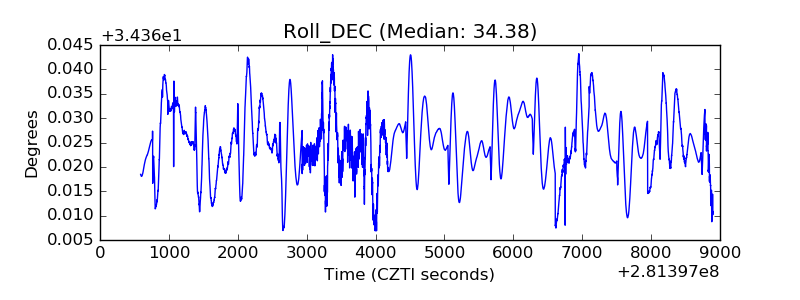 |
| _Roll_RA | 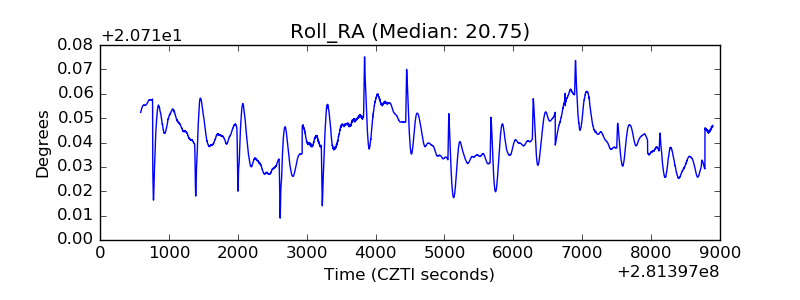 |
| Veto Counter | 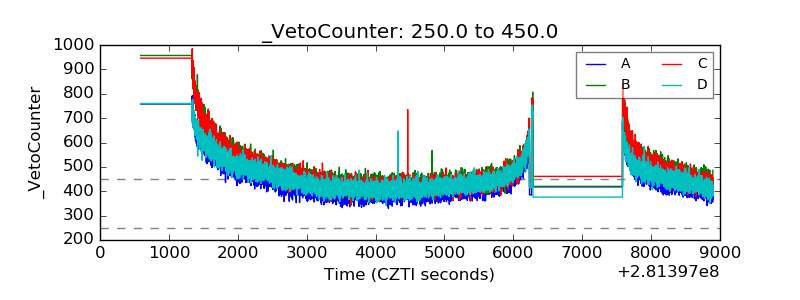 |