| Param | Original file | Final file |
|---|---|---|
| Filename | modeM0/AS1A05_185T04_9000002548_17184cztM0_level2.evt | modeM0/AS1A05_185T04_9000002548_17184cztM0_level2_quad_clean.evt |
| Size (bytes) | 513,224,640 | 88,992,000 |
| Size | 489.4 MB | 84.9 MB |
| Events in quadrant A | 3,427,758 | 565,458 |
| Events in quadrant B | 3,768,830 | 563,608 |
| Events in quadrant C | 3,413,245 | 541,743 |
| Events in quadrant D | 4,444,325 | 522,665 |
| Mode SS | |||
|---|---|---|---|
| Quadrant | BADHDUFLAG | Total packets | Discarded packets |
| A | 0 | 150 | 0 |
| B | 0 | 150 | 0 |
| C | 0 | 150 | 0 |
| D | 0 | 150 | 0 |
| Mode M9 | |||
|---|---|---|---|
| Quadrant | BADHDUFLAG | Total packets | Discarded packets |
| A | 0 | 18 | 0 |
| B | 0 | 18 | 0 |
| C | 0 | 18 | 0 |
| D | 0 | 18 | 0 |
| Mode M0 | |||
|---|---|---|---|
| Quadrant | BADHDUFLAG | Total packets | Discarded packets |
| A | 0 | 15013 | 2 |
| B | 0 | 15953 | 2 |
| C | 0 | 14878 | 3 |
| D | 0 | 18366 | 2 |
| Quadrant | Total seconds | Saturated seconds | Saturation percentage |
|---|---|---|---|
| A | 7192 | 54 | 0.750834% |
| B | 7192 | 152 | 2.113459% |
| C | 7191 | 86 | 1.195939% |
| D | 7192 | 291 | 4.046162% |
Noise dominated data is calculated using 1-second bins in cleaned event files. If a bin has >2000 counts, and if more than 50% of those come from <1% of pixels, then it is considered to be noise-dominated and hence unusable.
| Quadrant | # 1 sec bins | Bins with >0 counts | Bins with >2000 counts | High rate bins dominated by noise | Noise dominated (total time) | Noise dominated (detector-on time) | Marked lightcurve |
|---|---|---|---|---|---|---|---|
| A | 9037 | 7194 | 0 | 0 | 0.00% | 0.00% | 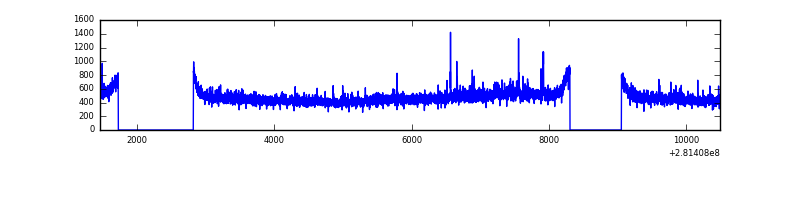 |
| B | 9037 | 7194 | 16 | 16 | 0.18% | 0.22% | 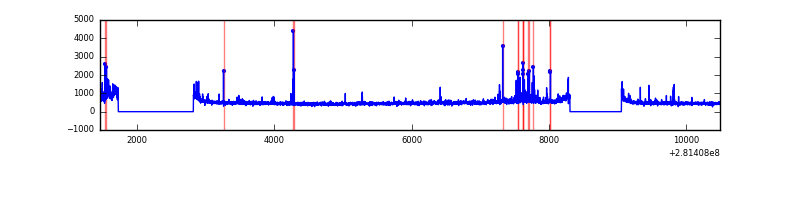 |
| C | 9036 | 7193 | 0 | 0 | 0.00% | 0.00% | 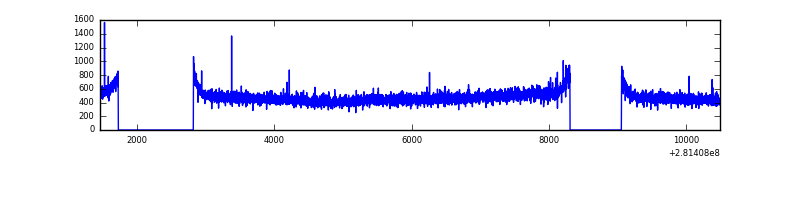 |
| D | 9037 | 7194 | 201 | 201 | 2.22% | 2.79% | 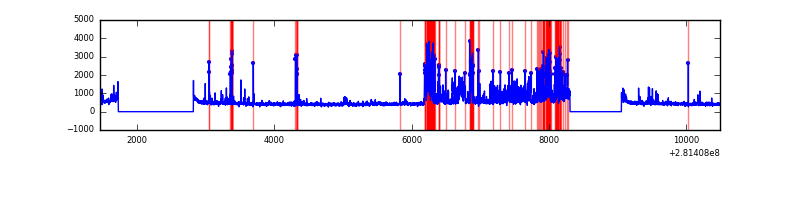 |
Top three noisy pixels from each quadrant. If the there are fewer than three noisy pixels in the level2.evt file, extra rows are filled as -1
| Pixel properties | Quadrant properties | ||||||
|---|---|---|---|---|---|---|---|
| Quadrant | DetID | PixID | Counts | Sigma | Mean | Median | Sigma |
| A | 12 | 189 | 82484 | 461.35 | 870 | 849 | 176.9 |
| A | 0 | 226 | 7763 | 39.07 | 870 | 849 | 176.9 |
| A | 12 | 194 | 6435 | 31.57 | 870 | 849 | 176.9 |
| B | 0 | 219 | 125775 | 746.47 | 869 | 847 | 167.4 |
| B | 7 | 220 | 111982 | 664.06 | 869 | 847 | 167.4 |
| B | 4 | 216 | 37480 | 218.89 | 869 | 847 | 167.4 |
| C | 14 | 238 | 128856 | 652.96 | 836 | 841 | 196.1 |
| C | 3 | 233 | 19551 | 95.43 | 836 | 841 | 196.1 |
| C | 13 | 61 | 6167 | 27.17 | 836 | 841 | 196.1 |
| D | 5 | 222 | 971443 | 4706.75 | 834 | 809 | 206.2 |
| D | 10 | 70 | 221233 | 1068.87 | 834 | 809 | 206.2 |
| D | 2 | 234 | 31460 | 148.63 | 834 | 809 | 206.2 |
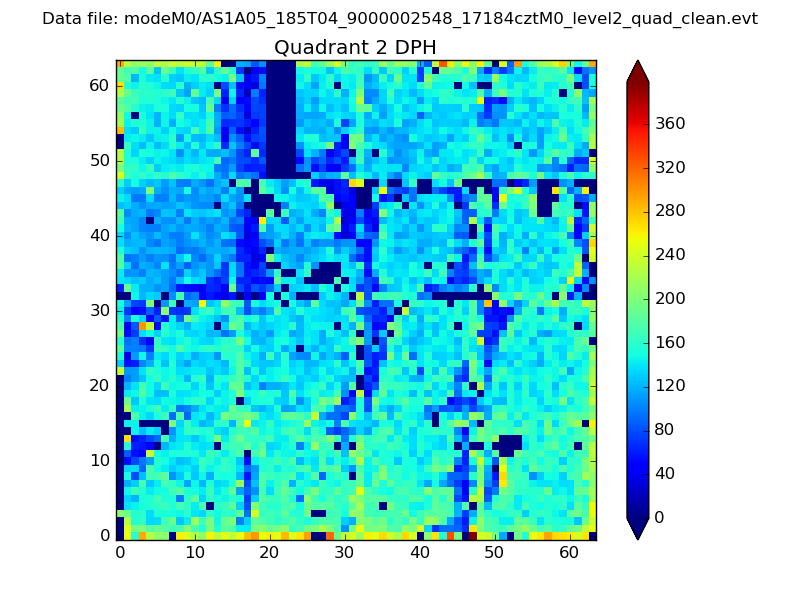
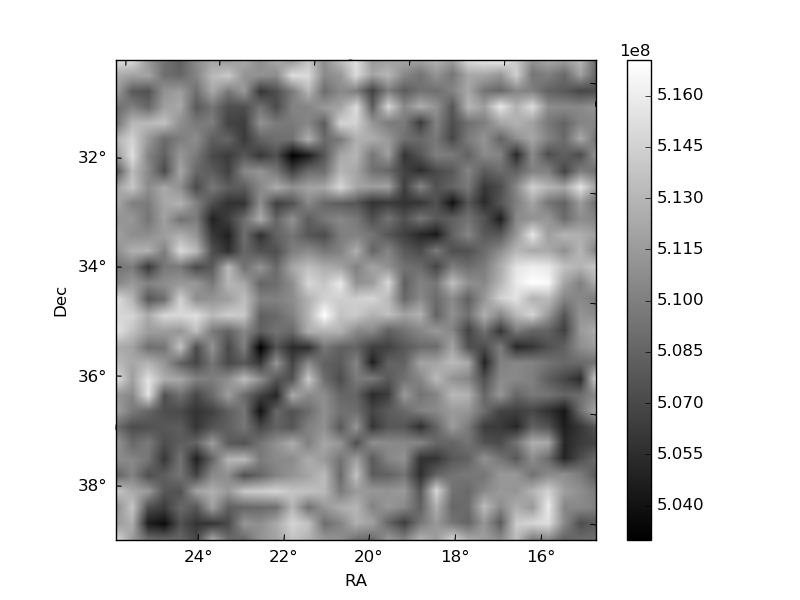
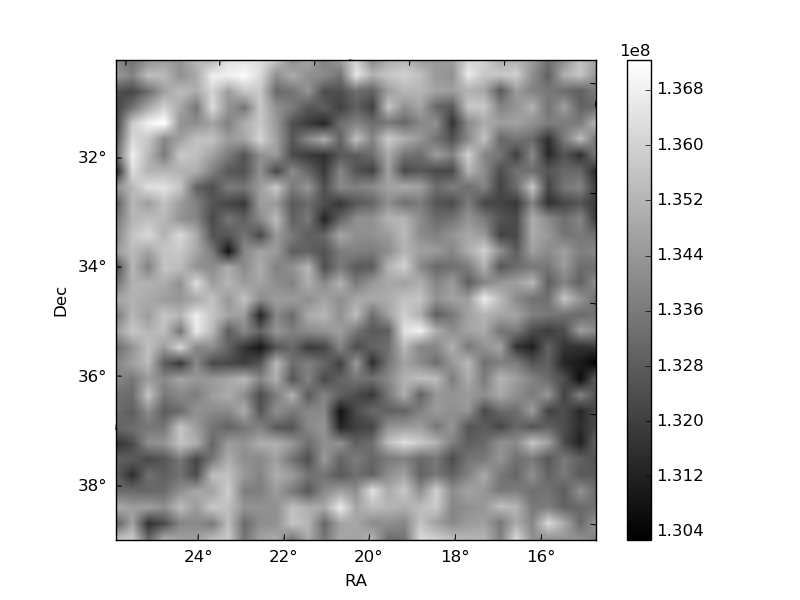
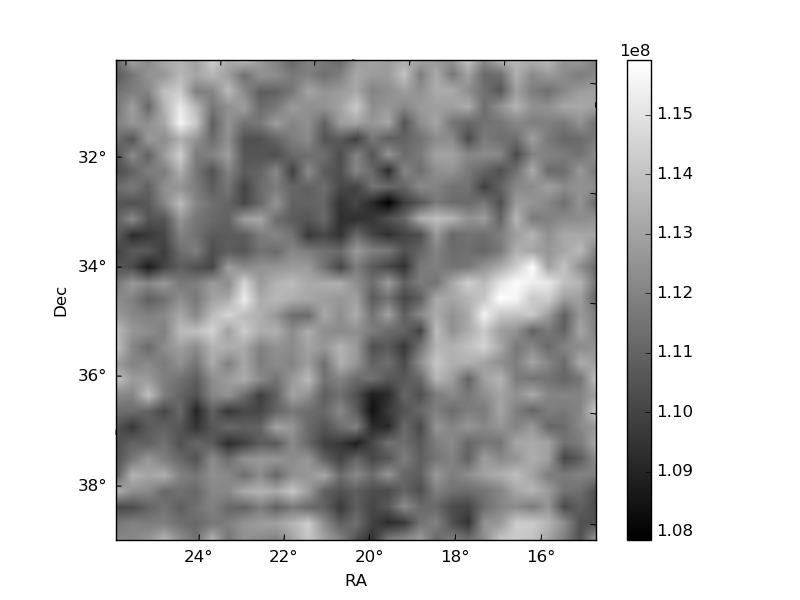
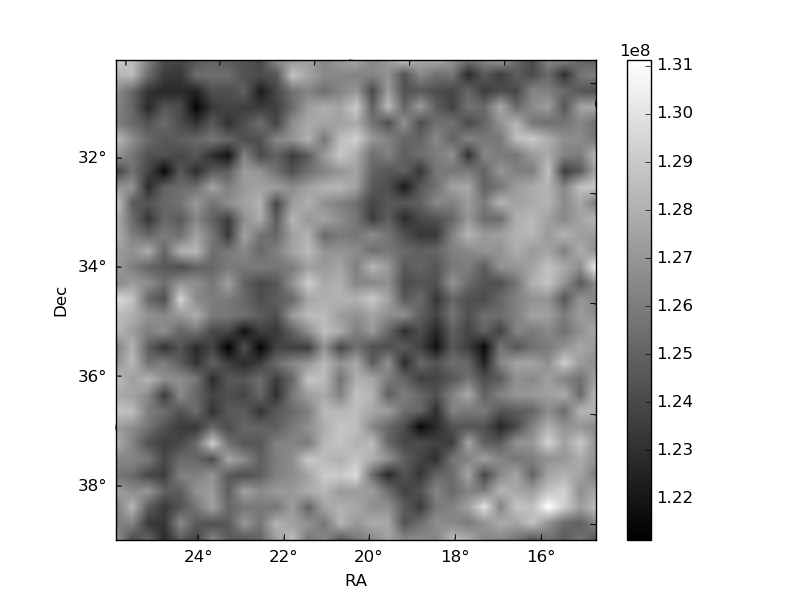
Histogram calculated using DETX and DETY for each event in the final _common_clean file
| Quadrant A | 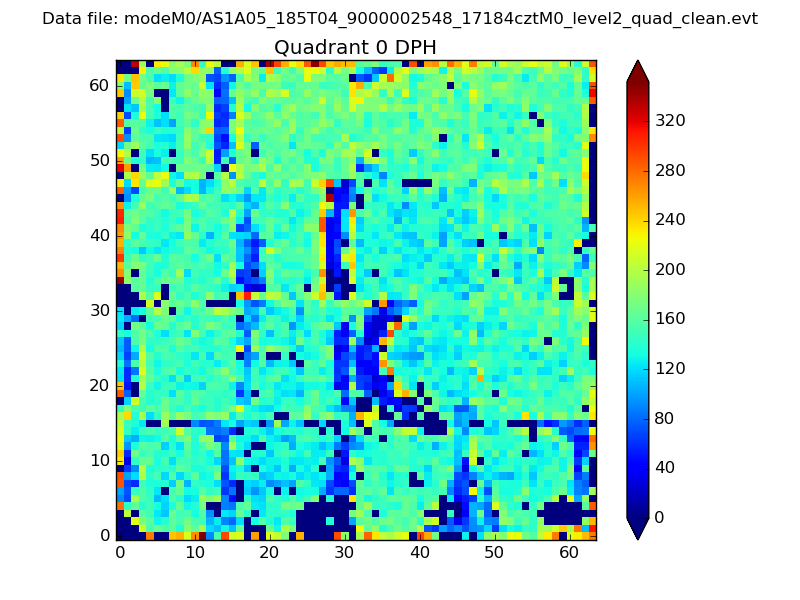 |
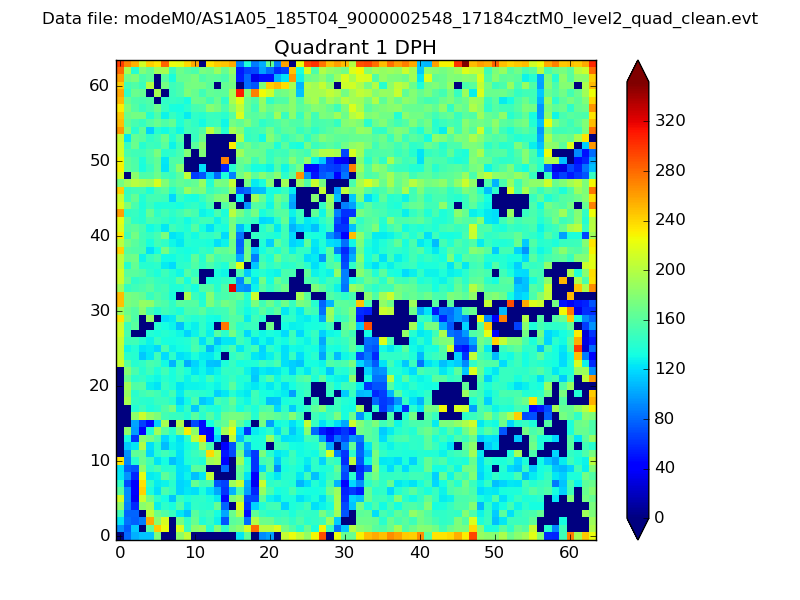 |
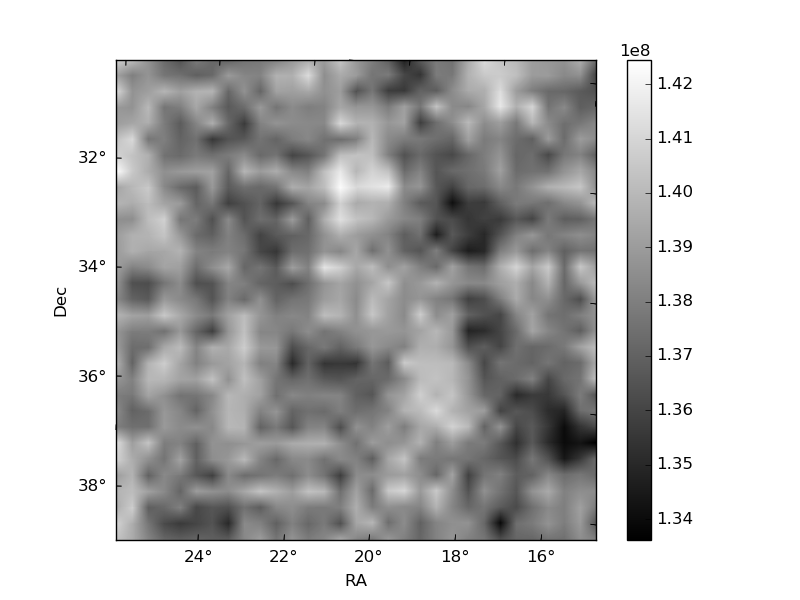
Quadrant B |
|---|---|---|---|
| Quadrant D | 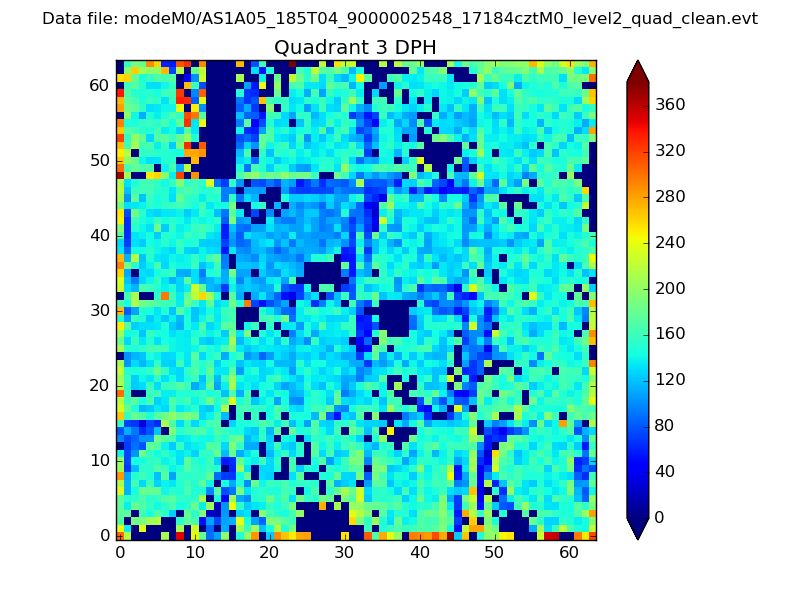 |
 |
Quadrant C |
| Plot type | Count rate plots | Images |
|---|---|---|
| Comparison with Poisson distribution Blue bars denote a histogram of data divided into 1 sec bins. Red curve is a Poisson curve with rate = median count rate of data. |
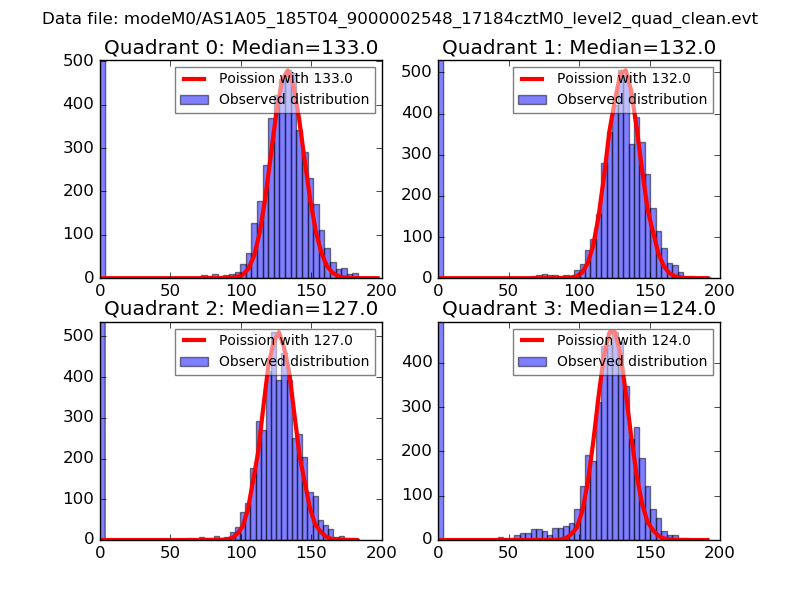 |
 |
| Quadrant-wise count rates Data is divided into 100 sec bins |
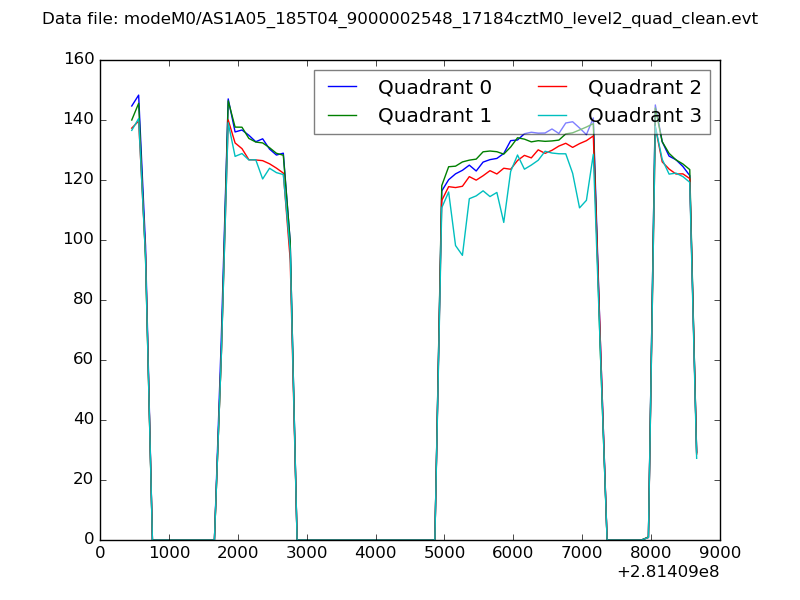 |
|
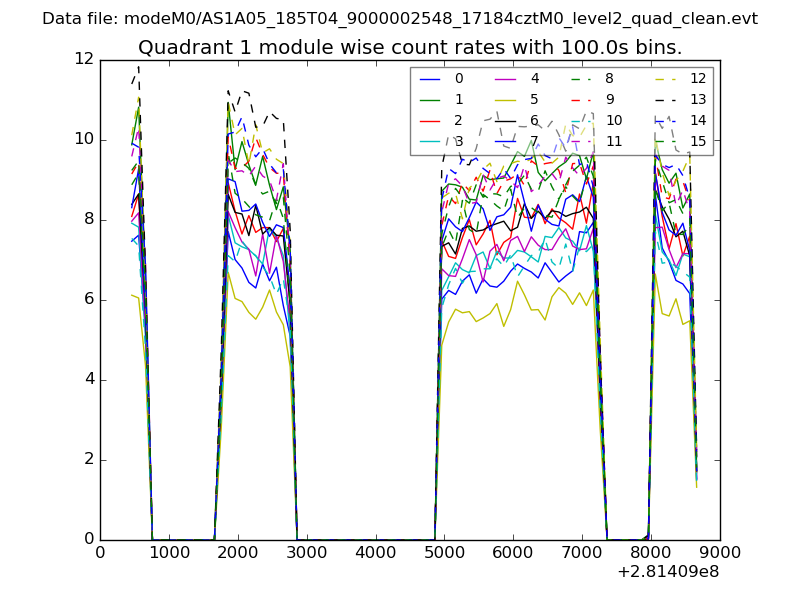
| Module-wise count rates for Quadrant A Data is divided into 100 sec bins |
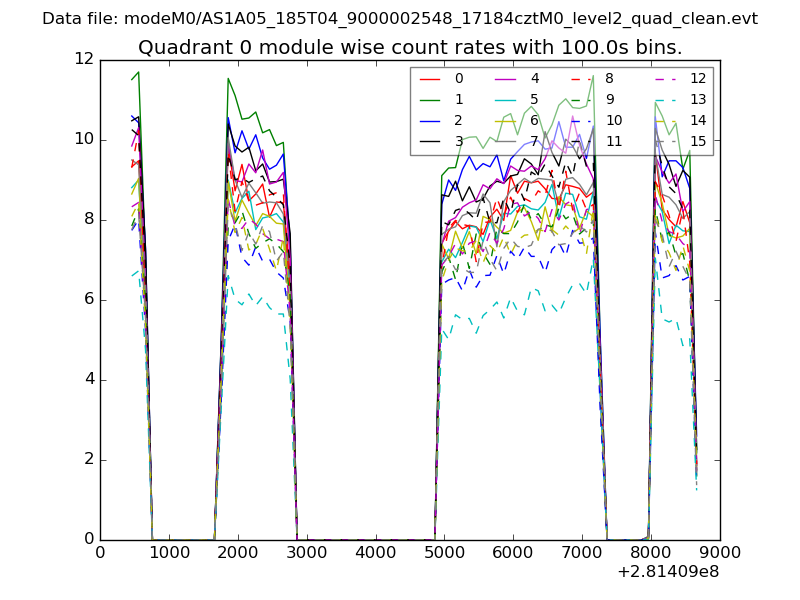 |
 |
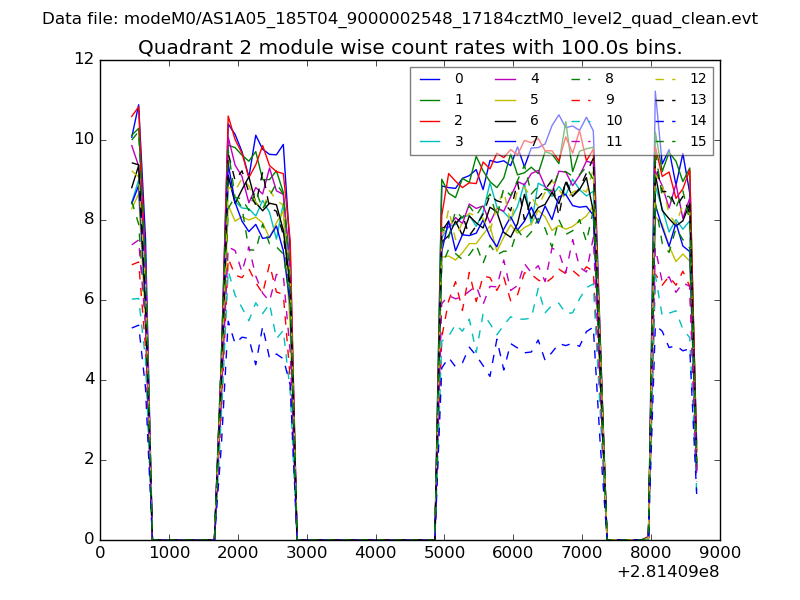
| Module-wise count rates for Quadrant B Data is divided into 100 sec bins |
 |
 |
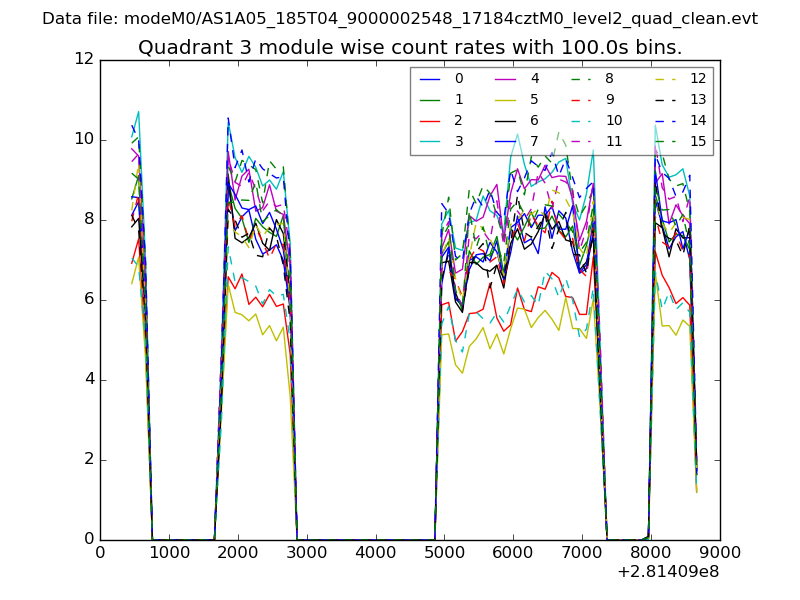
| Module-wise count rates for Quadrant C Data is divided into 100 sec bins |
 |
 |
| Module-wise count rates for Quadrant D Data is divided into 100 sec bins |
 |
 |
| Parameter | Plot |
|---|---|
| CZT HV Monitor | 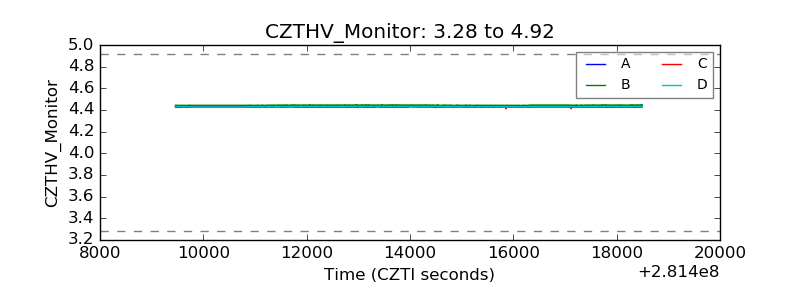 |
| D_VDD | 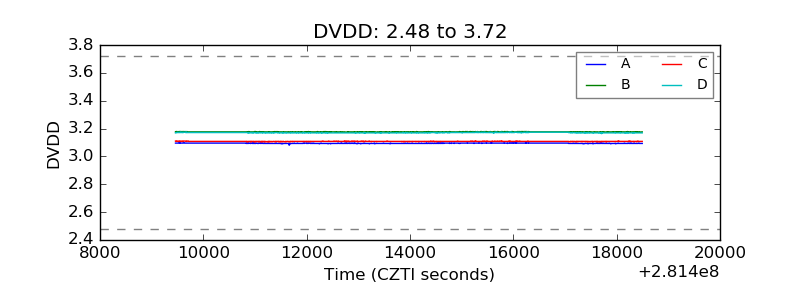 |
| Temperature 1 | 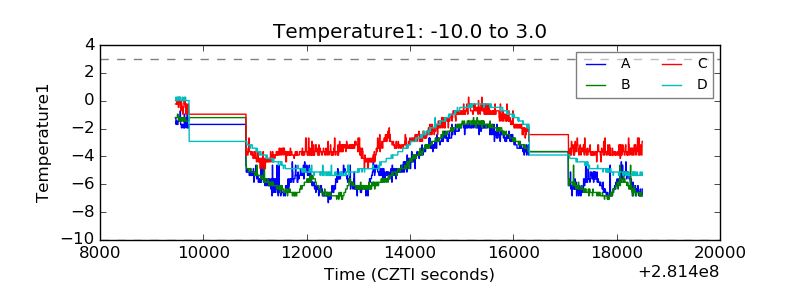 |
| Veto HV Monitor | 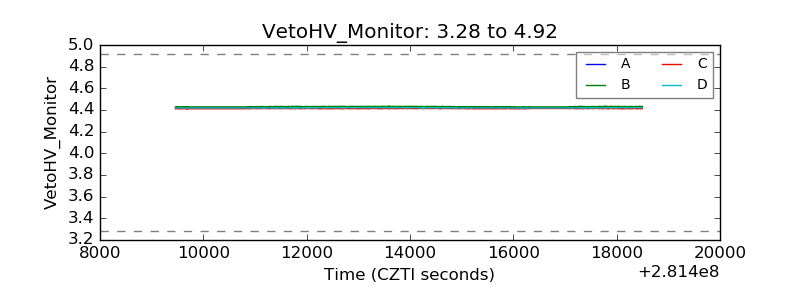 |
| Veto LLD | 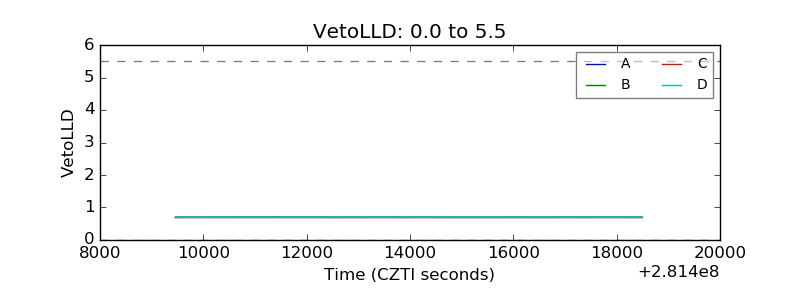 |
| Alpha Counter | 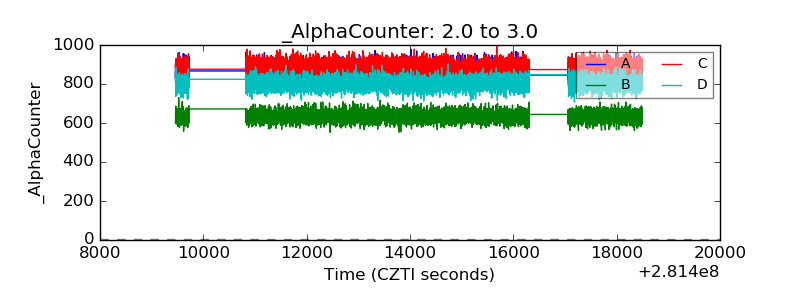 |
| _CPM_Rate | 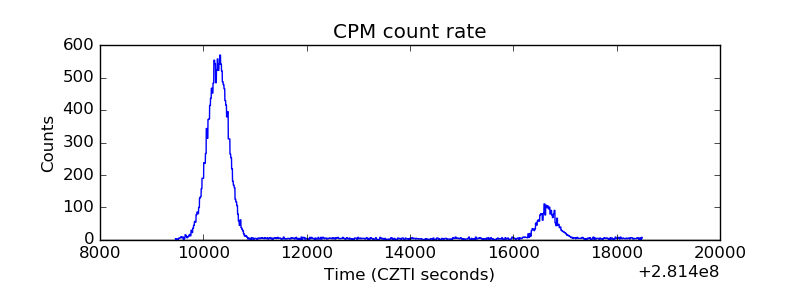 |
| CZT Counter | 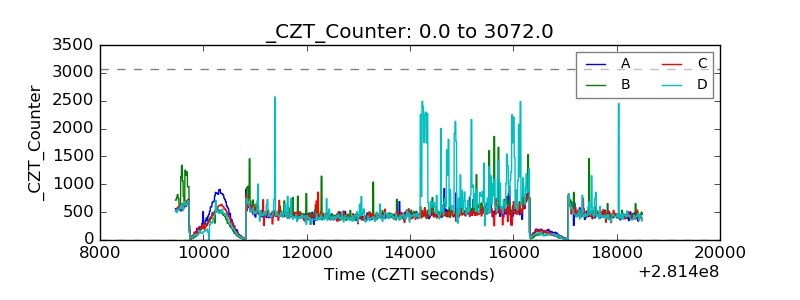 |
| +2.5 Volts monitor | 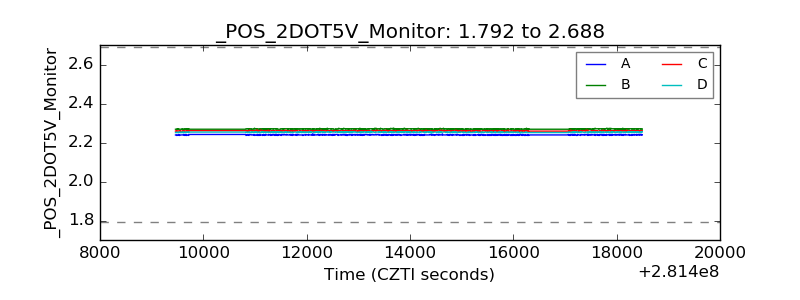 |
| +5 Volts monitor | 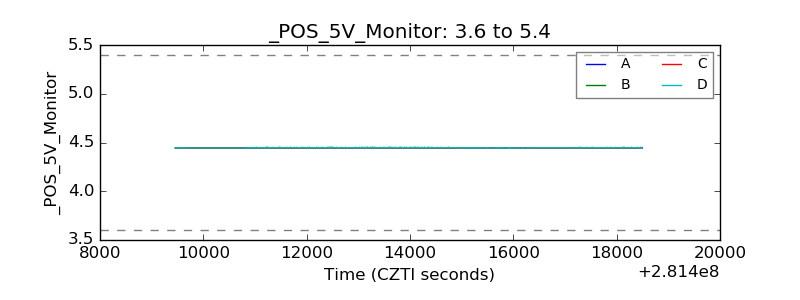 |
| _ROLL_ROT | 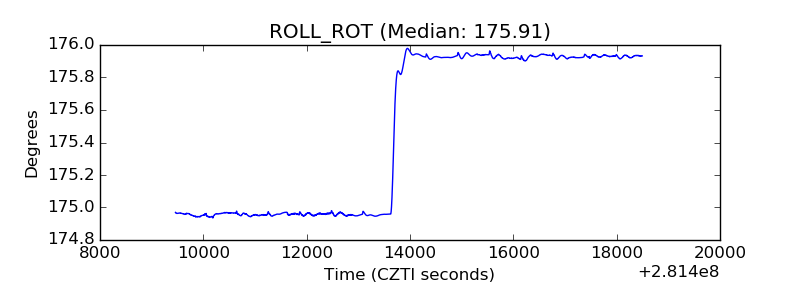 |
| _Roll_DEC | 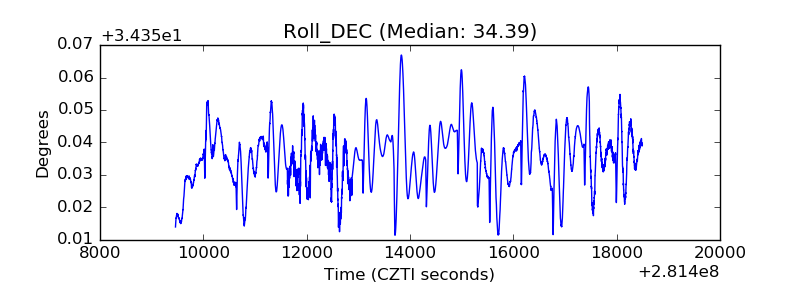 |
| _Roll_RA | 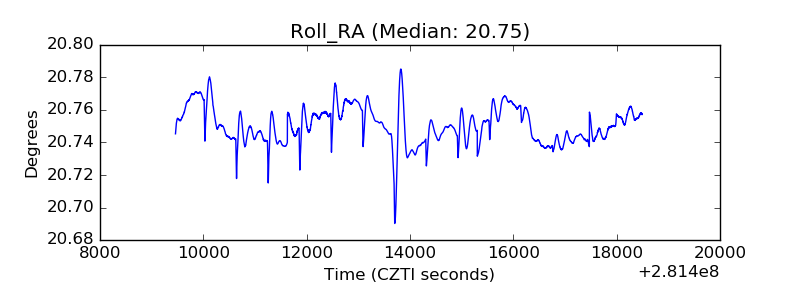 |
| Veto Counter | 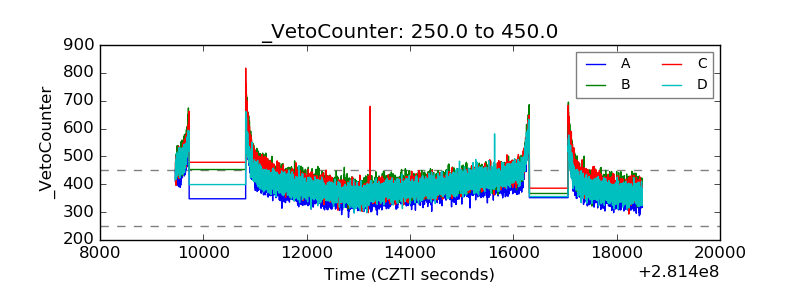 |