| Param | Original file | Final file |
|---|---|---|
| Filename | modeM0/AS1A05_185T04_9000002548_17185cztM0_level2.evt | modeM0/AS1A05_185T04_9000002548_17185cztM0_level2_quad_clean.evt |
| Size (bytes) | 503,023,680 | 84,888,000 |
| Size | 479.7 MB | 81.0 MB |
| Events in quadrant A | 3,583,609 | 519,567 |
| Events in quadrant B | 3,794,540 | 519,291 |
| Events in quadrant C | 3,605,085 | 499,747 |
| Events in quadrant D | 3,731,198 | 499,856 |
| Mode SS | |||
|---|---|---|---|
| Quadrant | BADHDUFLAG | Total packets | Discarded packets |
| A | 0 | 156 | 0 |
| B | 0 | 156 | 0 |
| C | 0 | 156 | 0 |
| D | 0 | 156 | 0 |
| Mode M9 | |||
|---|---|---|---|
| Quadrant | BADHDUFLAG | Total packets | Discarded packets |
| A | 0 | 6 | 0 |
| B | 0 | 7 | 0 |
| C | 0 | 7 | 0 |
| D | 0 | 7 | 0 |
| Mode M0 | |||
|---|---|---|---|
| Quadrant | BADHDUFLAG | Total packets | Discarded packets |
| A | 0 | 15809 | 2 |
| B | 0 | 16272 | 2 |
| C | 0 | 15744 | 2 |
| D | 0 | 16585 | 2 |
| Quadrant | Total seconds | Saturated seconds | Saturation percentage |
|---|---|---|---|
| A | 7641 | 103 | 1.347991% |
| B | 7641 | 192 | 2.512760% |
| C | 7641 | 149 | 1.950007% |
| D | 7641 | 87 | 1.138594% |
Noise dominated data is calculated using 1-second bins in cleaned event files. If a bin has >2000 counts, and if more than 50% of those come from <1% of pixels, then it is considered to be noise-dominated and hence unusable.
| Quadrant | # 1 sec bins | Bins with >0 counts | Bins with >2000 counts | High rate bins dominated by noise | Noise dominated (total time) | Noise dominated (detector-on time) | Marked lightcurve |
|---|---|---|---|---|---|---|---|
| A | 7951 | 7642 | 0 | 0 | 0.00% | 0.00% | 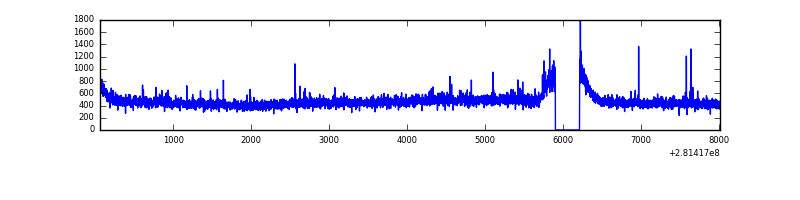 |
| B | 7951 | 7642 | 37 | 37 | 0.47% | 0.48% | 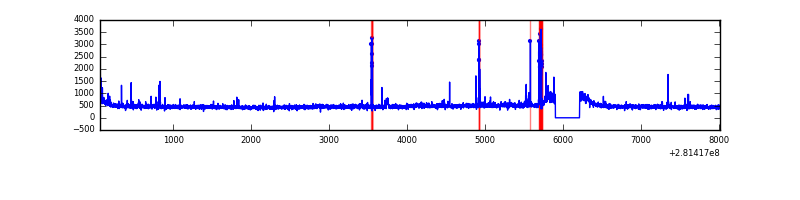 |
| C | 7951 | 7642 | 0 | 0 | 0.00% | 0.00% | 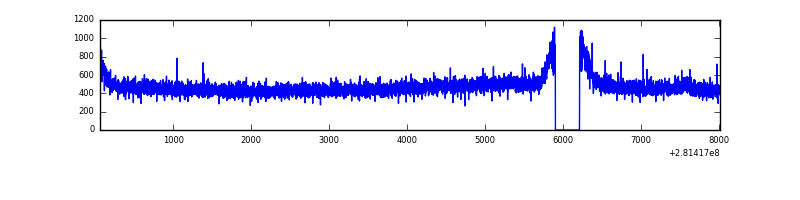 |
| D | 7951 | 7642 | 26 | 26 | 0.33% | 0.34% | 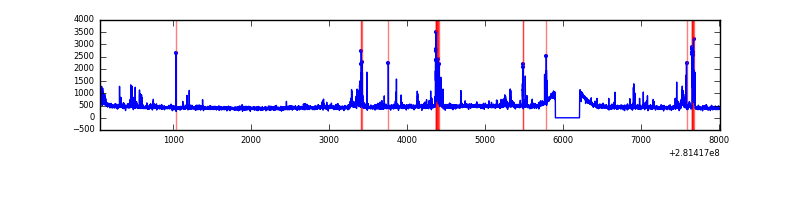 |
Top three noisy pixels from each quadrant. If the there are fewer than three noisy pixels in the level2.evt file, extra rows are filled as -1
| Pixel properties | Quadrant properties | ||||||
|---|---|---|---|---|---|---|---|
| Quadrant | DetID | PixID | Counts | Sigma | Mean | Median | Sigma |
| A | 12 | 189 | 48200 | 255.69 | 914 | 894 | 185.0 |
| A | 9 | 143 | 11705 | 58.43 | 914 | 894 | 185.0 |
| A | 12 | 96 | 8648 | 41.91 | 914 | 894 | 185.0 |
| B | 0 | 219 | 150481 | 847.8 | 913 | 887 | 176.4 |
| B | 0 | 244 | 28262 | 155.14 | 913 | 887 | 176.4 |
| B | 12 | 111 | 20978 | 113.86 | 913 | 887 | 176.4 |
| C | 14 | 238 | 135428 | 646.79 | 881 | 886 | 208.0 |
| C | 3 | 233 | 32345 | 151.24 | 881 | 886 | 208.0 |
| C | 13 | 61 | 6414 | 26.58 | 881 | 886 | 208.0 |
| D | 5 | 222 | 184725 | 830.95 | 891 | 865 | 221.3 |
| D | 12 | 233 | 101839 | 456.35 | 891 | 865 | 221.3 |
| D | 10 | 70 | 38467 | 169.94 | 891 | 865 | 221.3 |
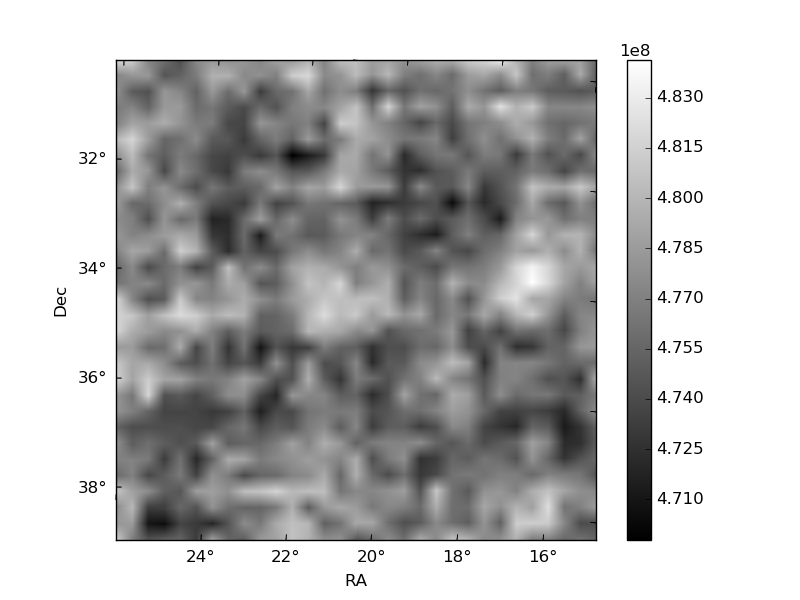
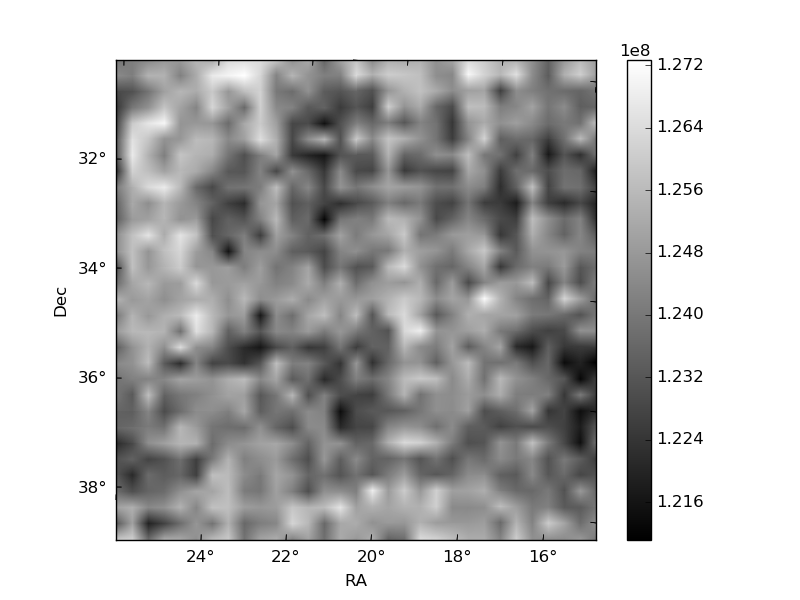
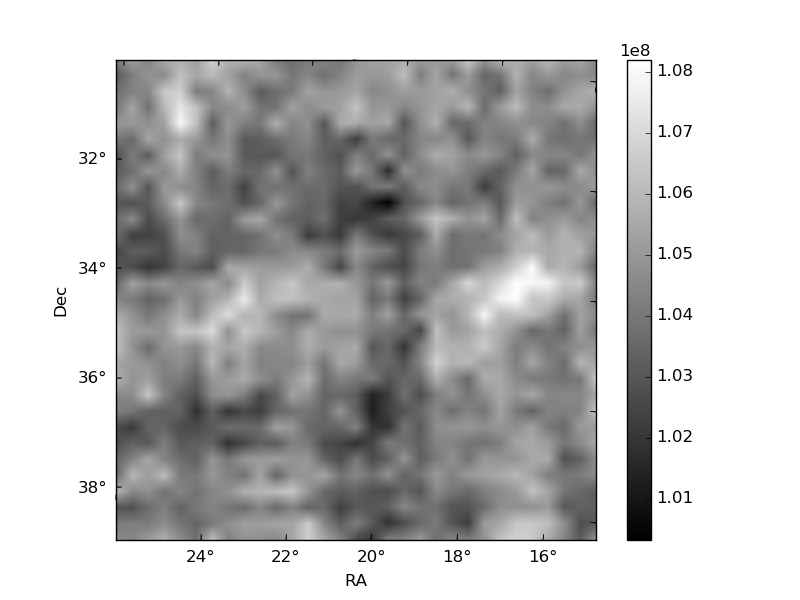
Histogram calculated using DETX and DETY for each event in the final _common_clean file
| Quadrant A | 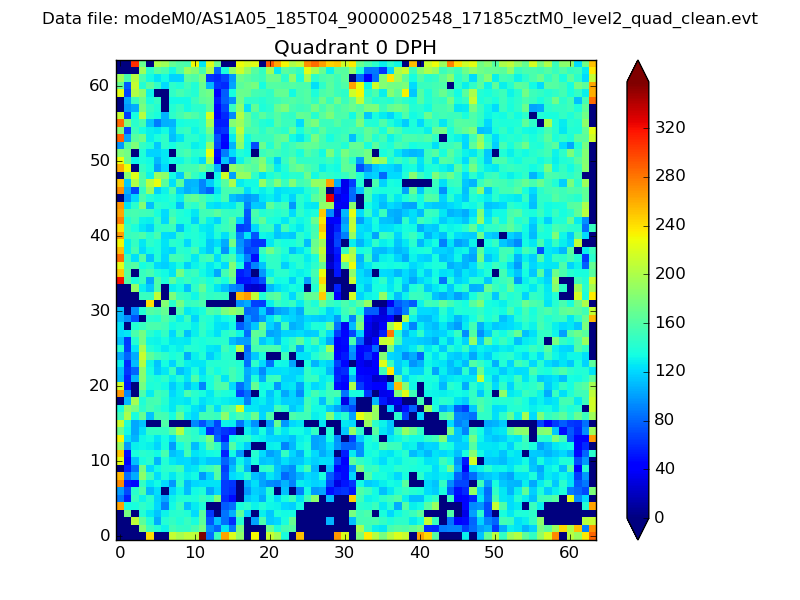 |
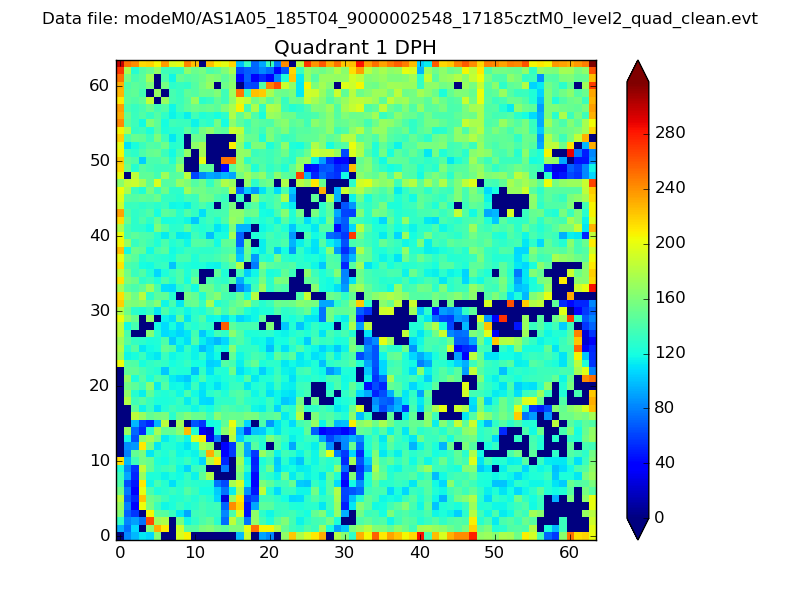 |
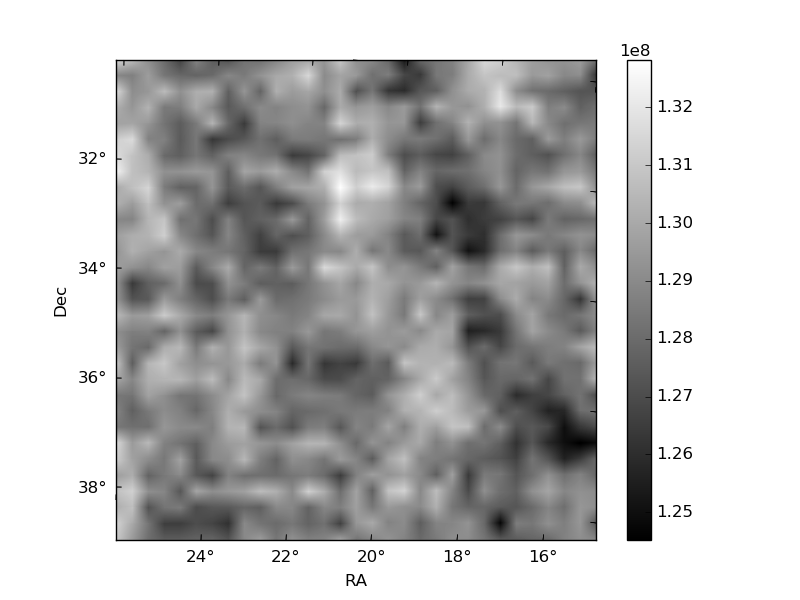
Quadrant B |
|---|---|---|---|
| Quadrant D | 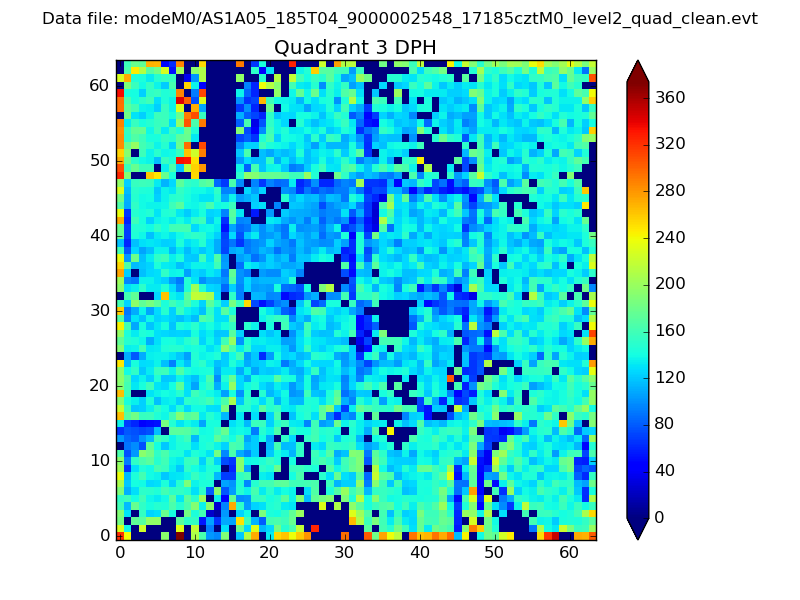 |
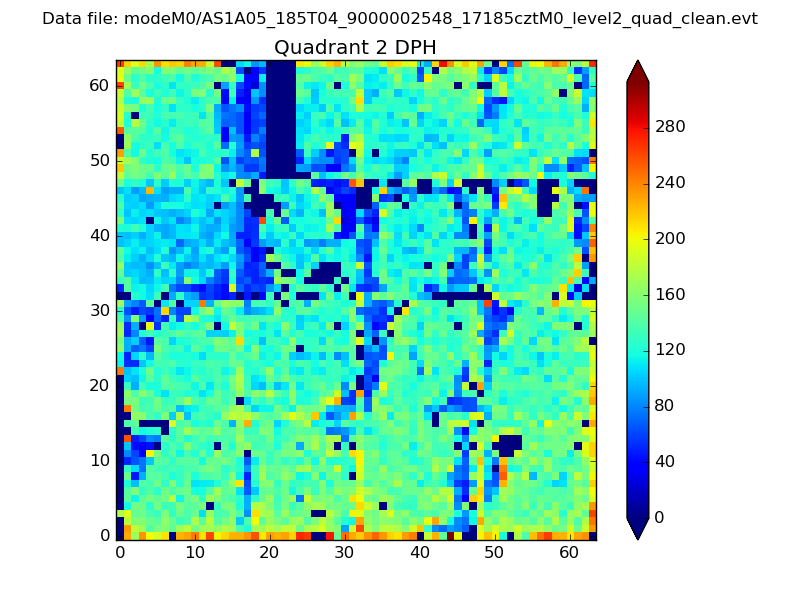 |
Quadrant C |
| Plot type | Count rate plots | Images |
|---|---|---|
| Comparison with Poisson distribution Blue bars denote a histogram of data divided into 1 sec bins. Red curve is a Poisson curve with rate = median count rate of data. |
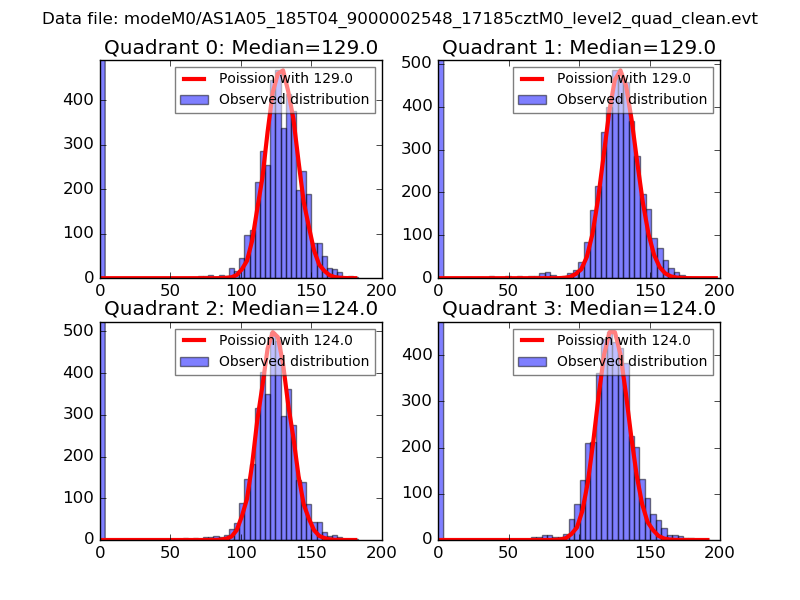 |
 |
| Quadrant-wise count rates Data is divided into 100 sec bins |
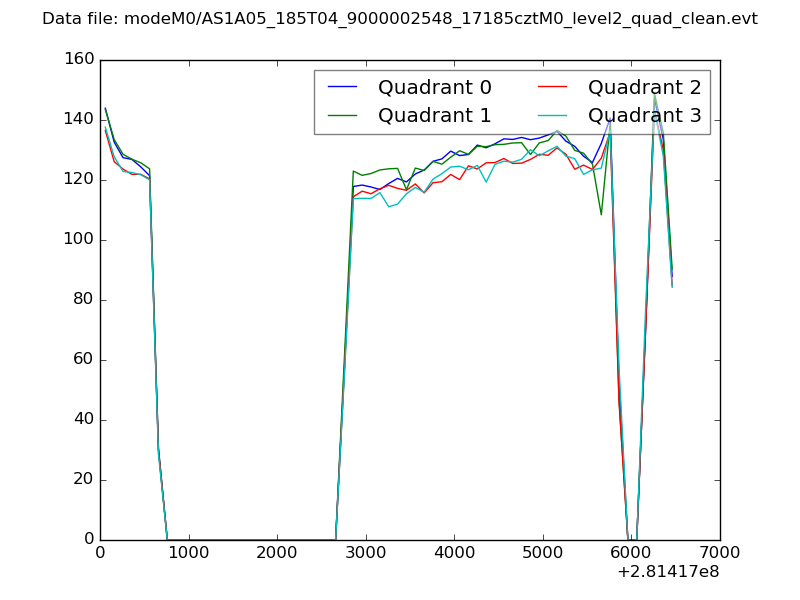 |
|
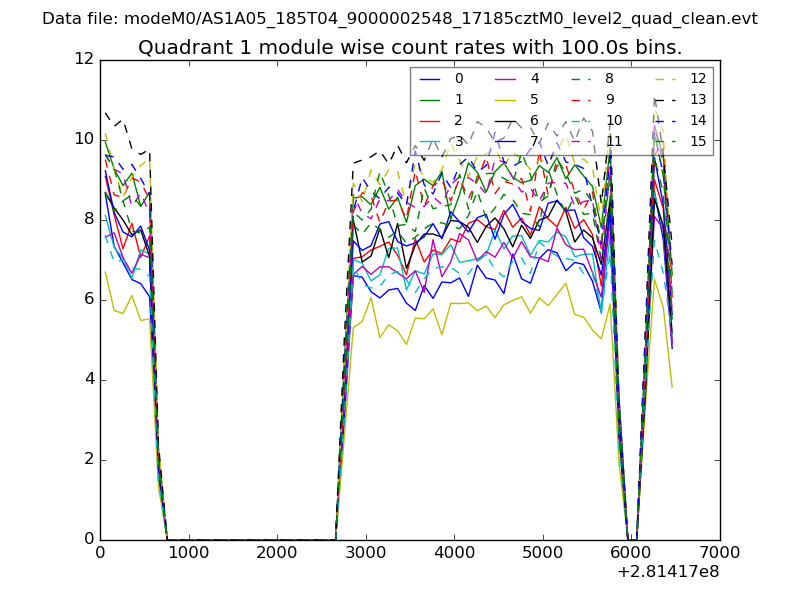
| Module-wise count rates for Quadrant A Data is divided into 100 sec bins |
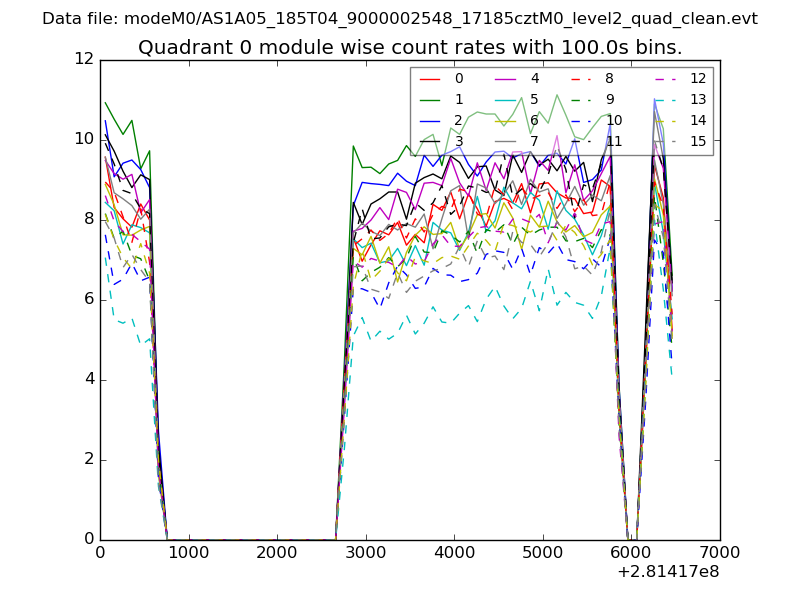 |
 |
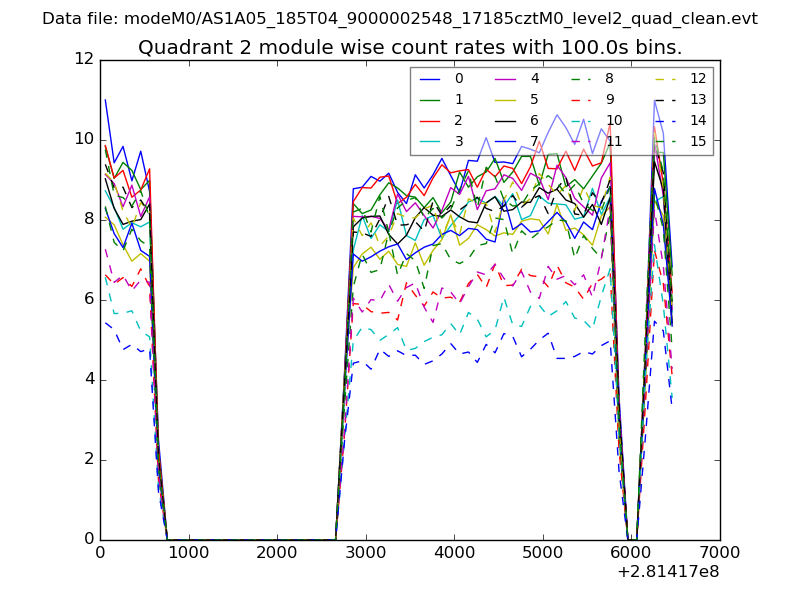
| Module-wise count rates for Quadrant B Data is divided into 100 sec bins |
 |
 |
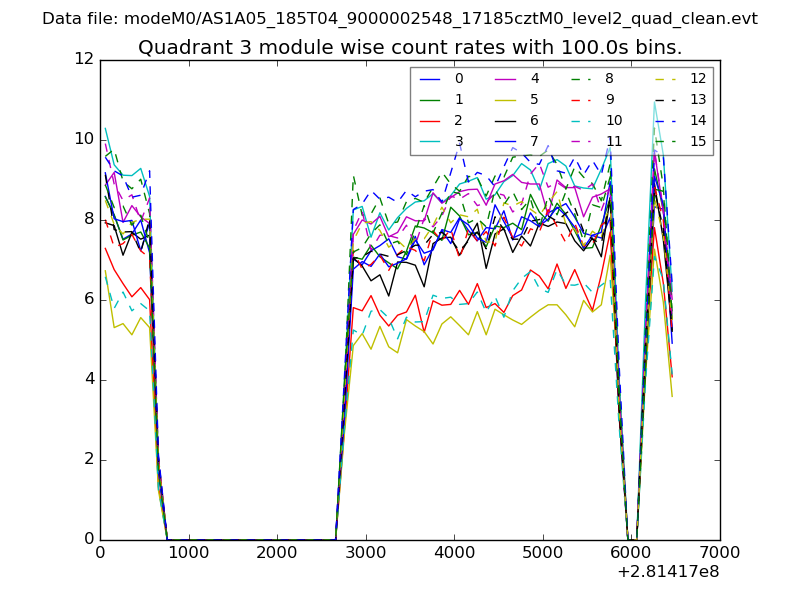
| Module-wise count rates for Quadrant C Data is divided into 100 sec bins |
 |
 |
| Module-wise count rates for Quadrant D Data is divided into 100 sec bins |
 |
 |
| Parameter | Plot |
|---|---|
| CZT HV Monitor | 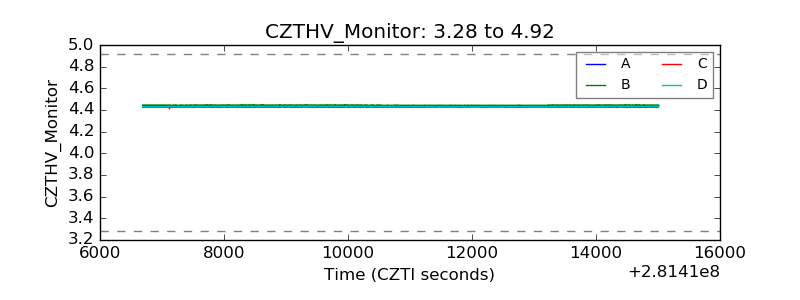 |
| D_VDD | 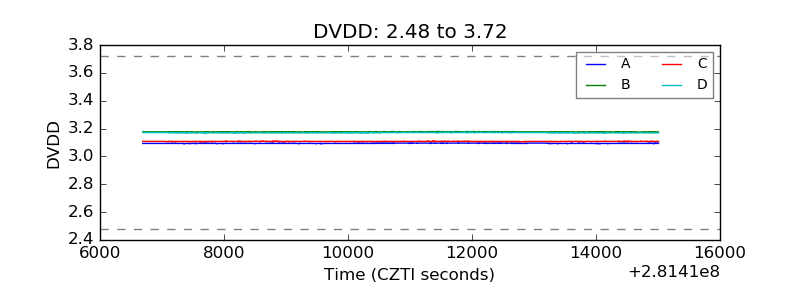 |
| Temperature 1 | 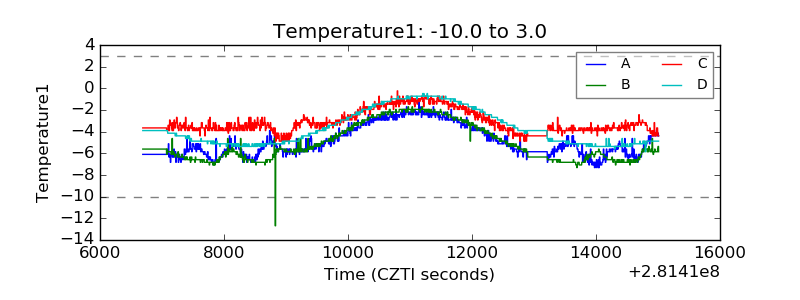 |
| Veto HV Monitor | 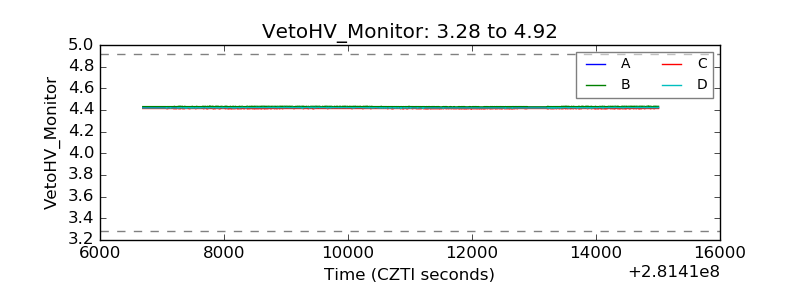 |
| Veto LLD | 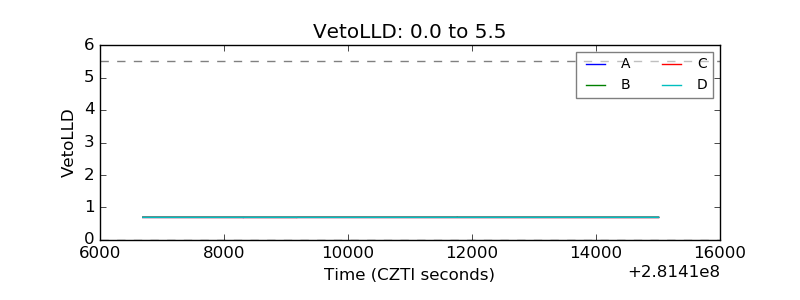 |
| Alpha Counter | 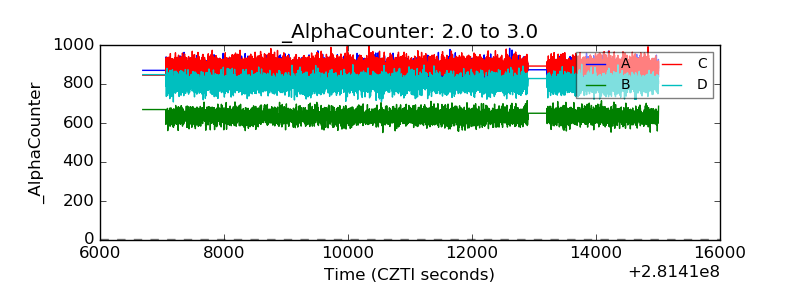 |
| _CPM_Rate | 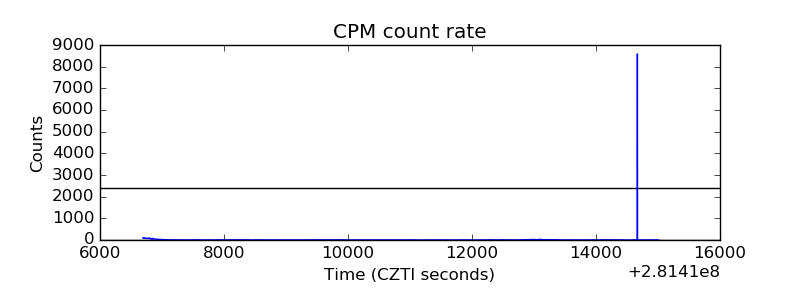 |
| CZT Counter | 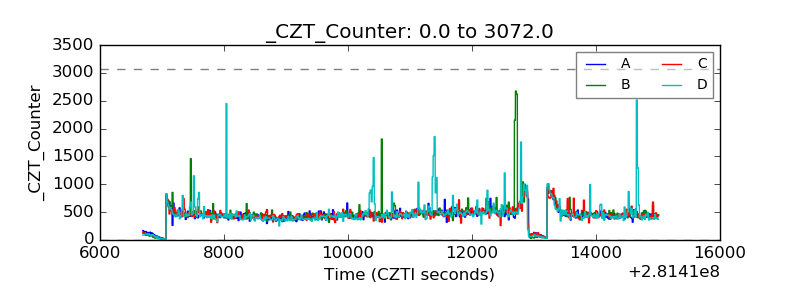 |
| +2.5 Volts monitor |  |
| +5 Volts monitor |  |
| _ROLL_ROT | 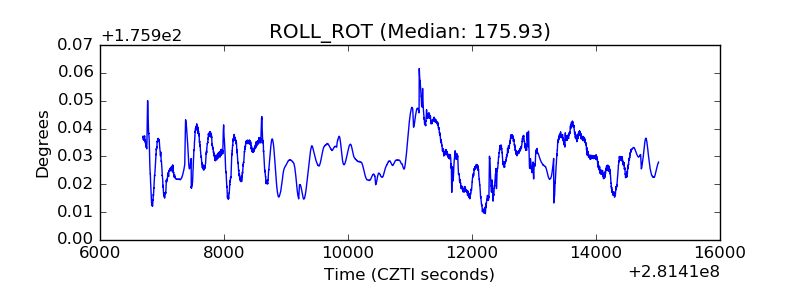 |
| _Roll_DEC | 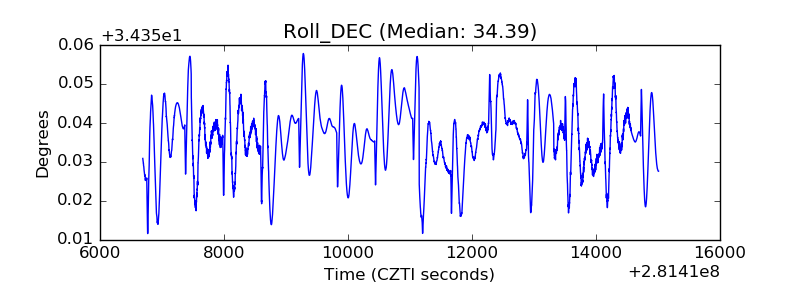 |
| _Roll_RA | 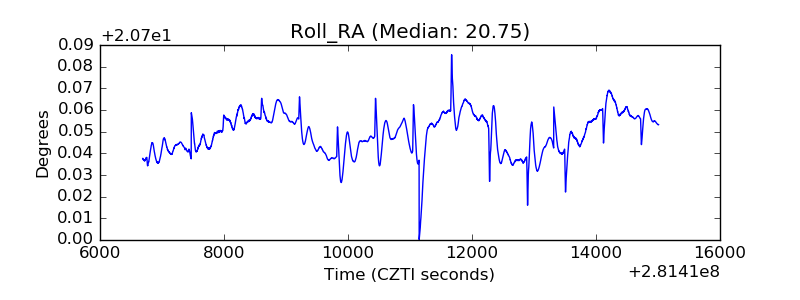 |
| Veto Counter | 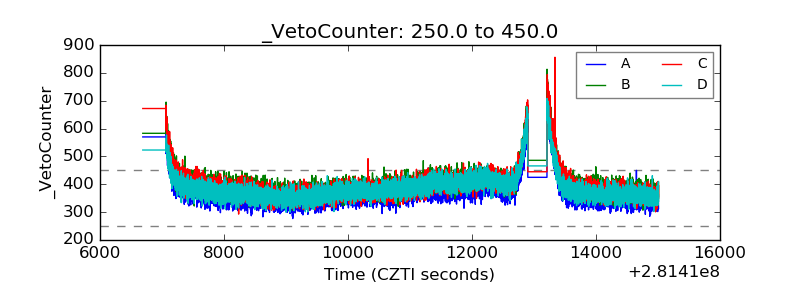 |