| Param | Original file | Final file |
|---|---|---|
| Filename | modeM0/AS1A05_185T04_9000002548_17186cztM0_level2.evt | modeM0/AS1A05_185T04_9000002548_17186cztM0_level2_quad_clean.evt |
| Size (bytes) | 587,545,920 | 98,412,480 |
| Size | 560.3 MB | 93.9 MB |
| Events in quadrant A | 4,107,112 | 611,777 |
| Events in quadrant B | 4,291,088 | 609,603 |
| Events in quadrant C | 4,130,613 | 590,711 |
| Events in quadrant D | 4,693,795 | 583,329 |
| Mode SS | |||
|---|---|---|---|
| Quadrant | BADHDUFLAG | Total packets | Discarded packets |
| A | 0 | 172 | 0 |
| B | 0 | 172 | 0 |
| C | 0 | 172 | 0 |
| D | 0 | 172 | 0 |
| Mode M9 | |||
|---|---|---|---|
| Quadrant | BADHDUFLAG | Total packets | Discarded packets |
| A | 0 | 5 | 0 |
| B | 0 | 5 | 0 |
| C | 0 | 5 | 0 |
| D | 0 | 5 | 0 |
| Mode M0 | |||
|---|---|---|---|
| Quadrant | BADHDUFLAG | Total packets | Discarded packets |
| A | 0 | 17775 | 2 |
| B | 0 | 18144 | 2 |
| C | 0 | 17630 | 2 |
| D | 0 | 19777 | 2 |
| Quadrant | Total seconds | Saturated seconds | Saturation percentage |
|---|---|---|---|
| A | 8416 | 259 | 3.077471% |
| B | 8417 | 345 | 4.098848% |
| C | 8416 | 290 | 3.445817% |
| D | 8416 | 249 | 2.958650% |
Noise dominated data is calculated using 1-second bins in cleaned event files. If a bin has >2000 counts, and if more than 50% of those come from <1% of pixels, then it is considered to be noise-dominated and hence unusable.
| Quadrant | # 1 sec bins | Bins with >0 counts | Bins with >2000 counts | High rate bins dominated by noise | Noise dominated (total time) | Noise dominated (detector-on time) | Marked lightcurve |
|---|---|---|---|---|---|---|---|
| A | 8941 | 8418 | 4 | 4 | 0.04% | 0.05% | 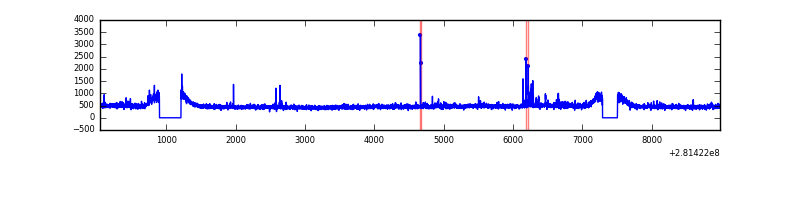 |
| B | 8942 | 8419 | 29 | 29 | 0.32% | 0.34% | 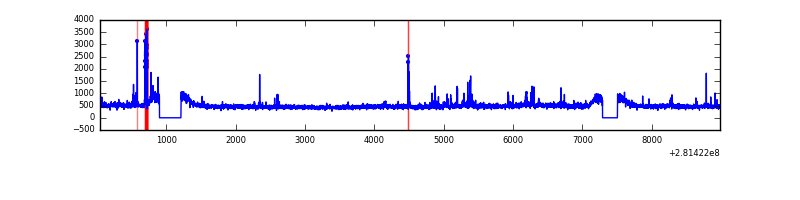 |
| C | 8941 | 8418 | 0 | 0 | 0.00% | 0.00% | 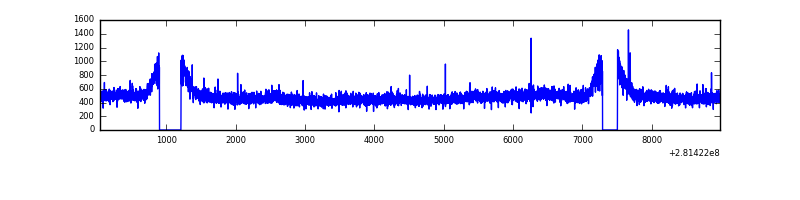 |
| D | 8941 | 8418 | 73 | 73 | 0.82% | 0.87% | 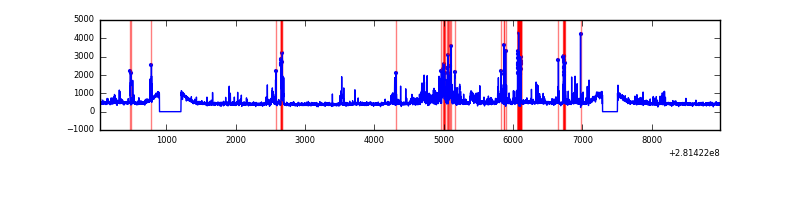 |
Top three noisy pixels from each quadrant. If the there are fewer than three noisy pixels in the level2.evt file, extra rows are filled as -1
| Pixel properties | Quadrant properties | ||||||
|---|---|---|---|---|---|---|---|
| Quadrant | DetID | PixID | Counts | Sigma | Mean | Median | Sigma |
| A | 12 | 189 | 69323 | 325.77 | 1033 | 1007 | 209.7 |
| A | 12 | 96 | 55638 | 260.51 | 1033 | 1007 | 209.7 |
| A | 9 | 143 | 10511 | 45.32 | 1033 | 1007 | 209.7 |
| B | 0 | 219 | 104827 | 518.15 | 1033 | 1004 | 200.4 |
| B | 0 | 197 | 25099 | 120.25 | 1033 | 1004 | 200.4 |
| B | 12 | 111 | 24251 | 116.02 | 1033 | 1004 | 200.4 |
| C | 14 | 238 | 152405 | 634.99 | 1000 | 1004 | 238.4 |
| C | 3 | 233 | 73966 | 306.01 | 1000 | 1004 | 238.4 |
| C | 13 | 61 | 7204 | 26.0 | 1000 | 1004 | 238.4 |
| D | 5 | 222 | 692240 | 2776.6 | 1011 | 978 | 249.0 |
| D | 10 | 70 | 118599 | 472.45 | 1011 | 978 | 249.0 |
| D | 12 | 233 | 44268 | 173.88 | 1011 | 978 | 249.0 |
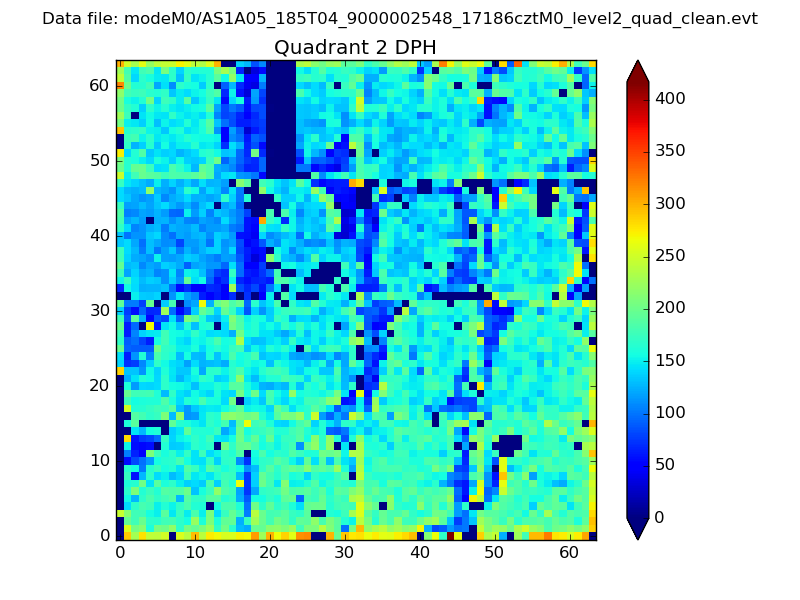
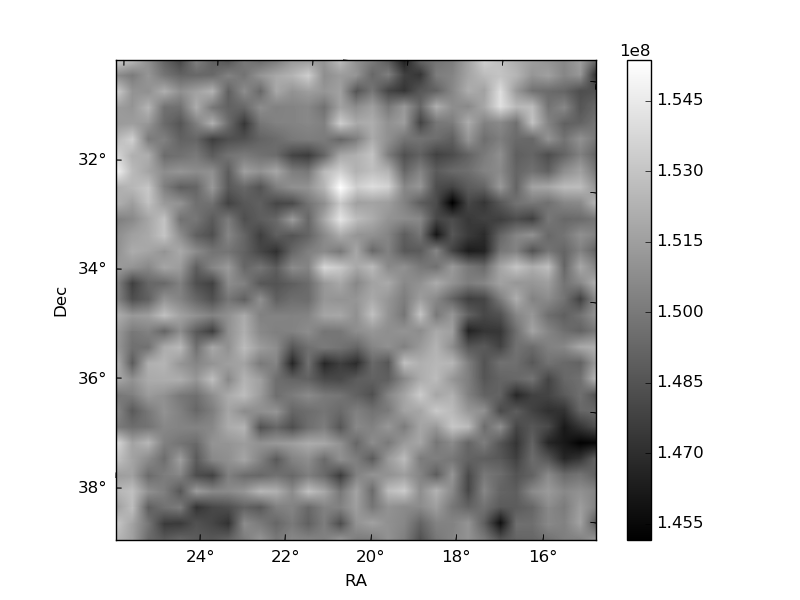
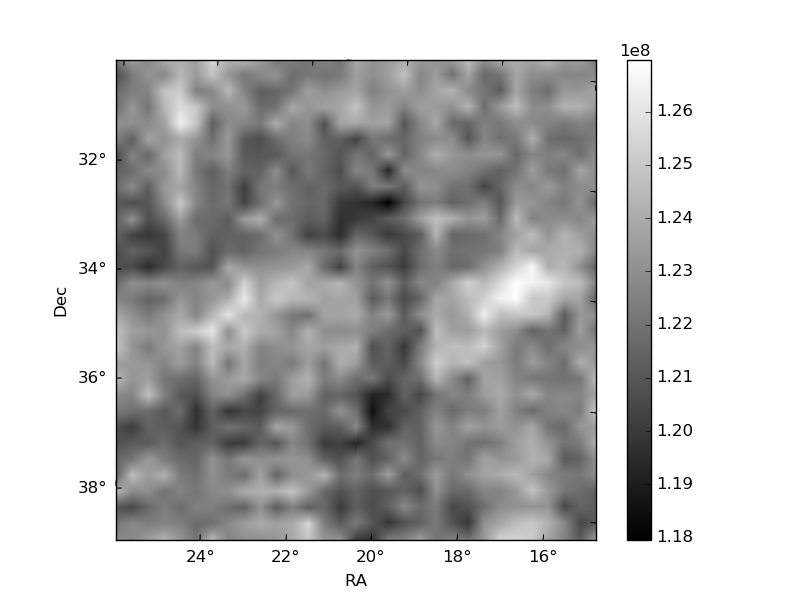
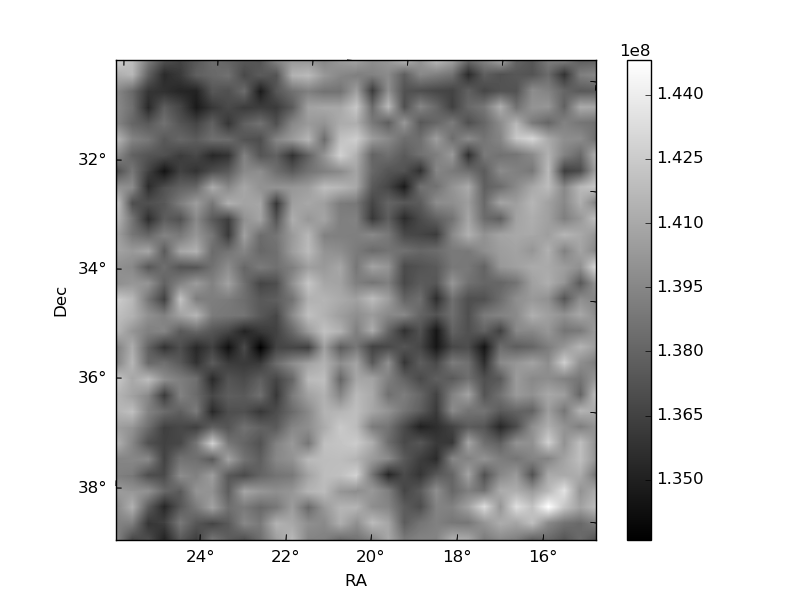
Histogram calculated using DETX and DETY for each event in the final _common_clean file
| Quadrant A | 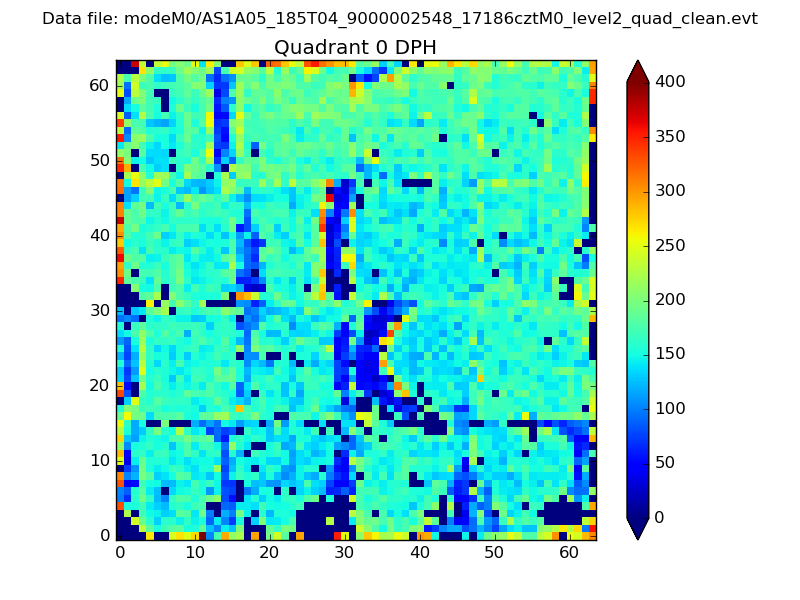 |
 |
Quadrant B |
|---|---|---|---|
| Quadrant D | 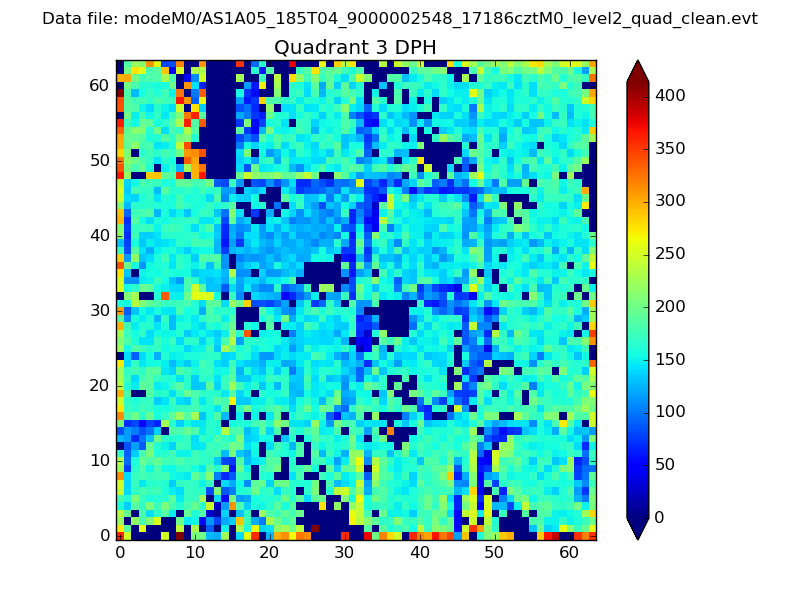 |
 |
Quadrant C |
| Plot type | Count rate plots | Images |
|---|---|---|
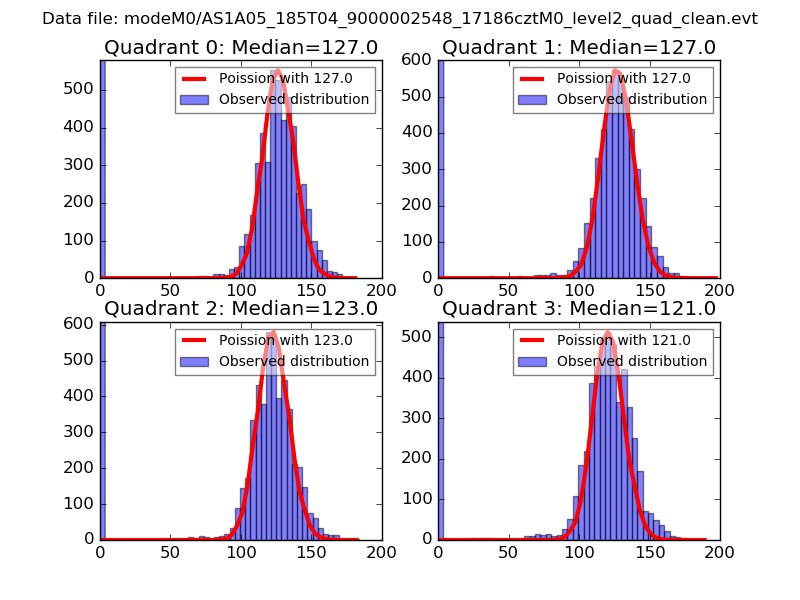
| Comparison with Poisson distribution Blue bars denote a histogram of data divided into 1 sec bins. Red curve is a Poisson curve with rate = median count rate of data. |
 |
 |
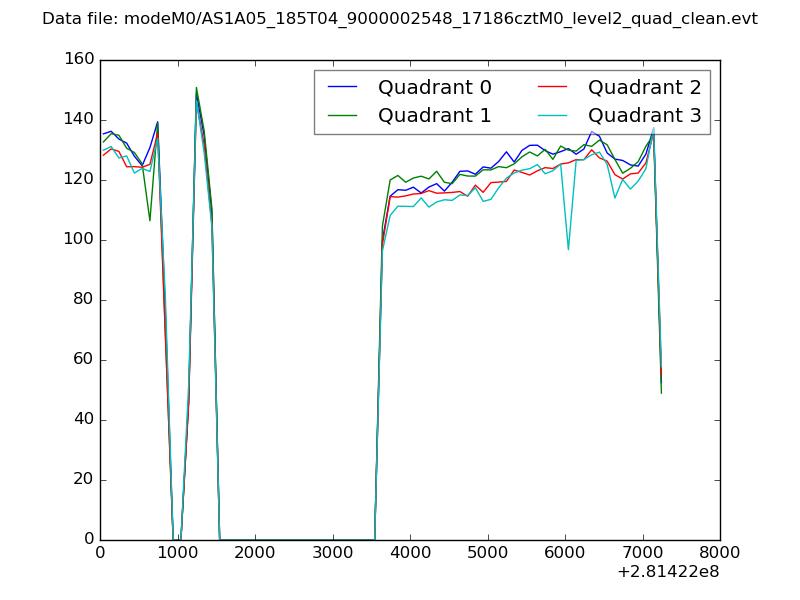
| Quadrant-wise count rates Data is divided into 100 sec bins |
 |
|
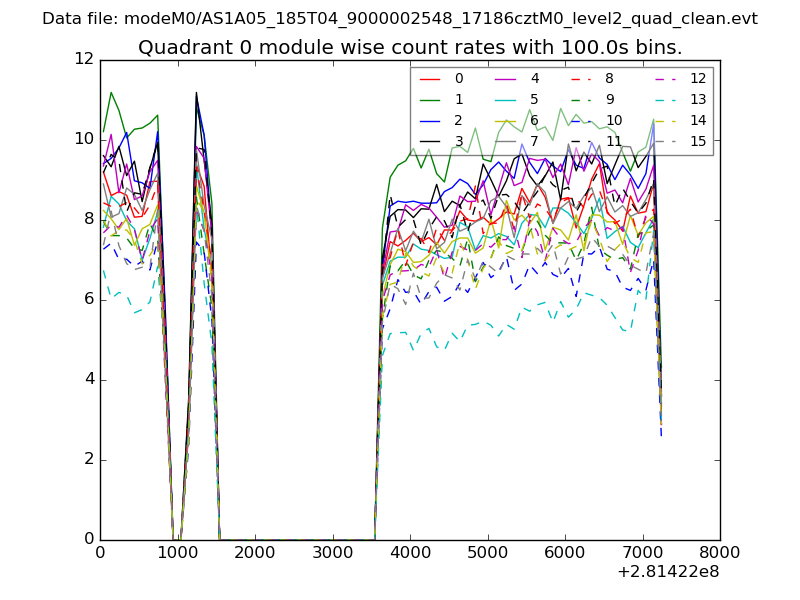
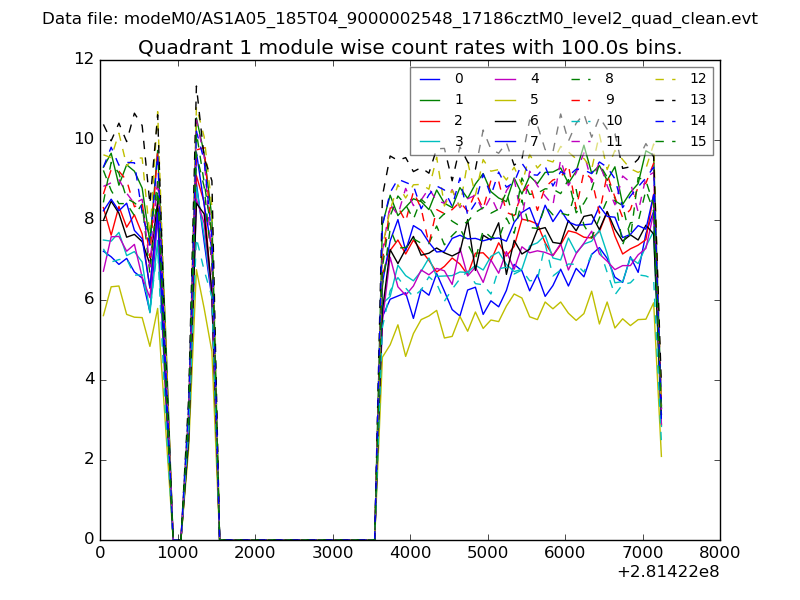
| Module-wise count rates for Quadrant A Data is divided into 100 sec bins |
 |
 |
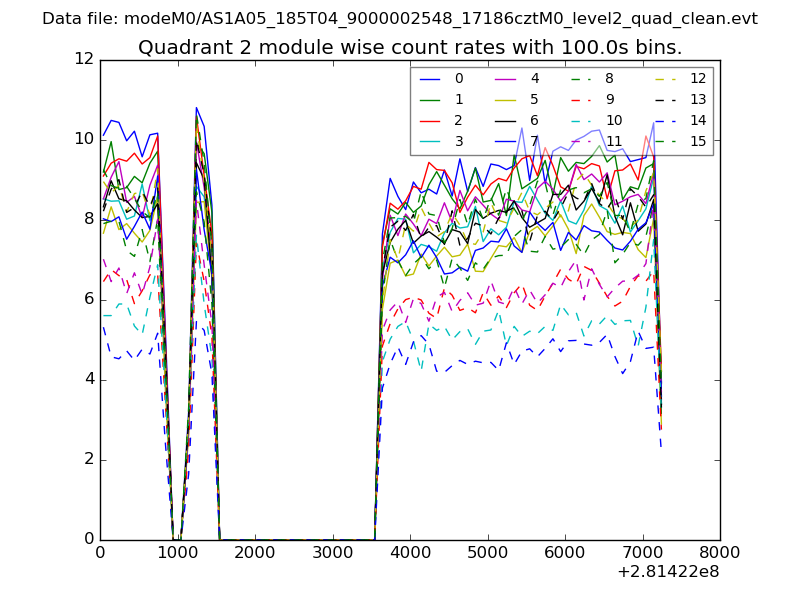
| Module-wise count rates for Quadrant B Data is divided into 100 sec bins |
 |
 |
| Module-wise count rates for Quadrant C Data is divided into 100 sec bins |
 |
 |
| Module-wise count rates for Quadrant D Data is divided into 100 sec bins |
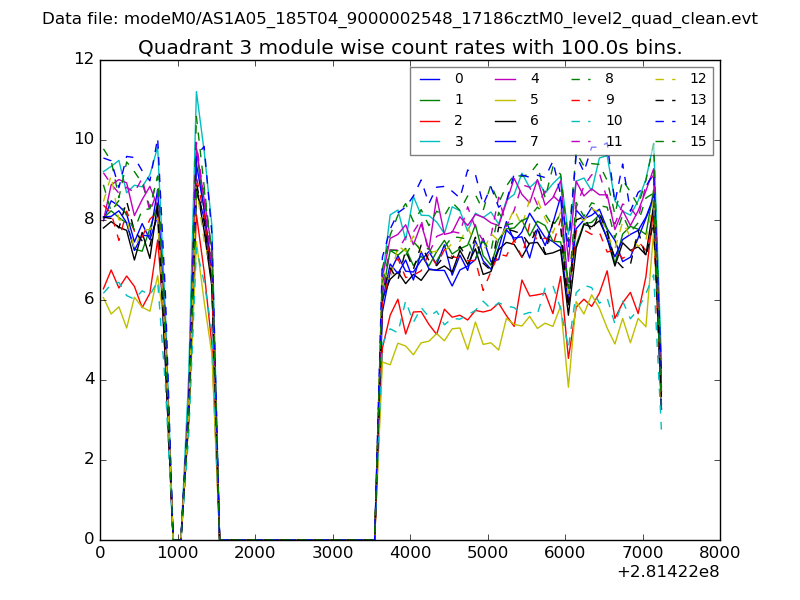 |
 |
| Parameter | Plot |
|---|---|
| CZT HV Monitor | 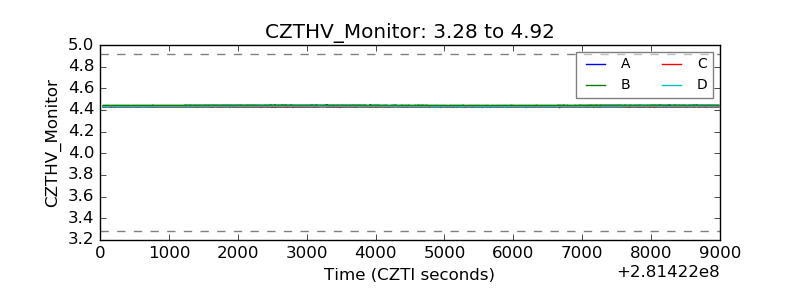 |
| D_VDD | 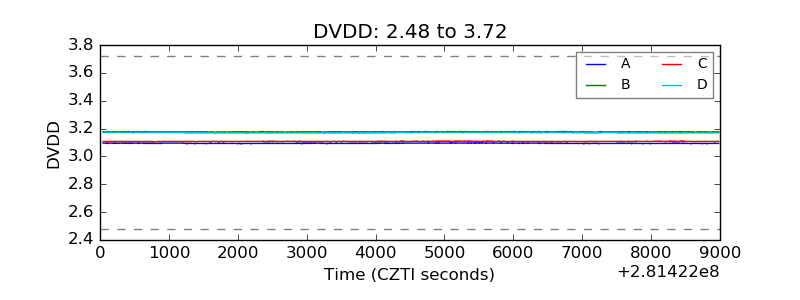 |
| Temperature 1 |  |
| Veto HV Monitor | 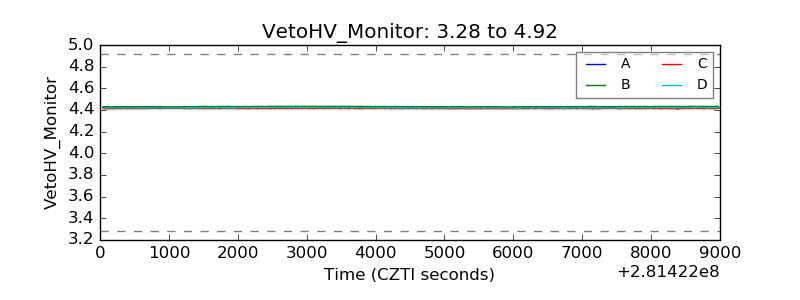 |
| Veto LLD |  |
| Alpha Counter | 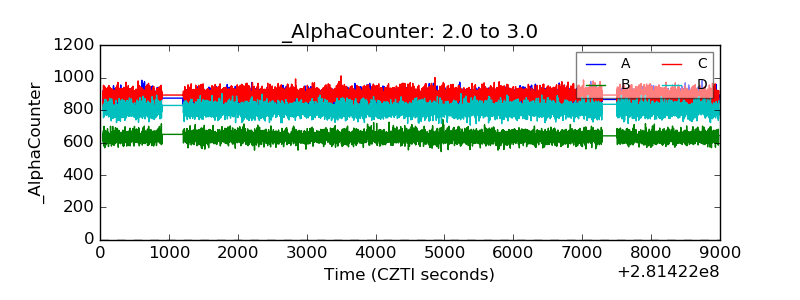 |
| _CPM_Rate | 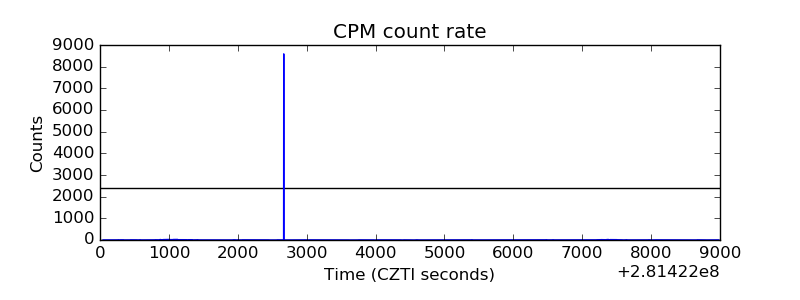 |
| CZT Counter | 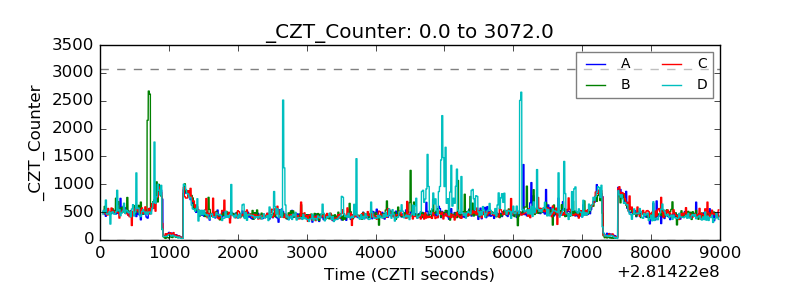 |
| +2.5 Volts monitor |  |
| +5 Volts monitor | 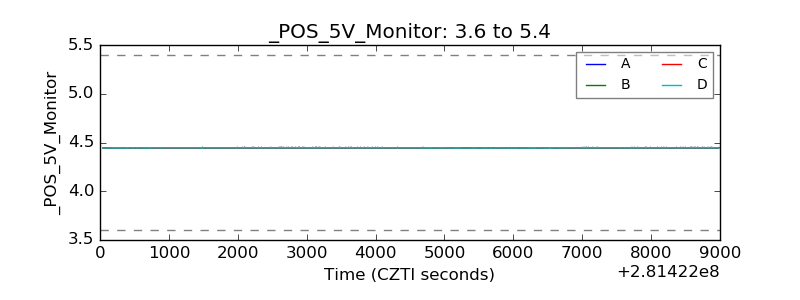 |
| _ROLL_ROT | 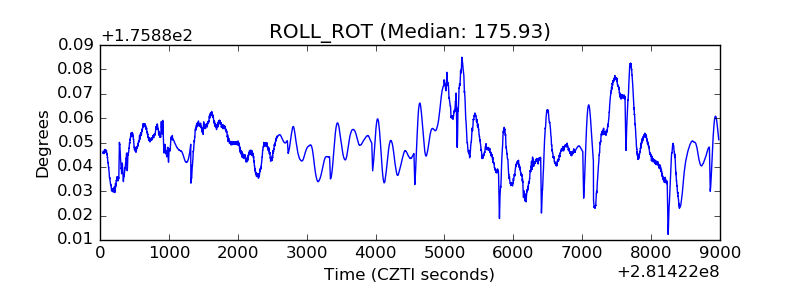 |
| _Roll_DEC | 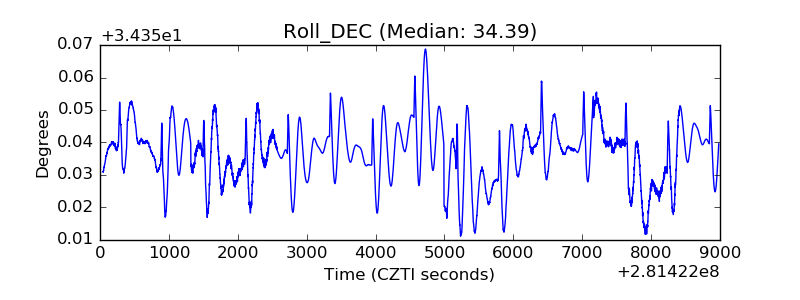 |
| _Roll_RA |  |
| Veto Counter | 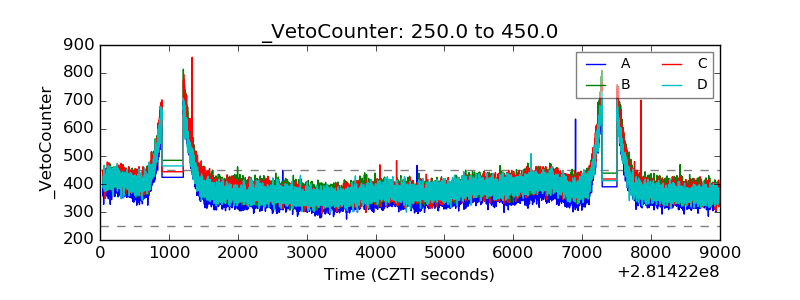 |