| Param | Original file | Final file |
|---|---|---|
| Filename | modeM0/AS1A05_185T04_9000002548_17189cztM0_level2.evt | modeM0/AS1A05_185T04_9000002548_17189cztM0_level2_quad_clean.evt |
| Size (bytes) | 1,064,445,120 | 202,066,560 |
| Size | 1015.1 MB | 192.7 MB |
| Events in quadrant A | 7,595,965 | 1,281,333 |
| Events in quadrant B | 7,761,586 | 1,284,725 |
| Events in quadrant C | 7,473,152 | 1,235,693 |
| Events in quadrant D | 8,335,826 | 1,227,430 |
| Mode SS | |||
|---|---|---|---|
| Quadrant | BADHDUFLAG | Total packets | Discarded packets |
| A | 0 | 322 | 0 |
| B | 0 | 322 | 0 |
| C | 0 | 322 | 0 |
| D | 0 | 322 | 0 |
| Mode M9 | |||
|---|---|---|---|
| Quadrant | BADHDUFLAG | Total packets | Discarded packets |
| A | 0 | 12 | 0 |
| B | 0 | 12 | 0 |
| C | 0 | 12 | 0 |
| D | 0 | 12 | 0 |
| Mode M0 | |||
|---|---|---|---|
| Quadrant | BADHDUFLAG | Total packets | Discarded packets |
| A | 0 | 33032 | 3 |
| B | 0 | 33269 | 3 |
| C | 0 | 32412 | 3 |
| D | 0 | 35596 | 3 |
| Quadrant | Total seconds | Saturated seconds | Saturation percentage |
|---|---|---|---|
| A | 15814 | 318 | 2.010876% |
| B | 15814 | 362 | 2.289111% |
| C | 15814 | 322 | 2.036170% |
| D | 15814 | 258 | 1.631466% |
Noise dominated data is calculated using 1-second bins in cleaned event files. If a bin has >2000 counts, and if more than 50% of those come from <1% of pixels, then it is considered to be noise-dominated and hence unusable.
| Quadrant | # 1 sec bins | Bins with >0 counts | Bins with >2000 counts | High rate bins dominated by noise | Noise dominated (total time) | Noise dominated (detector-on time) | Marked lightcurve |
|---|---|---|---|---|---|---|---|
| A | 17014 | 15816 | 24 | 24 | 0.14% | 0.15% | 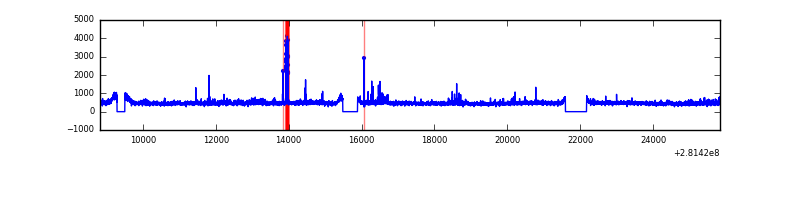 |
| B | 17014 | 15816 | 34 | 34 | 0.20% | 0.21% | 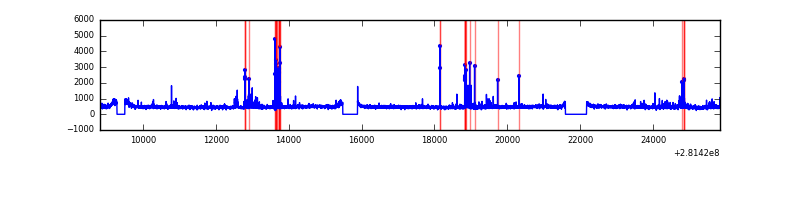 |
| C | 17014 | 15816 | 0 | 0 | 0.00% | 0.00% | 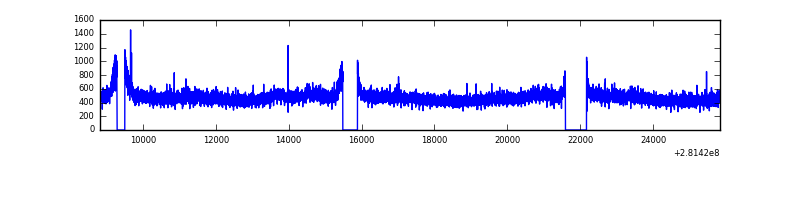 |
| D | 17014 | 15816 | 61 | 61 | 0.36% | 0.39% | 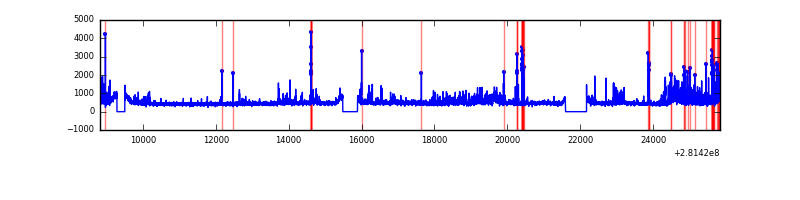 |
Top three noisy pixels from each quadrant. If the there are fewer than three noisy pixels in the level2.evt file, extra rows are filled as -1
| Pixel properties | Quadrant properties | ||||||
|---|---|---|---|---|---|---|---|
| Quadrant | DetID | PixID | Counts | Sigma | Mean | Median | Sigma |
| A | 4 | 2 | 192117 | 502.12 | 1875 | 1832 | 379.0 |
| A | 12 | 189 | 188902 | 493.64 | 1875 | 1832 | 379.0 |
| A | 0 | 226 | 16324 | 38.24 | 1875 | 1832 | 379.0 |
| B | 7 | 220 | 155295 | 425.6 | 1869 | 1821 | 360.6 |
| B | 0 | 219 | 70607 | 190.75 | 1869 | 1821 | 360.6 |
| B | 15 | 35 | 65903 | 177.71 | 1869 | 1821 | 360.6 |
| C | 14 | 238 | 275983 | 651.9 | 1797 | 1806 | 420.6 |
| C | 3 | 233 | 183201 | 431.29 | 1797 | 1806 | 420.6 |
| C | 13 | 61 | 12877 | 26.32 | 1797 | 1806 | 420.6 |
| D | 5 | 222 | 1136022 | 2554.05 | 1829 | 1774 | 444.1 |
| D | 10 | 70 | 132585 | 294.55 | 1829 | 1774 | 444.1 |
| D | 2 | 234 | 67802 | 148.68 | 1829 | 1774 | 444.1 |
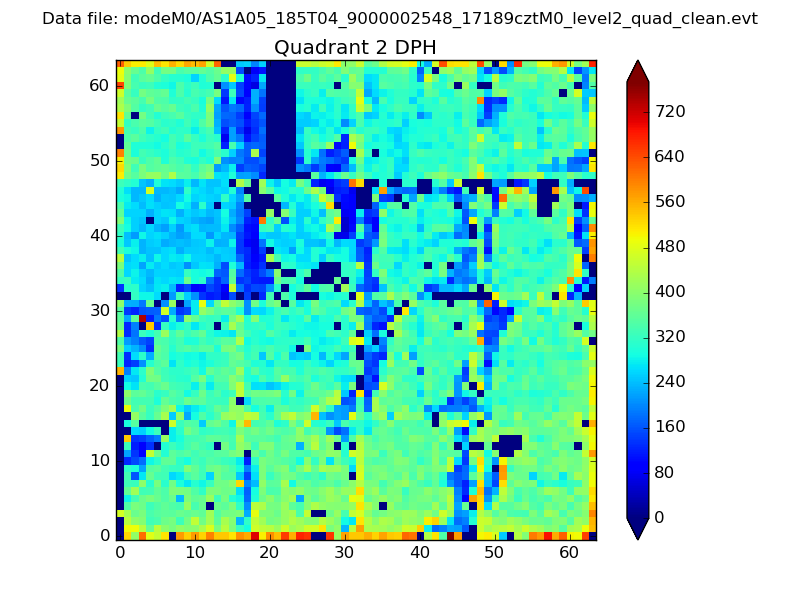
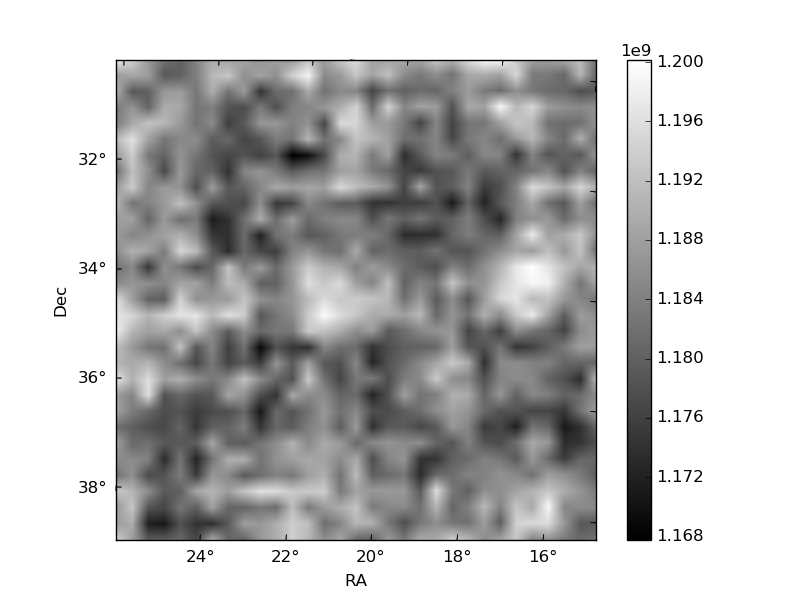
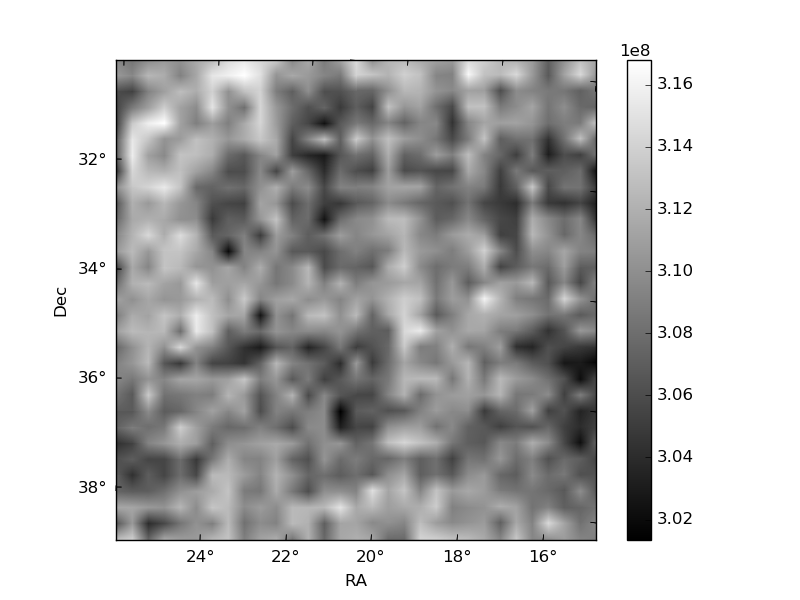
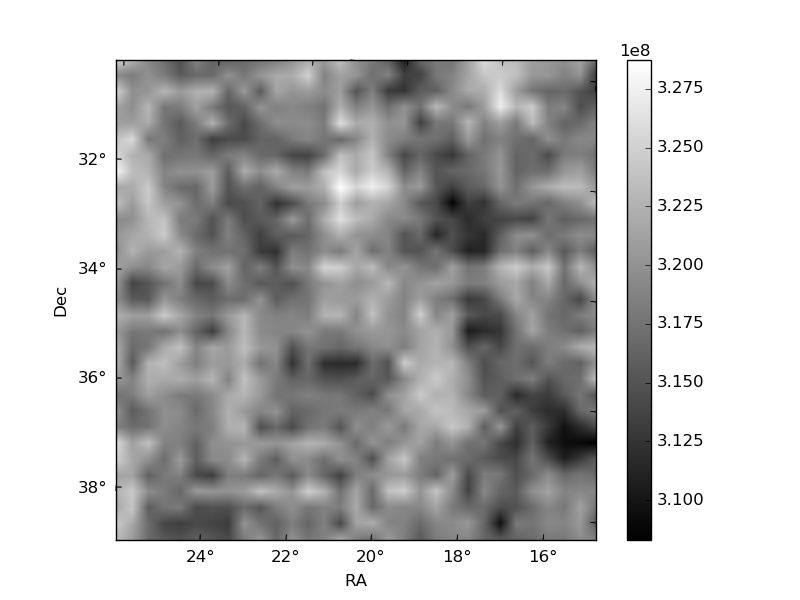
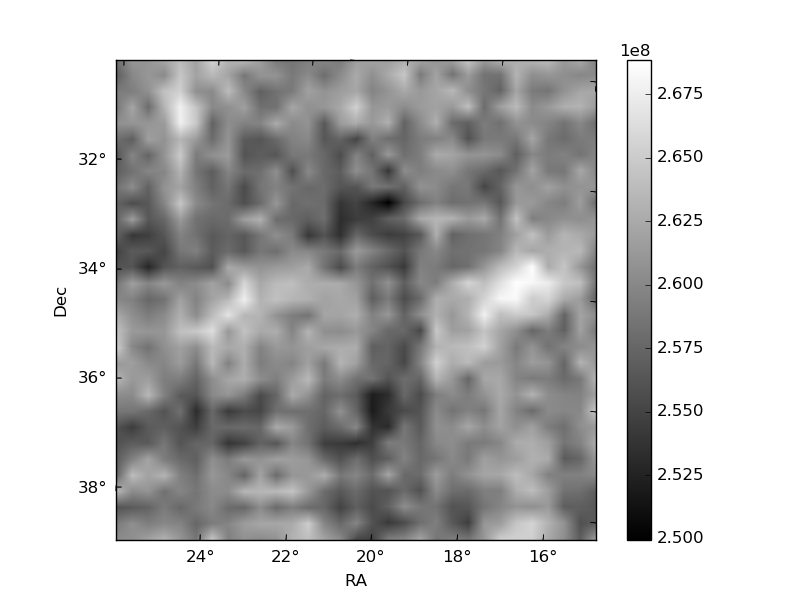
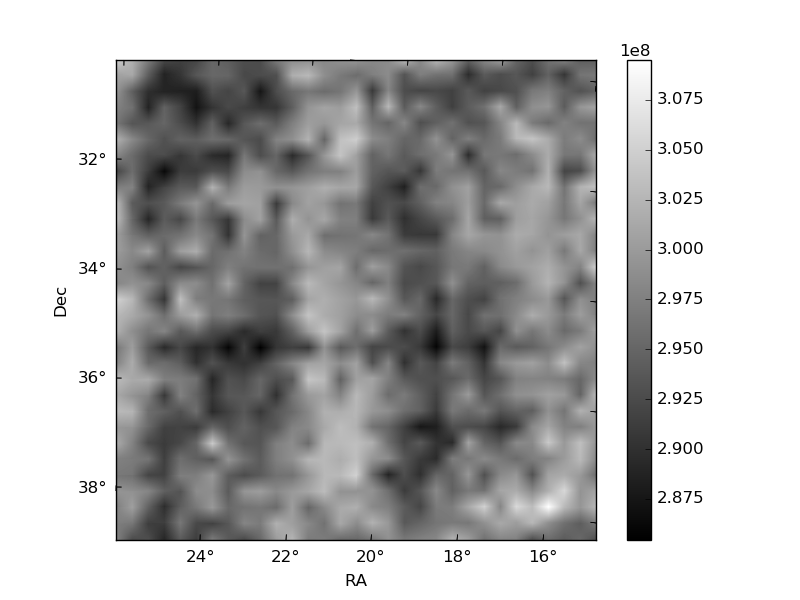
Histogram calculated using DETX and DETY for each event in the final _common_clean file
| Quadrant A | 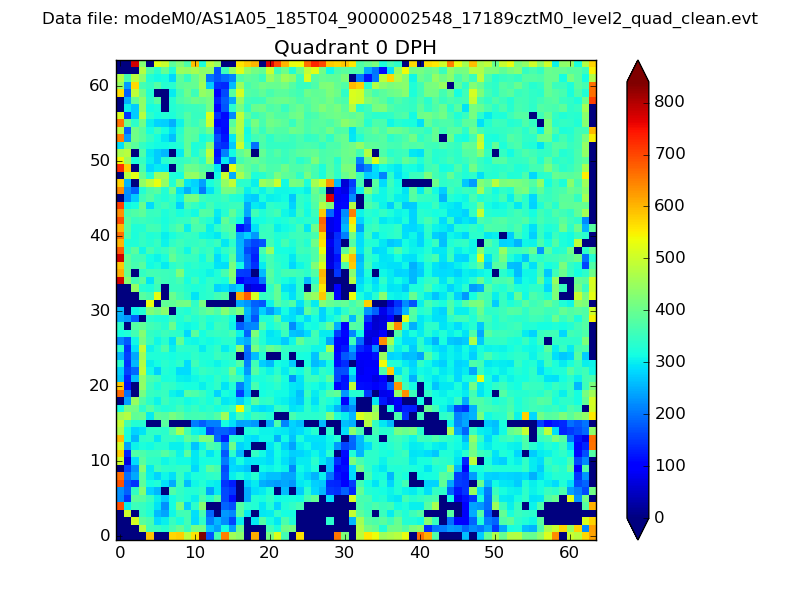 |
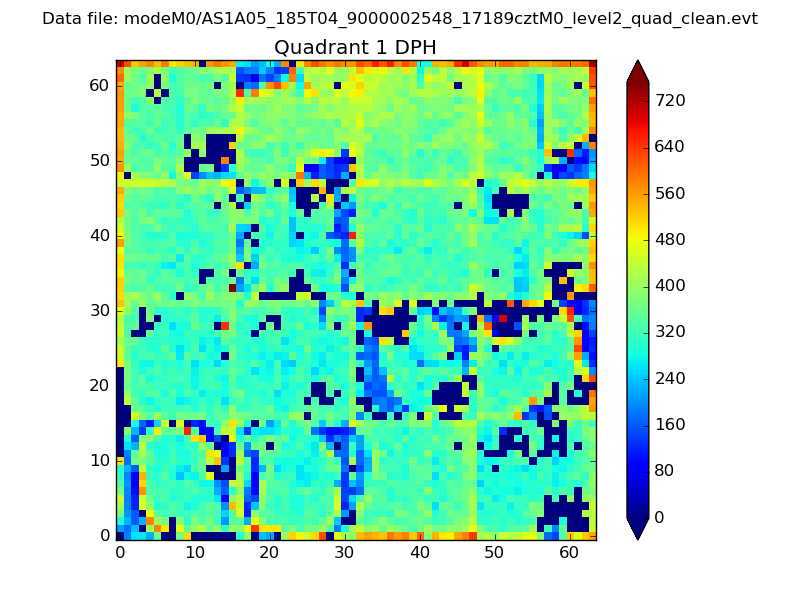 |
Quadrant B |
|---|---|---|---|
| Quadrant D | 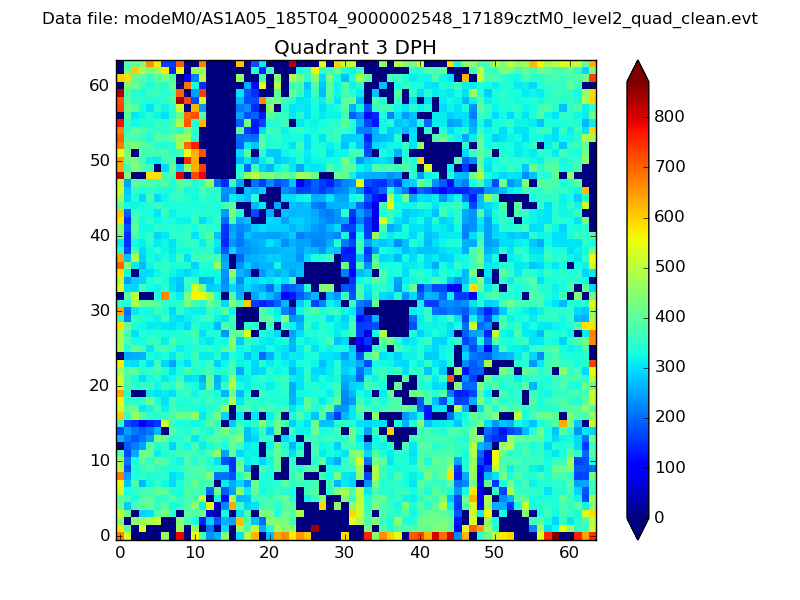 |
 |
Quadrant C |
| Plot type | Count rate plots | Images |
|---|---|---|
| Comparison with Poisson distribution Blue bars denote a histogram of data divided into 1 sec bins. Red curve is a Poisson curve with rate = median count rate of data. |
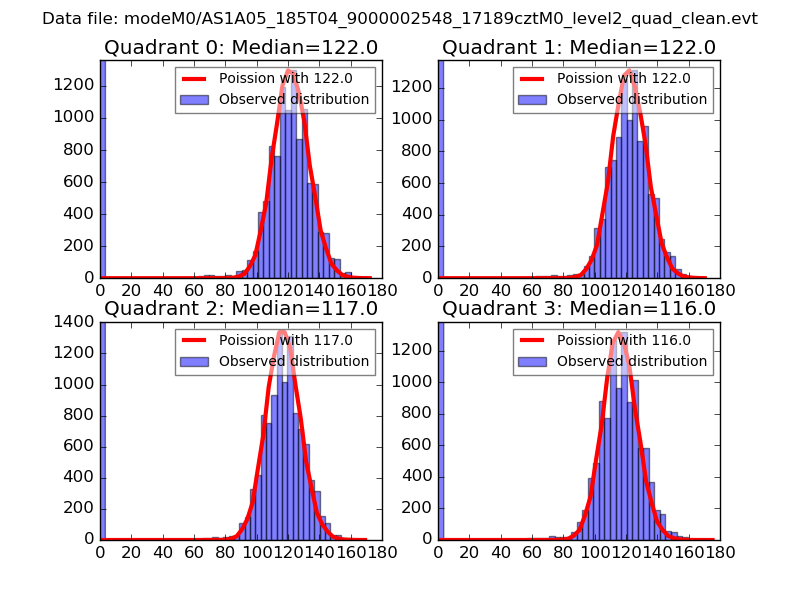 |
 |
| Quadrant-wise count rates Data is divided into 100 sec bins |
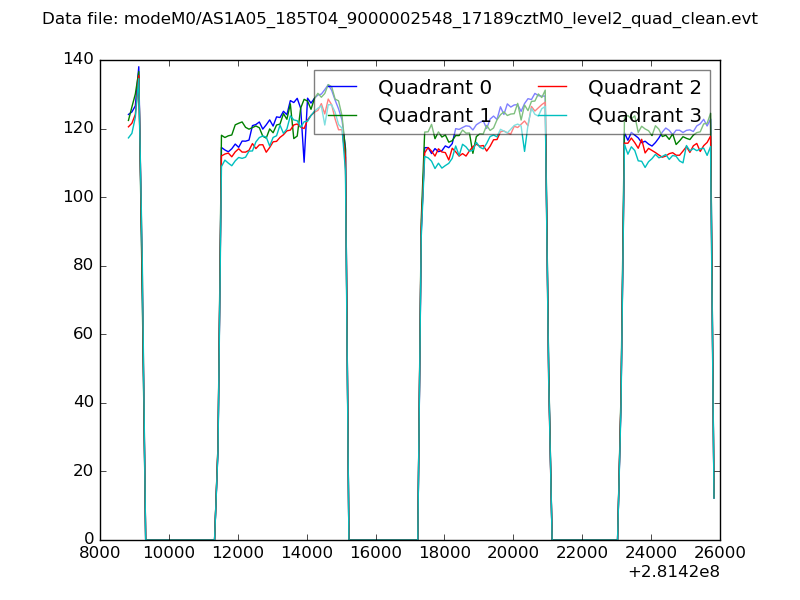 |
|
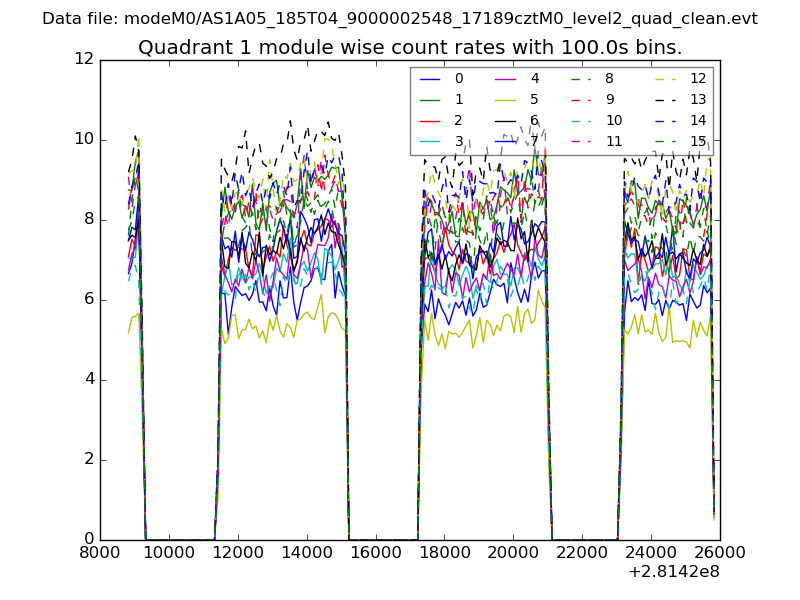
| Module-wise count rates for Quadrant A Data is divided into 100 sec bins |
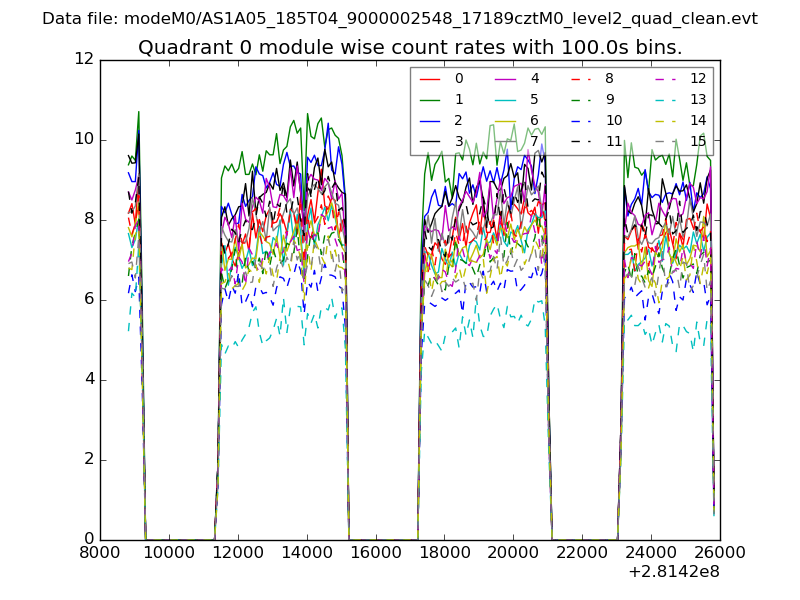 |
 |
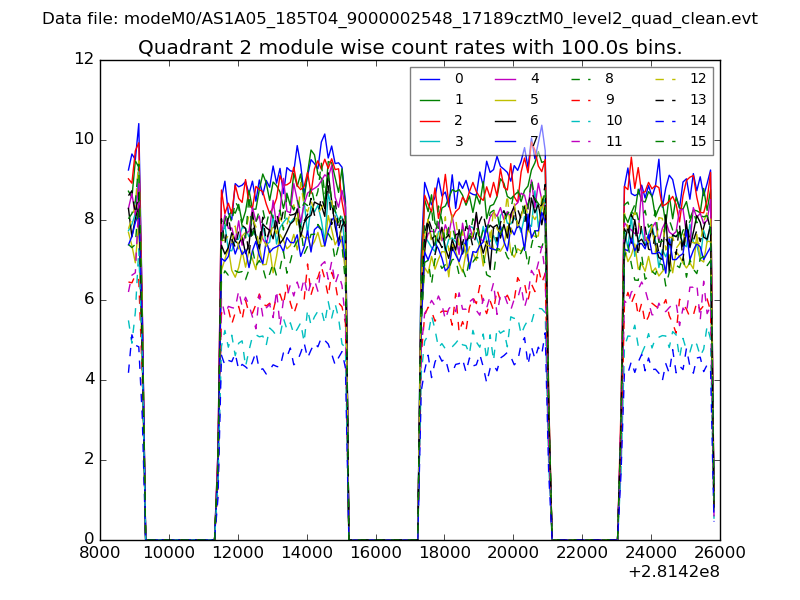
| Module-wise count rates for Quadrant B Data is divided into 100 sec bins |
 |
 |
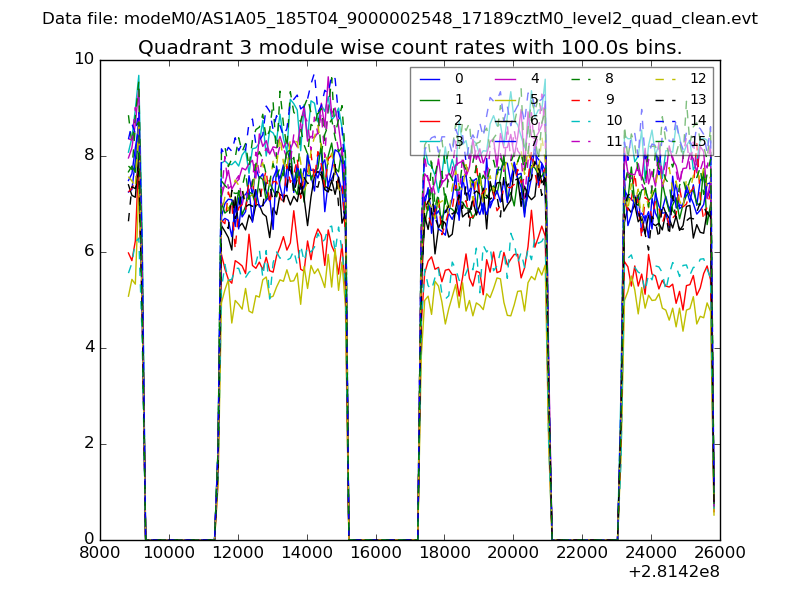
| Module-wise count rates for Quadrant C Data is divided into 100 sec bins |
 |
 |
| Module-wise count rates for Quadrant D Data is divided into 100 sec bins |
 |
 |
| Parameter | Plot |
|---|---|
| CZT HV Monitor | 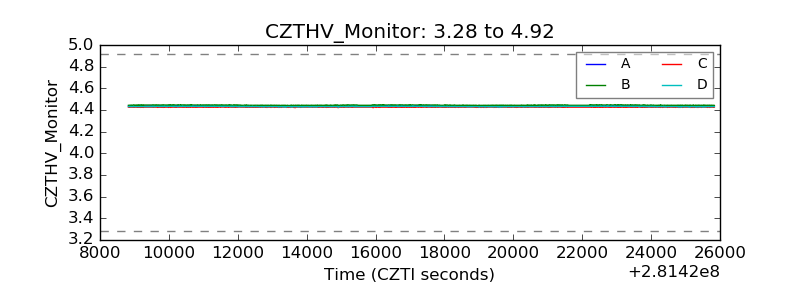 |
| D_VDD | 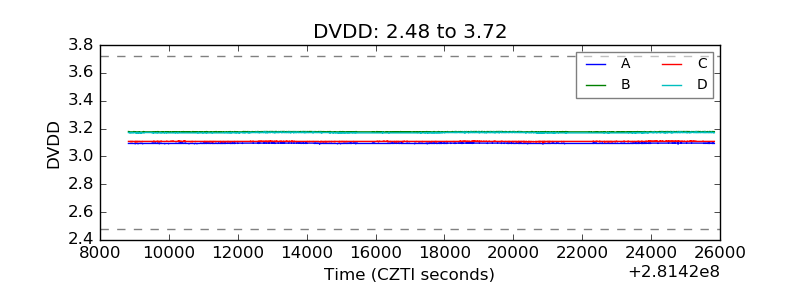 |
| Temperature 1 | 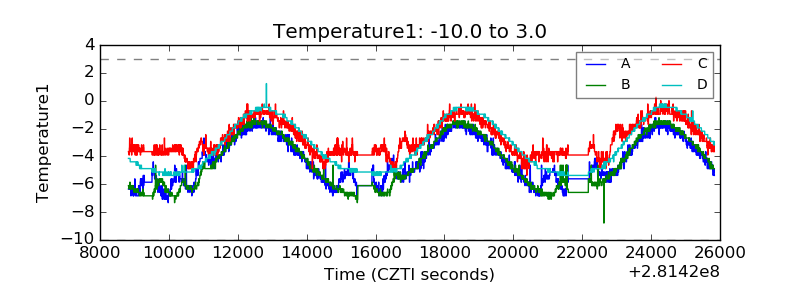 |
| Veto HV Monitor | 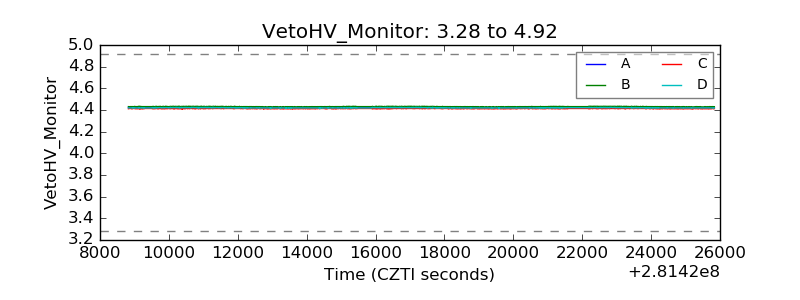 |
| Veto LLD | 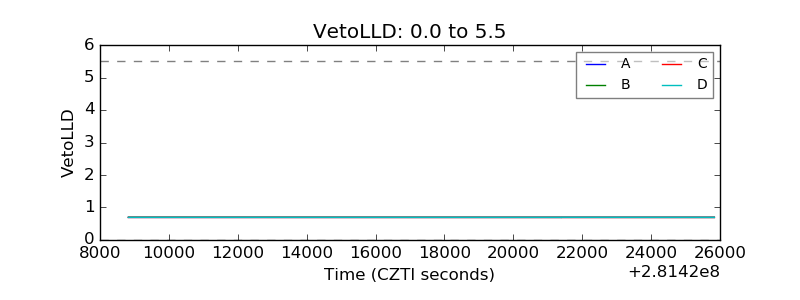 |
| Alpha Counter |  |
| _CPM_Rate | 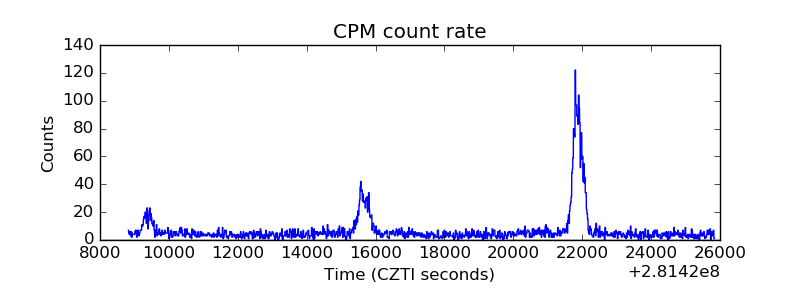 |
| CZT Counter | 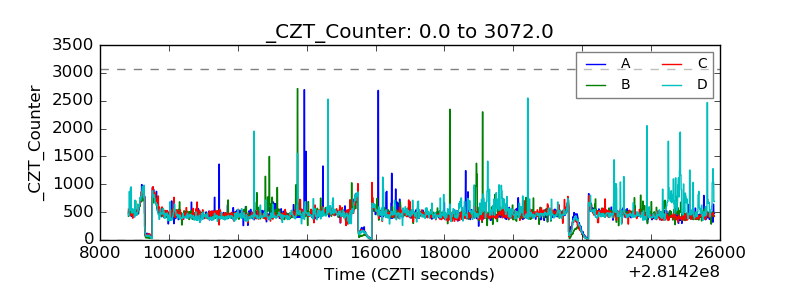 |
| +2.5 Volts monitor |  |
| +5 Volts monitor | 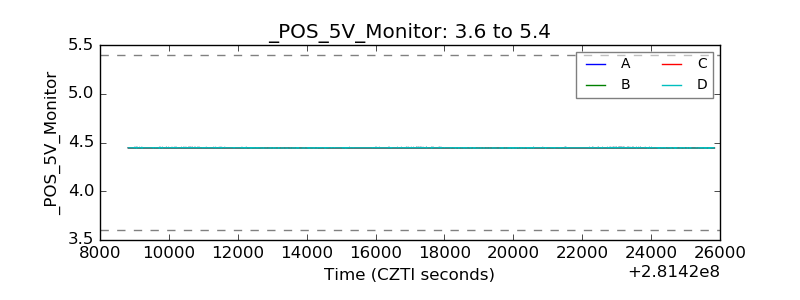 |
| _ROLL_ROT | 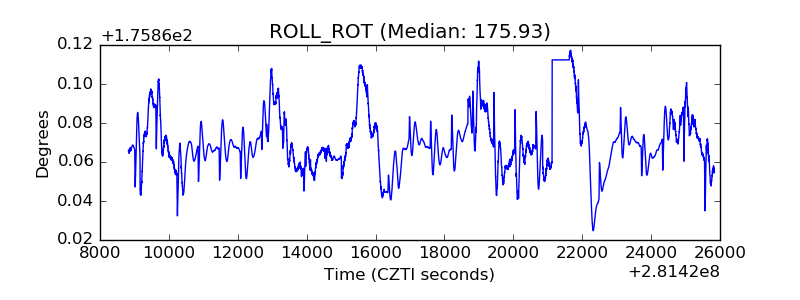 |
| _Roll_DEC | 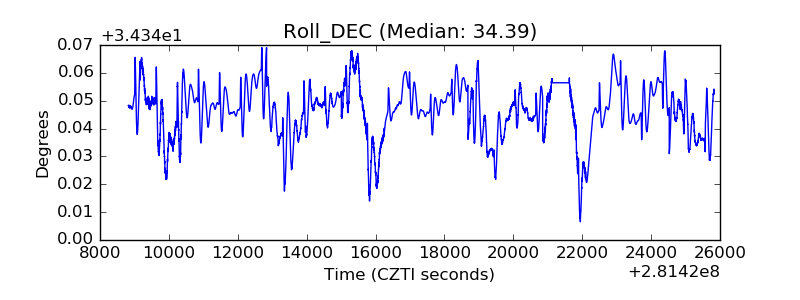 |
| _Roll_RA | 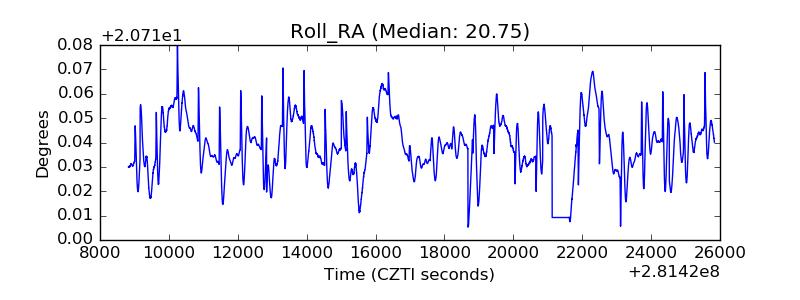 |
| Veto Counter | 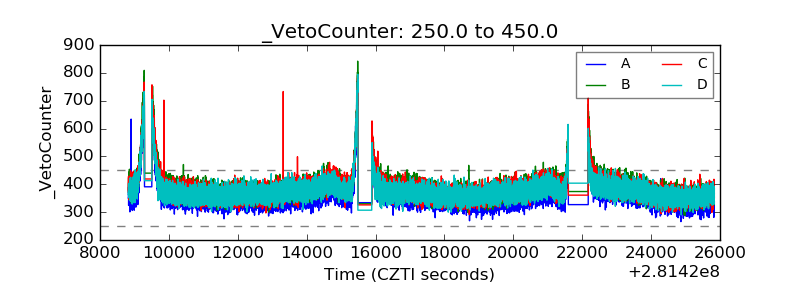 |