| Param | Original file | Final file |
|---|---|---|
| Filename | modeM0/AS1A05_185T04_9000002548_17193cztM0_level2.evt | modeM0/AS1A05_185T04_9000002548_17193cztM0_level2_quad_clean.evt |
| Size (bytes) | 519,788,160 | 104,106,240 |
| Size | 495.7 MB | 99.3 MB |
| Events in quadrant A | 3,310,362 | 700,282 |
| Events in quadrant B | 3,494,787 | 695,308 |
| Events in quadrant C | 4,830,789 | 647,522 |
| Events in quadrant D | 3,655,134 | 646,336 |
| Mode SS | |||
|---|---|---|---|
| Quadrant | BADHDUFLAG | Total packets | Discarded packets |
| A | 0 | 136 | 0 |
| B | 0 | 136 | 0 |
| C | 0 | 136 | 0 |
| D | 0 | 136 | 0 |
| Mode M9 | |||
|---|---|---|---|
| Quadrant | BADHDUFLAG | Total packets | Discarded packets |
| A | 0 | 11 | 0 |
| B | 0 | 12 | 0 |
| C | 0 | 12 | 0 |
| D | 0 | 12 | 0 |
| Mode M0 | |||
|---|---|---|---|
| Quadrant | BADHDUFLAG | Total packets | Discarded packets |
| A | 0 | 14183 | 2 |
| B | 0 | 14808 | 2 |
| C | 0 | 18885 | 2 |
| D | 0 | 15485 | 2 |
| Quadrant | Total seconds | Saturated seconds | Saturation percentage |
|---|---|---|---|
| A | 6643 | 69 | 1.038687% |
| B | 6643 | 98 | 1.475237% |
| C | 6643 | 190 | 2.860154% |
| D | 6643 | 222 | 3.341864% |
Noise dominated data is calculated using 1-second bins in cleaned event files. If a bin has >2000 counts, and if more than 50% of those come from <1% of pixels, then it is considered to be noise-dominated and hence unusable.
| Quadrant | # 1 sec bins | Bins with >0 counts | Bins with >2000 counts | High rate bins dominated by noise | Noise dominated (total time) | Noise dominated (detector-on time) | Marked lightcurve |
|---|---|---|---|---|---|---|---|
| A | 7793 | 6644 | 0 | 0 | 0.00% | 0.00% | 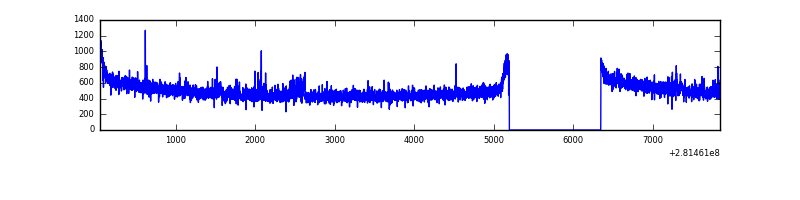 |
| B | 7793 | 6643 | 11 | 11 | 0.14% | 0.17% | 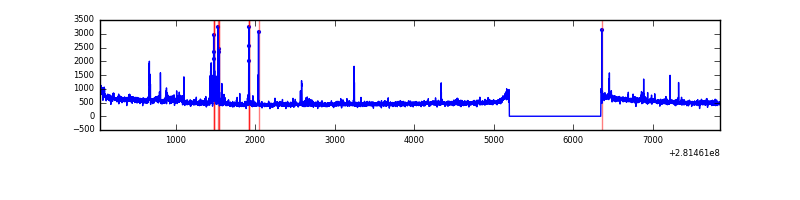 |
| C | 7793 | 6643 | 0 | 0 | 0.00% | 0.00% | 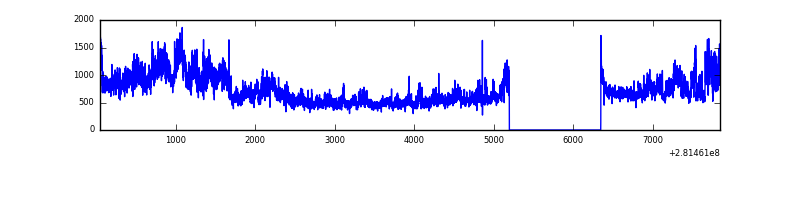 |
| D | 7793 | 6643 | 118 | 118 | 1.51% | 1.78% | 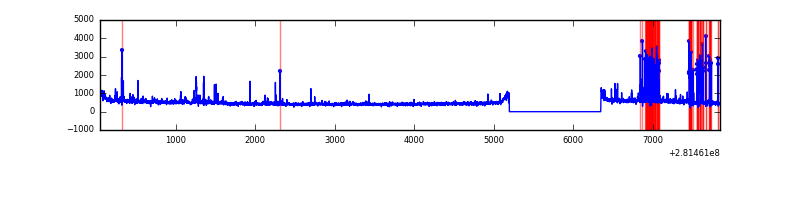 |
Top three noisy pixels from each quadrant. If the there are fewer than three noisy pixels in the level2.evt file, extra rows are filled as -1
| Pixel properties | Quadrant properties | ||||||
|---|---|---|---|---|---|---|---|
| Quadrant | DetID | PixID | Counts | Sigma | Mean | Median | Sigma |
| A | 12 | 189 | 71102 | 414.63 | 843 | 826 | 169.5 |
| A | 0 | 226 | 7376 | 38.65 | 843 | 826 | 169.5 |
| A | 12 | 194 | 6231 | 31.89 | 843 | 826 | 169.5 |
| B | 7 | 220 | 86827 | 539.85 | 834 | 814 | 159.3 |
| B | 0 | 219 | 65185 | 404.02 | 834 | 814 | 159.3 |
| B | 4 | 216 | 38720 | 237.91 | 834 | 814 | 159.3 |
| C | 3 | 233 | 1596707 | 8586.12 | 797 | 803 | 185.9 |
| C | 14 | 238 | 122530 | 654.9 | 797 | 803 | 185.9 |
| C | 13 | 61 | 5827 | 27.03 | 797 | 803 | 185.9 |
| D | 5 | 222 | 449287 | 2277.32 | 813 | 791 | 196.9 |
| D | 12 | 233 | 43156 | 215.12 | 813 | 791 | 196.9 |
| D | 1 | 52 | 34395 | 170.63 | 813 | 791 | 196.9 |
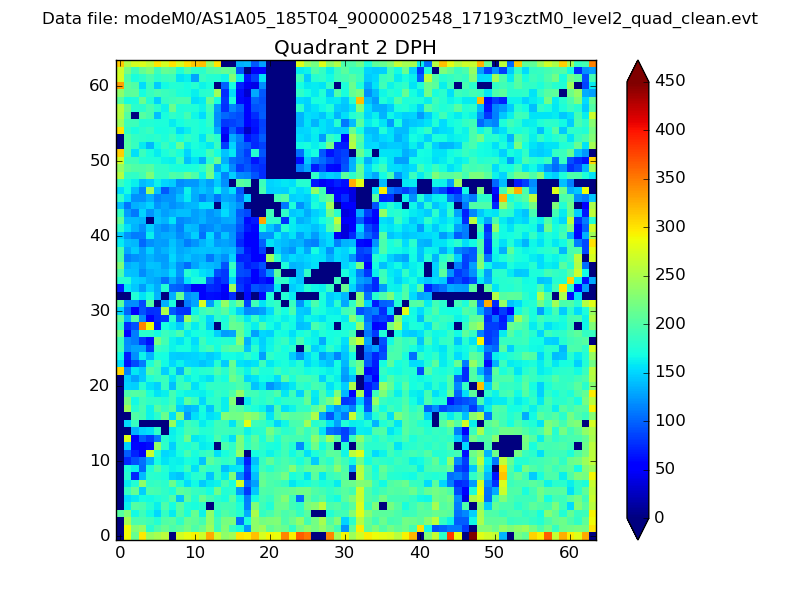
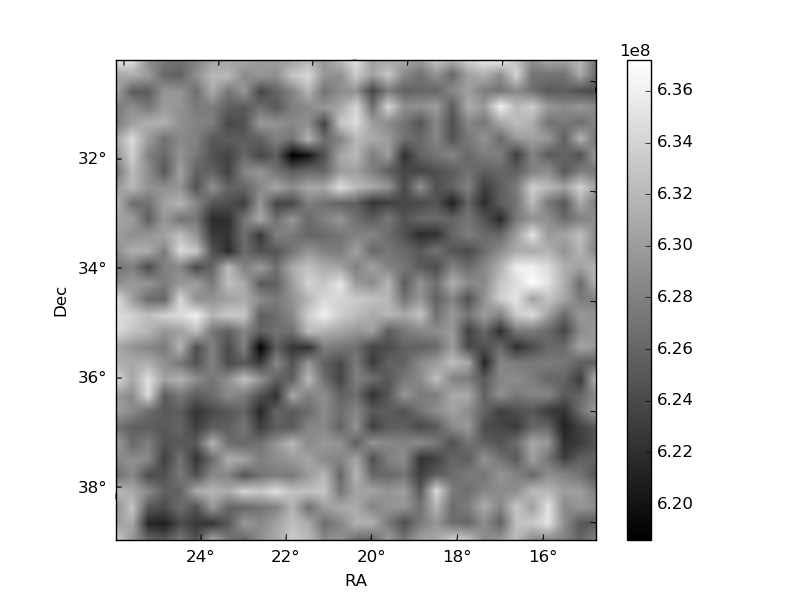
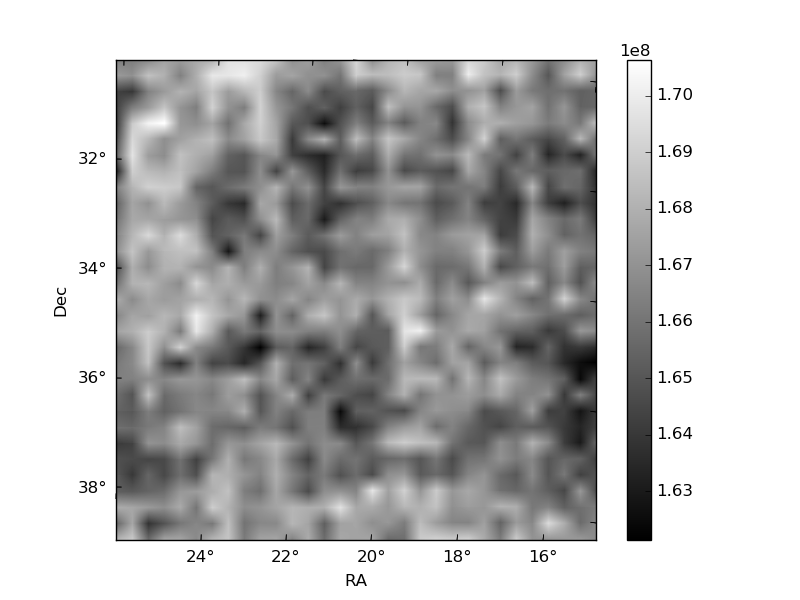
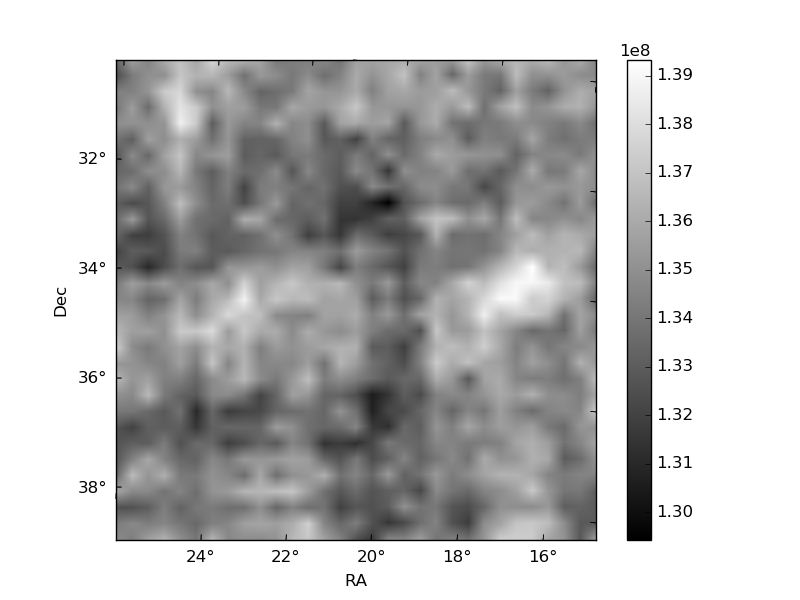
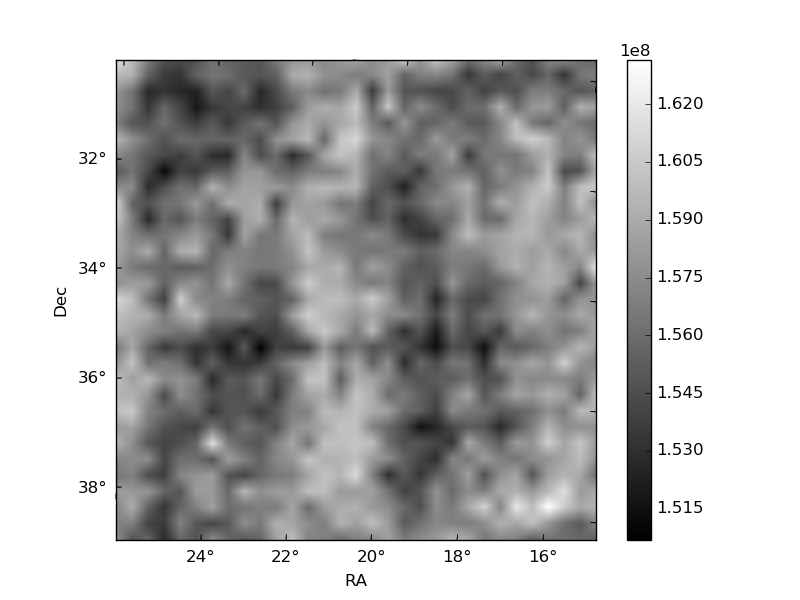
Histogram calculated using DETX and DETY for each event in the final _common_clean file
| Quadrant A | 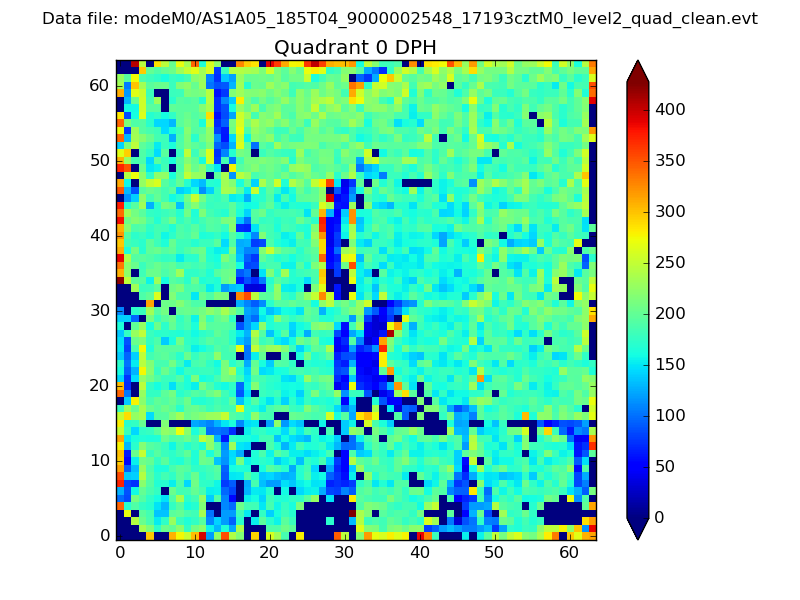 |
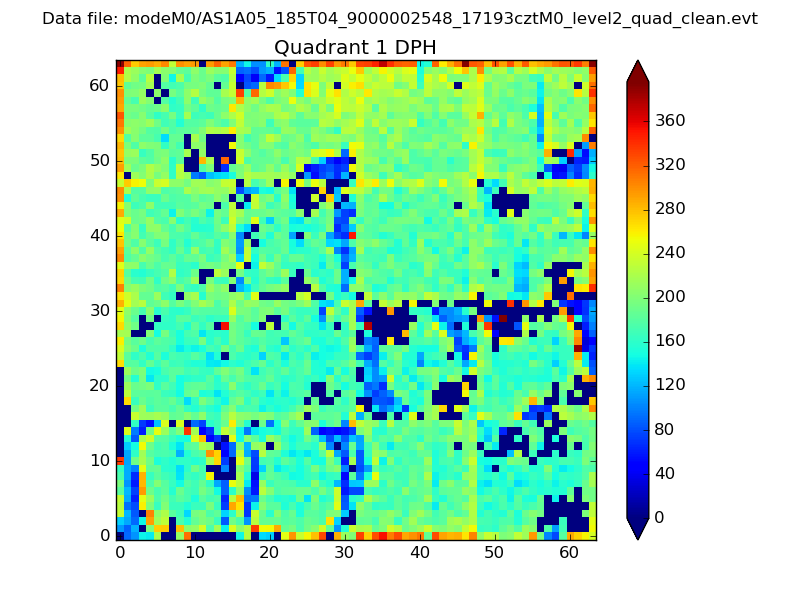 |
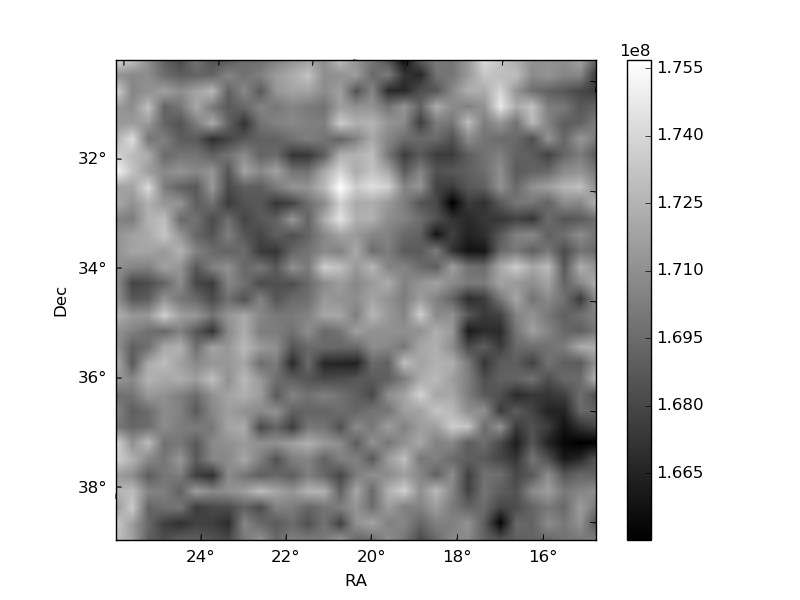
Quadrant B |
|---|---|---|---|
| Quadrant D | 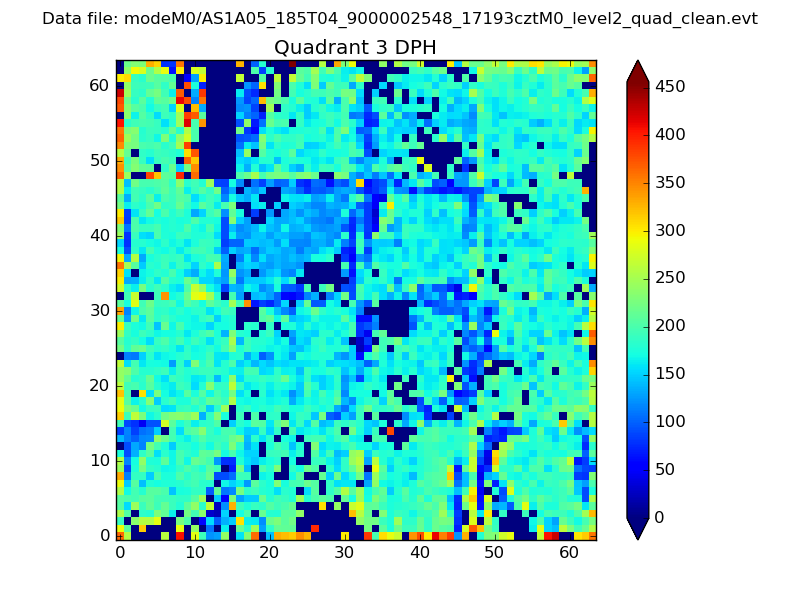 |
 |
Quadrant C |
| Plot type | Count rate plots | Images |
|---|---|---|
| Comparison with Poisson distribution Blue bars denote a histogram of data divided into 1 sec bins. Red curve is a Poisson curve with rate = median count rate of data. |
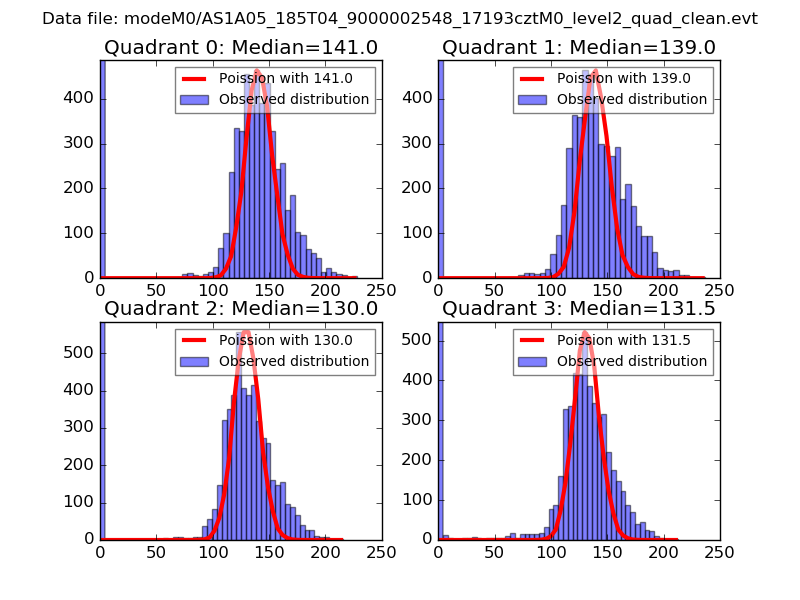 |
 |
| Quadrant-wise count rates Data is divided into 100 sec bins |
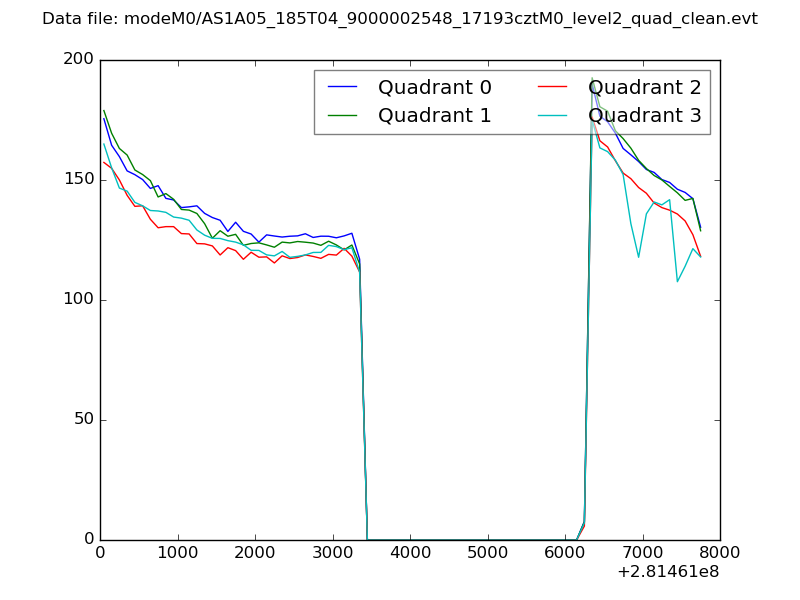 |
|
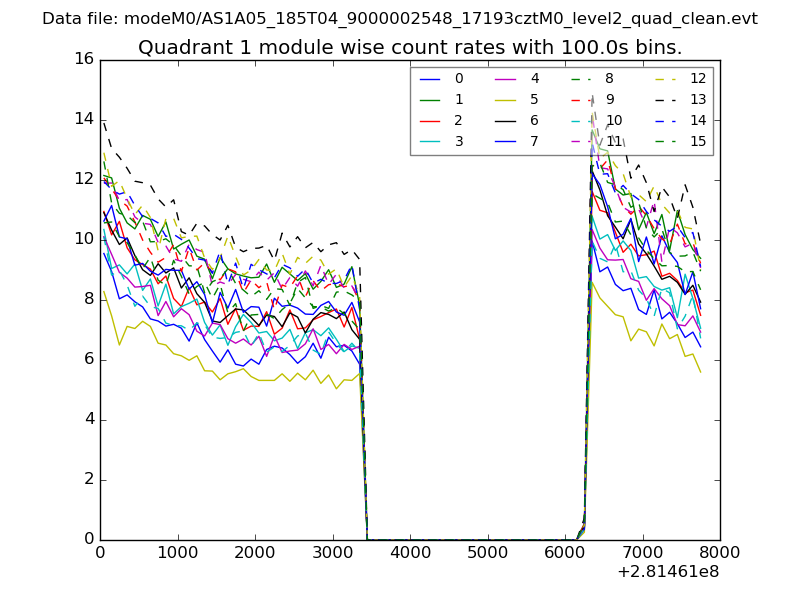
| Module-wise count rates for Quadrant A Data is divided into 100 sec bins |
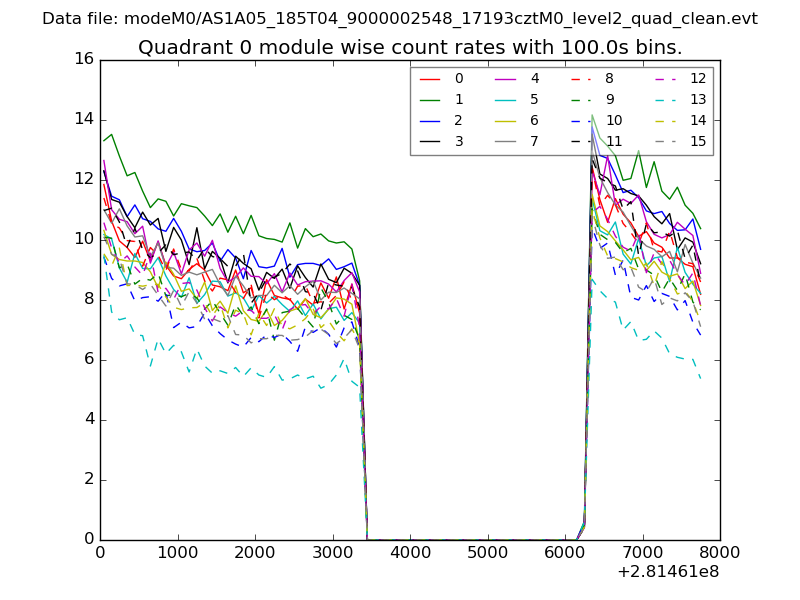 |
 |
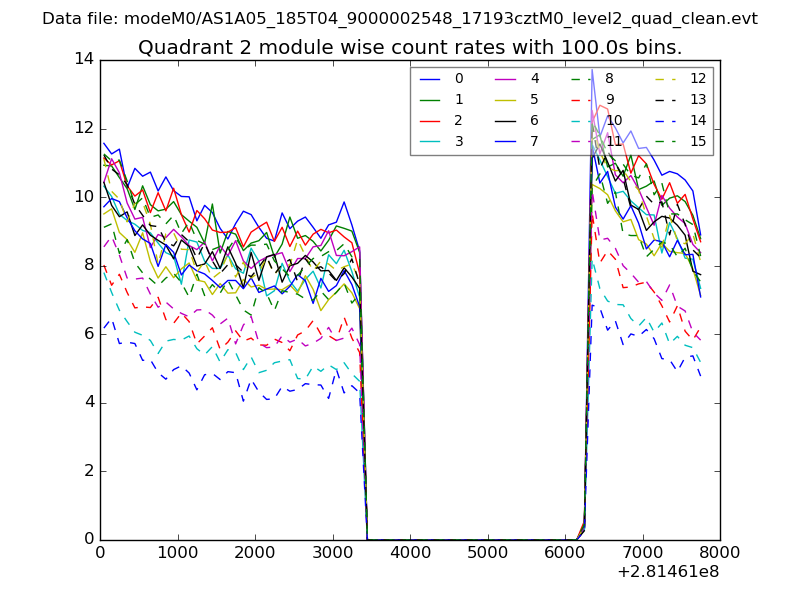
| Module-wise count rates for Quadrant B Data is divided into 100 sec bins |
 |
 |
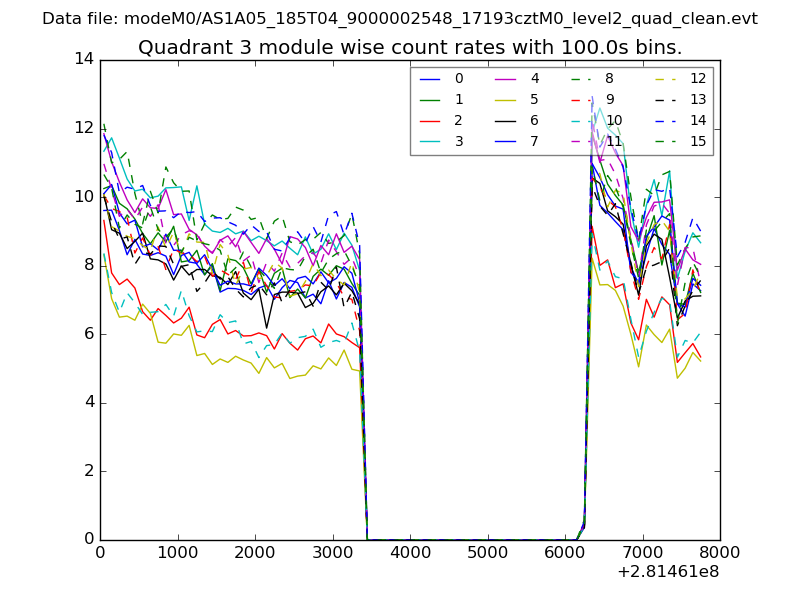
| Module-wise count rates for Quadrant C Data is divided into 100 sec bins |
 |
 |
| Module-wise count rates for Quadrant D Data is divided into 100 sec bins |
 |
 |
| Parameter | Plot |
|---|---|
| CZT HV Monitor | 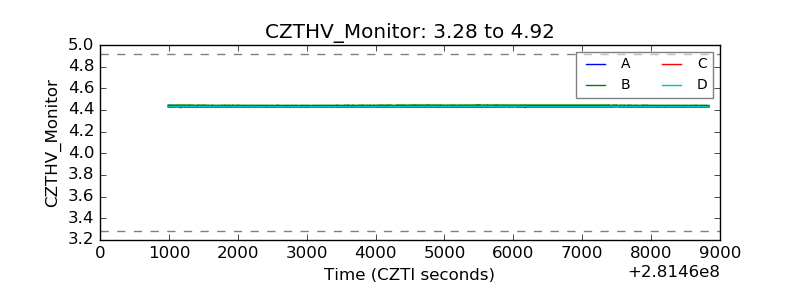 |
| D_VDD | 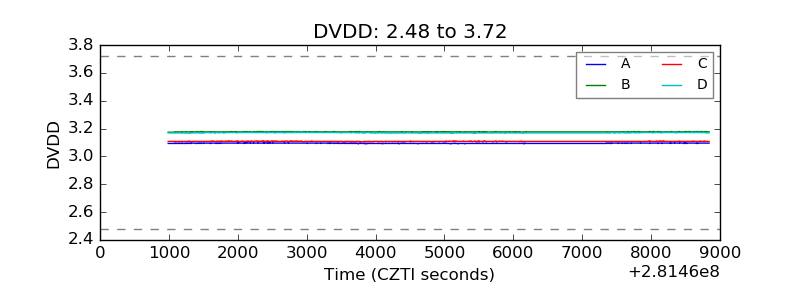 |
| Temperature 1 |  |
| Veto HV Monitor | 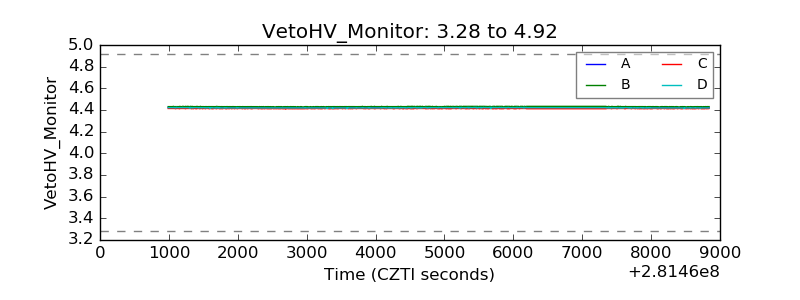 |
| Veto LLD | 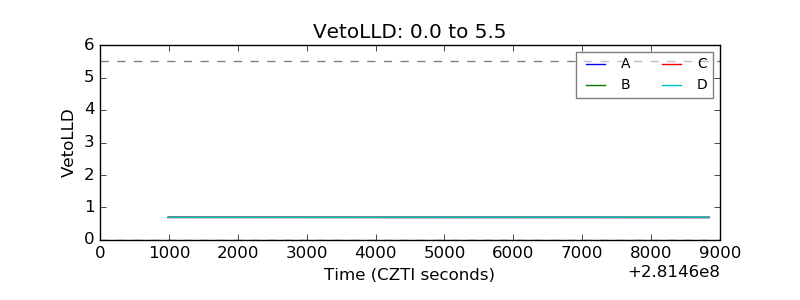 |
| Alpha Counter | 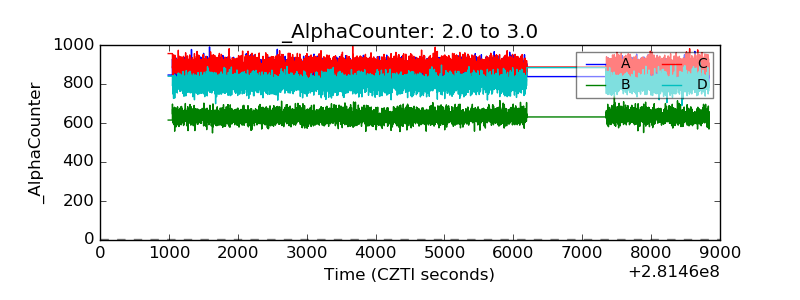 |
| _CPM_Rate | 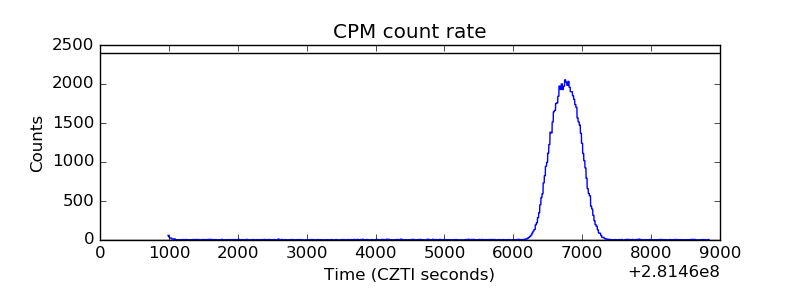 |
| CZT Counter | 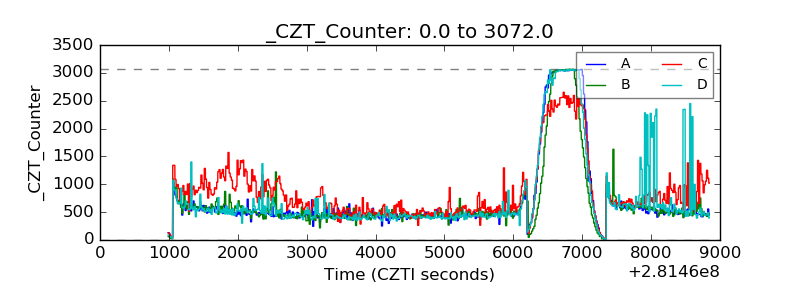 |
| +2.5 Volts monitor |  |
| +5 Volts monitor | 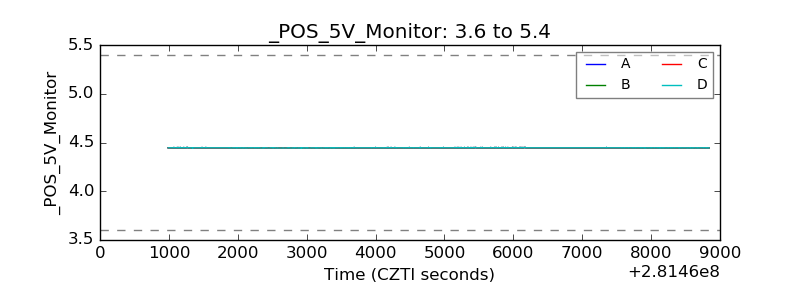 |
| _ROLL_ROT | 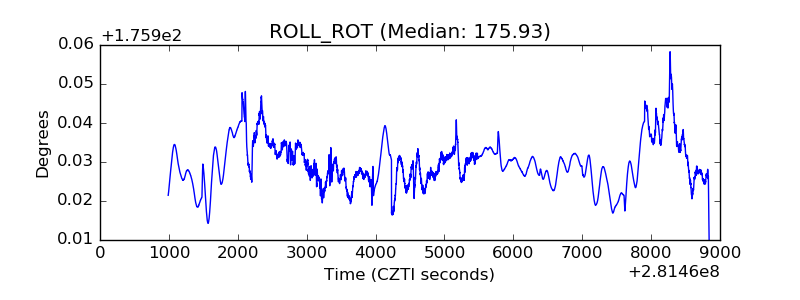 |
| _Roll_DEC | 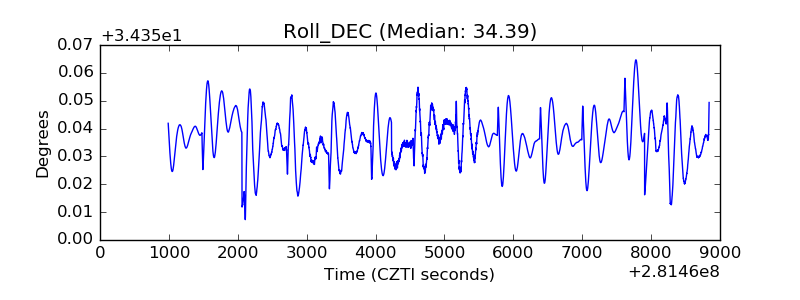 |
| _Roll_RA | 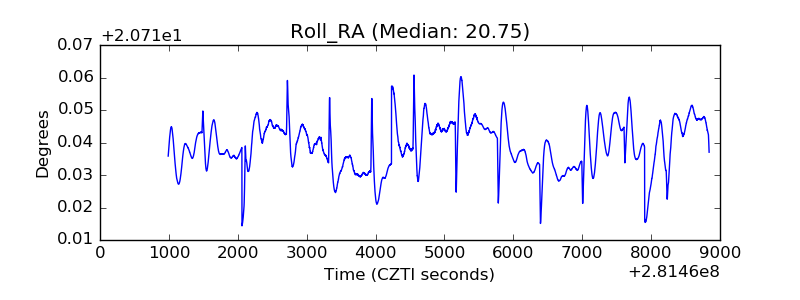 |
| Veto Counter |  |