| Param | Original file | Final file |
|---|---|---|
| Filename | modeM0/AS1A05_185T04_9000002548_17194cztM0_level2.evt | modeM0/AS1A05_185T04_9000002548_17194cztM0_level2_quad_clean.evt |
| Size (bytes) | 491,538,240 | 95,653,440 |
| Size | 468.8 MB | 91.2 MB |
| Events in quadrant A | 3,138,699 | 639,330 |
| Events in quadrant B | 3,224,036 | 639,445 |
| Events in quadrant C | 4,514,220 | 593,429 |
| Events in quadrant D | 3,581,699 | 584,818 |
| Mode SS | |||
|---|---|---|---|
| Quadrant | BADHDUFLAG | Total packets | Discarded packets |
| A | 0 | 128 | 0 |
| B | 0 | 128 | 0 |
| C | 0 | 128 | 0 |
| D | 0 | 128 | 0 |
| Mode M9 | |||
|---|---|---|---|
| Quadrant | BADHDUFLAG | Total packets | Discarded packets |
| A | 0 | 13 | 0 |
| B | 0 | 13 | 0 |
| C | 0 | 13 | 0 |
| D | 0 | 13 | 0 |
| Mode M0 | |||
|---|---|---|---|
| Quadrant | BADHDUFLAG | Total packets | Discarded packets |
| A | 0 | 13392 | 1 |
| B | 0 | 13538 | 1 |
| C | 0 | 17865 | 1 |
| D | 0 | 14957 | 1 |
| Quadrant | Total seconds | Saturated seconds | Saturation percentage |
|---|---|---|---|
| A | 6301 | 49 | 0.777654% |
| B | 6301 | 44 | 0.698302% |
| C | 6301 | 107 | 1.698143% |
| D | 6301 | 229 | 3.634344% |
Noise dominated data is calculated using 1-second bins in cleaned event files. If a bin has >2000 counts, and if more than 50% of those come from <1% of pixels, then it is considered to be noise-dominated and hence unusable.
| Quadrant | # 1 sec bins | Bins with >0 counts | Bins with >2000 counts | High rate bins dominated by noise | Noise dominated (total time) | Noise dominated (detector-on time) | Marked lightcurve |
|---|---|---|---|---|---|---|---|
| A | 7591 | 6302 | 0 | 0 | 0.00% | 0.00% | 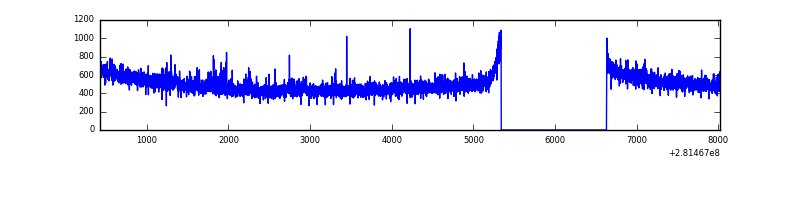 |
| B | 7591 | 6302 | 0 | 0 | 0.00% | 0.00% | 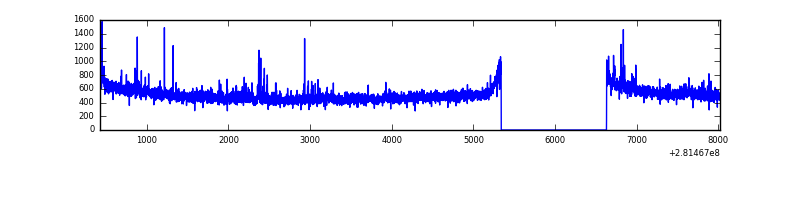 |
| C | 7591 | 6302 | 2 | 2 | 0.03% | 0.03% | 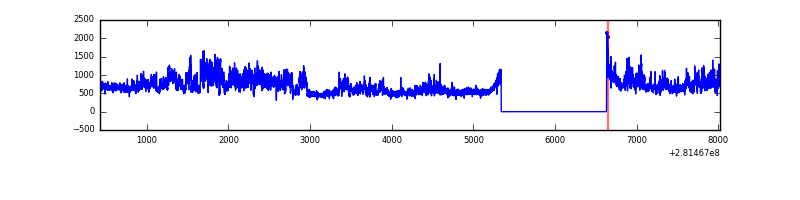 |
| D | 7591 | 6302 | 148 | 148 | 1.95% | 2.35% | 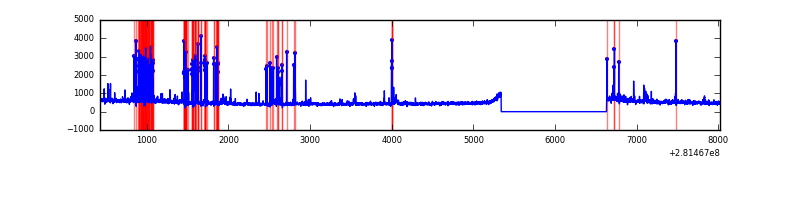 |
Top three noisy pixels from each quadrant. If the there are fewer than three noisy pixels in the level2.evt file, extra rows are filled as -1
| Pixel properties | Quadrant properties | ||||||
|---|---|---|---|---|---|---|---|
| Quadrant | DetID | PixID | Counts | Sigma | Mean | Median | Sigma |
| A | 12 | 189 | 48394 | 295.76 | 804 | 790 | 161.0 |
| A | 0 | 226 | 7117 | 39.31 | 804 | 790 | 161.0 |
| A | 12 | 194 | 5904 | 31.77 | 804 | 790 | 161.0 |
| B | 0 | 197 | 28252 | 182.85 | 800 | 780 | 150.2 |
| B | 0 | 229 | 27080 | 175.05 | 800 | 780 | 150.2 |
| B | 0 | 219 | 19174 | 122.43 | 800 | 780 | 150.2 |
| C | 3 | 233 | 1408325 | 7952.58 | 765 | 772 | 177.0 |
| C | 14 | 238 | 117364 | 658.74 | 765 | 772 | 177.0 |
| C | 13 | 61 | 5539 | 26.93 | 765 | 772 | 177.0 |
| D | 5 | 222 | 549264 | 2961.85 | 772 | 753 | 185.2 |
| D | 10 | 70 | 43384 | 230.2 | 772 | 753 | 185.2 |
| D | 2 | 234 | 27480 | 144.32 | 772 | 753 | 185.2 |
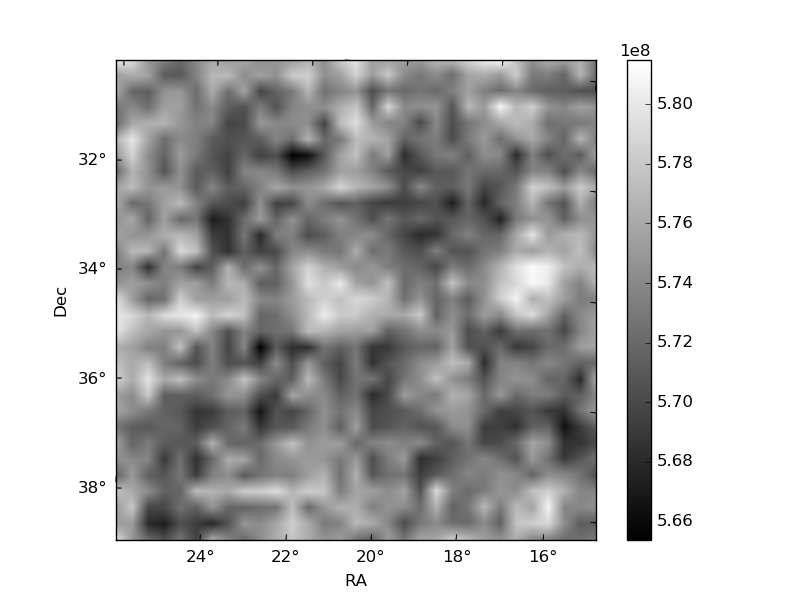
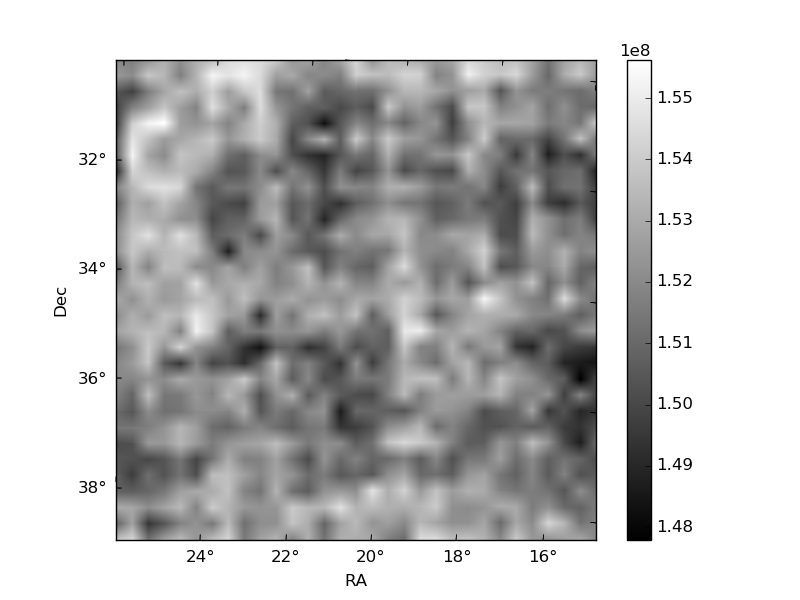
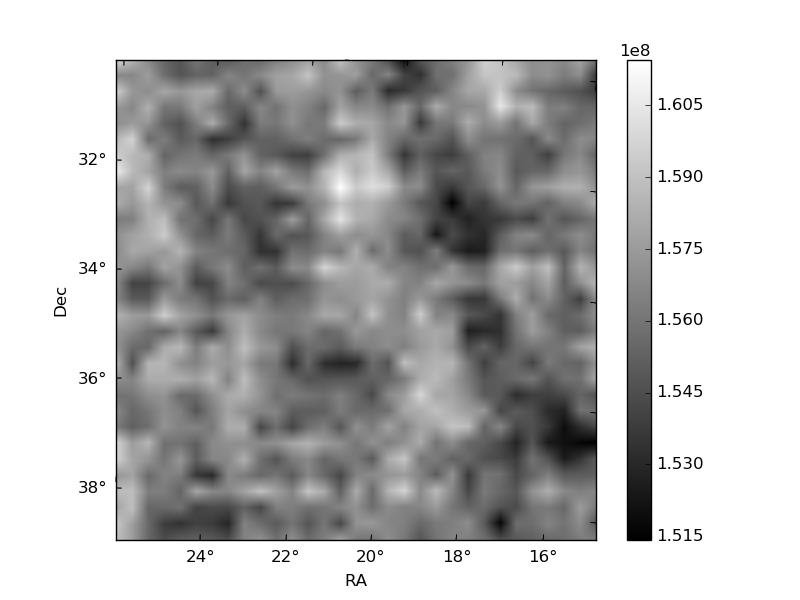
Histogram calculated using DETX and DETY for each event in the final _common_clean file
| Quadrant A | 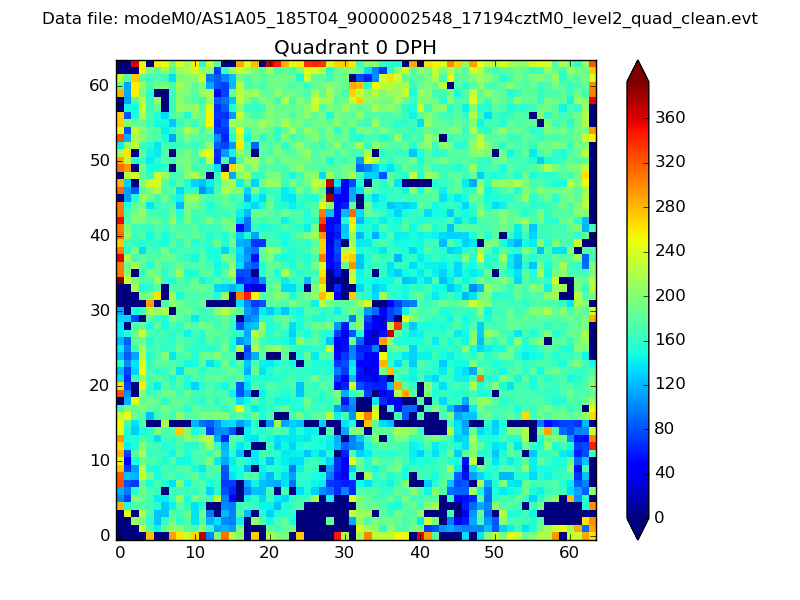 |
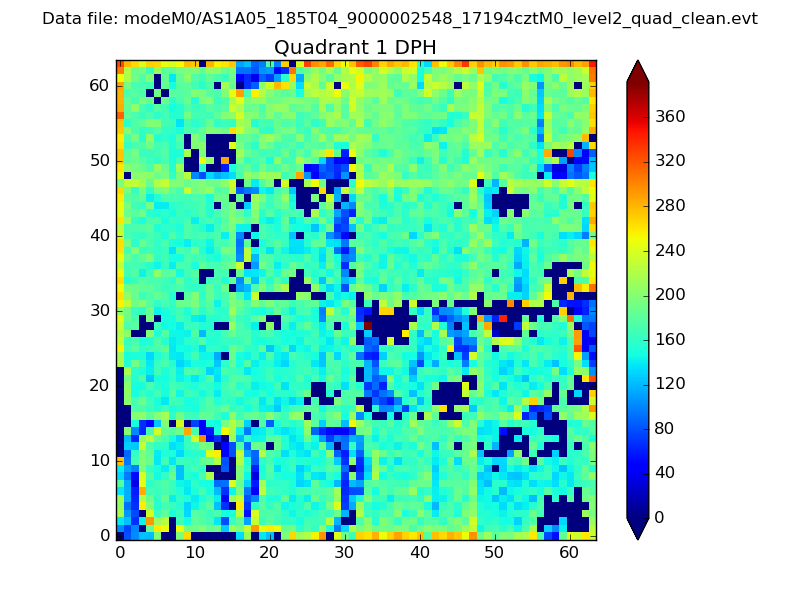 |
Quadrant B |
|---|---|---|---|
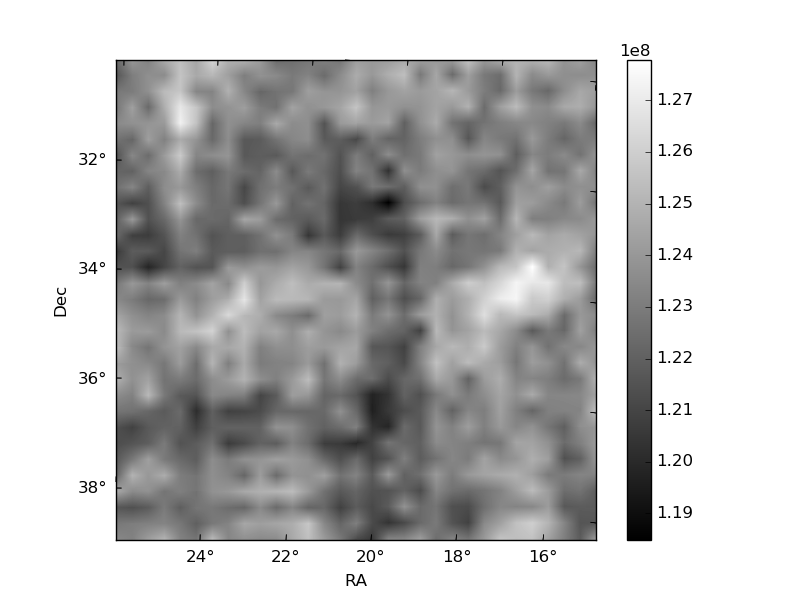
| Quadrant D |  |
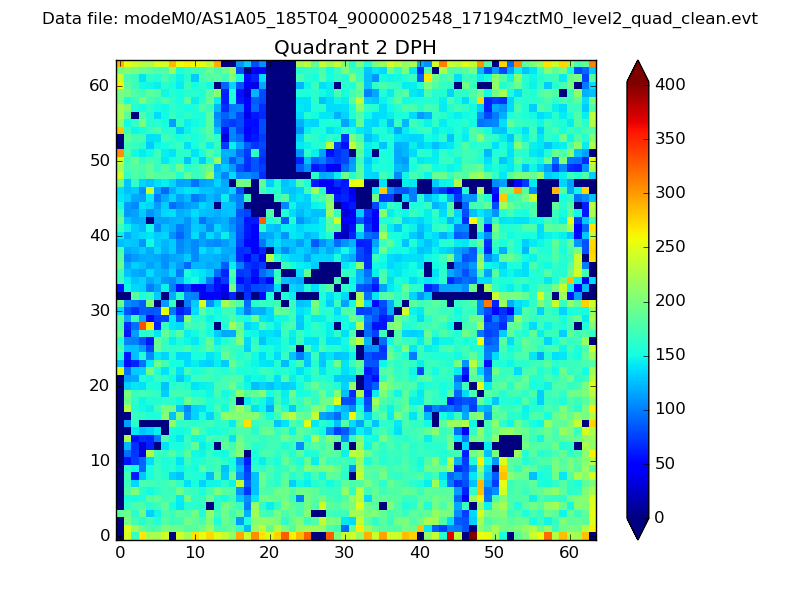 |
Quadrant C |
| Plot type | Count rate plots | Images |
|---|---|---|
| Comparison with Poisson distribution Blue bars denote a histogram of data divided into 1 sec bins. Red curve is a Poisson curve with rate = median count rate of data. |
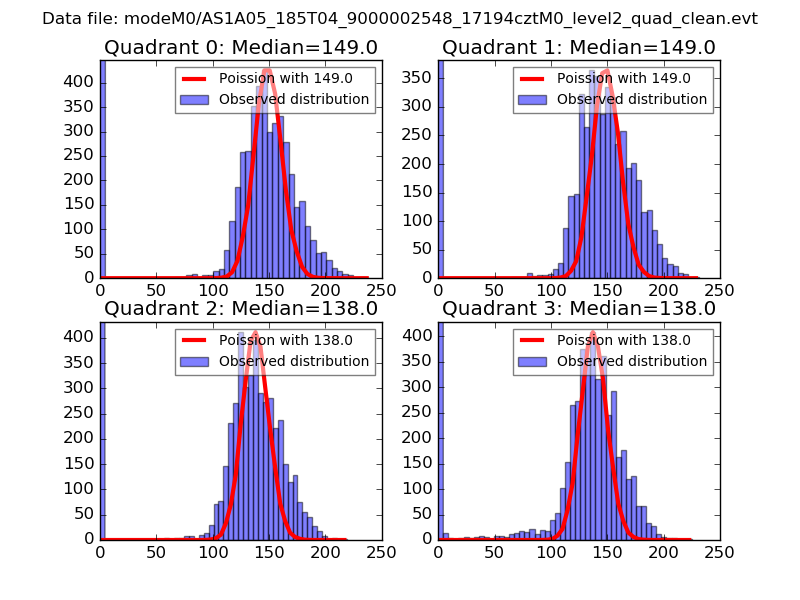 |
 |
| Quadrant-wise count rates Data is divided into 100 sec bins |
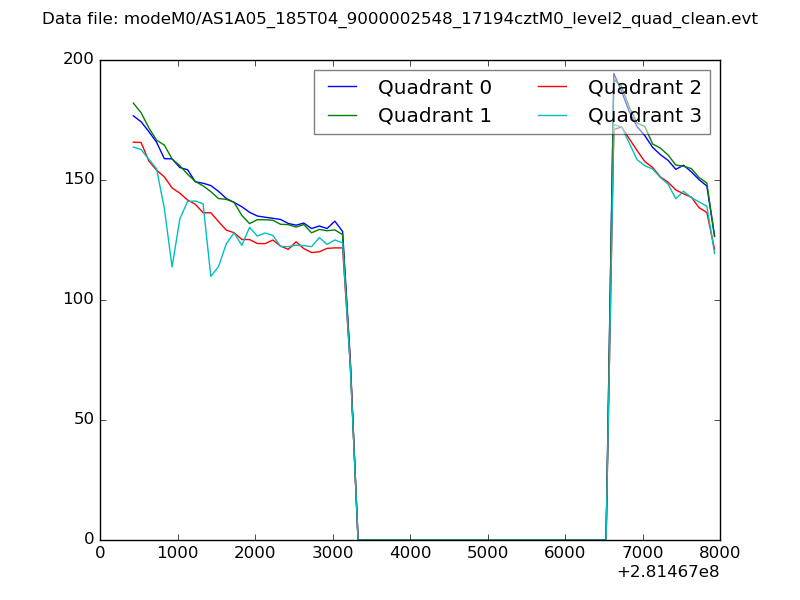 |
|
| Module-wise count rates for Quadrant A Data is divided into 100 sec bins |
 |
 |
| Module-wise count rates for Quadrant B Data is divided into 100 sec bins |
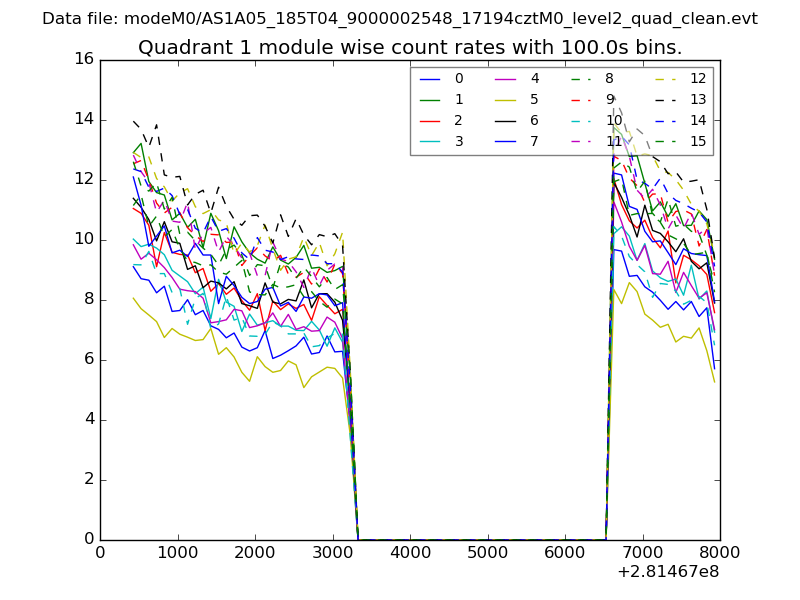 |
 |
| Module-wise count rates for Quadrant C Data is divided into 100 sec bins |
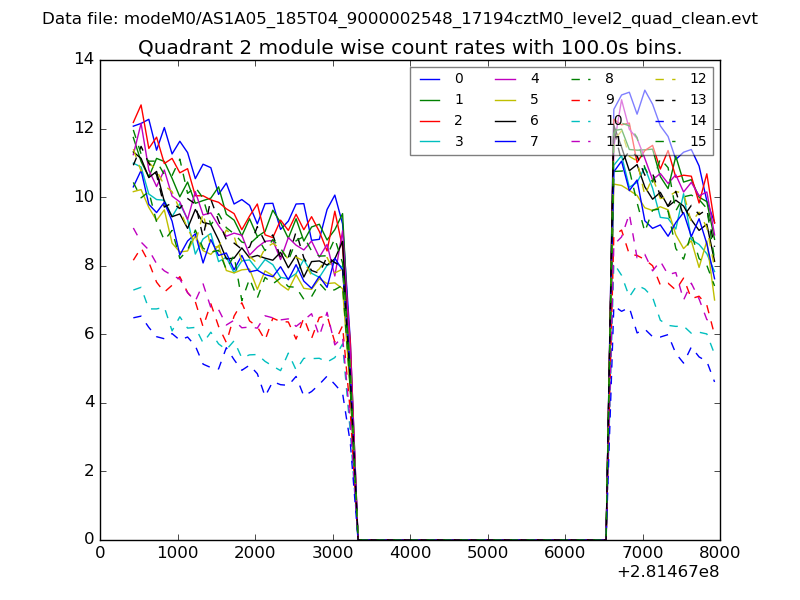 |
 |
| Module-wise count rates for Quadrant D Data is divided into 100 sec bins |
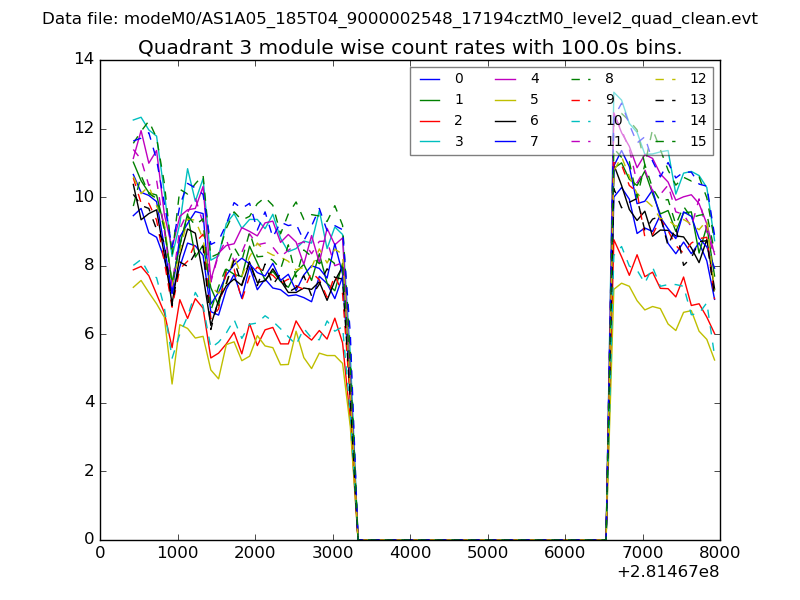 |
 |
| Parameter | Plot |
|---|---|
| CZT HV Monitor | 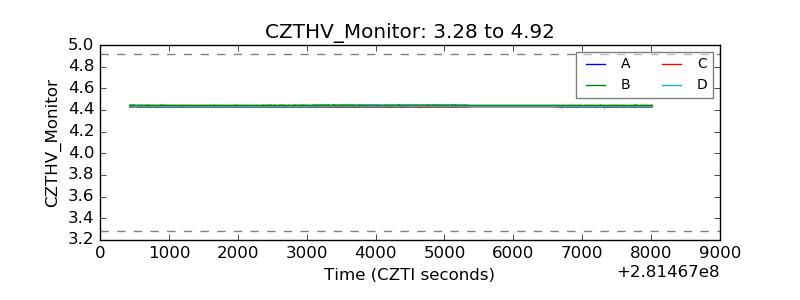 |
| D_VDD | 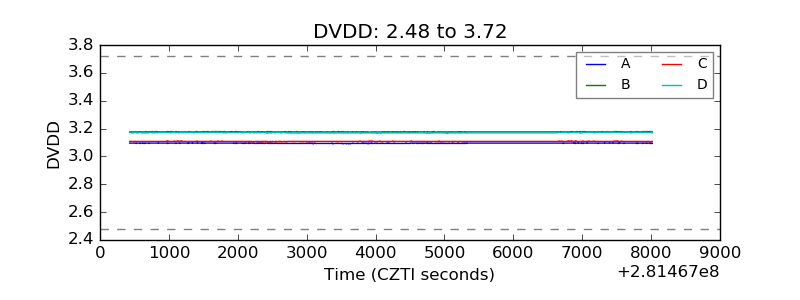 |
| Temperature 1 | 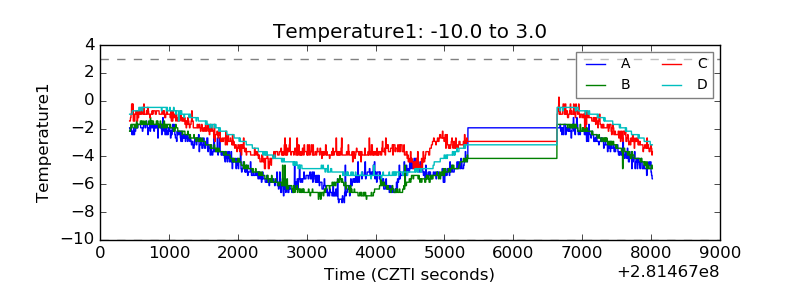 |
| Veto HV Monitor | 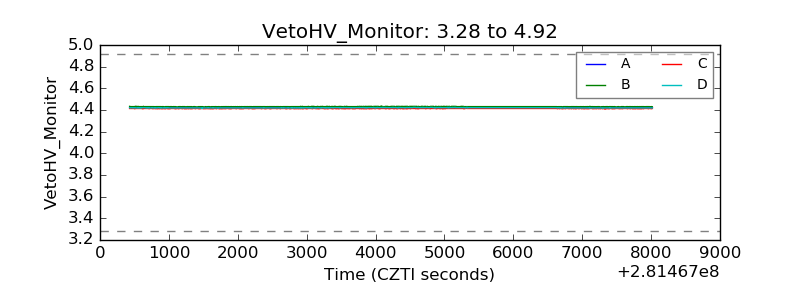 |
| Veto LLD | 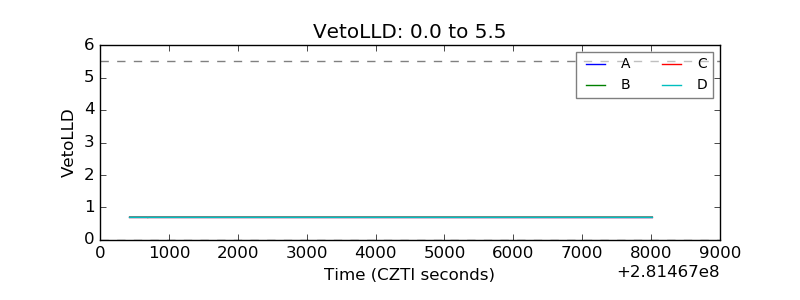 |
| Alpha Counter | 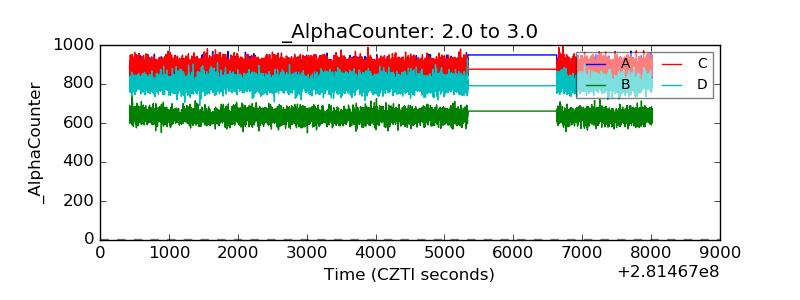 |
| _CPM_Rate | 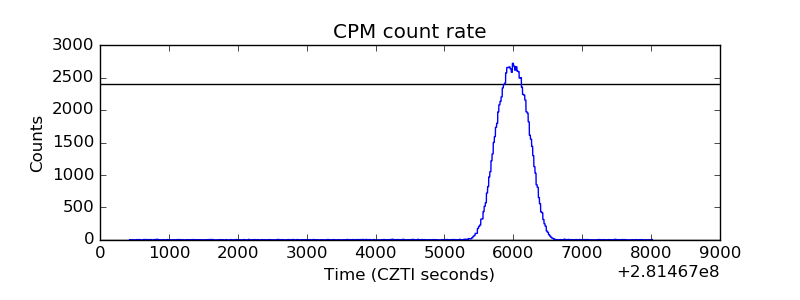 |
| CZT Counter | 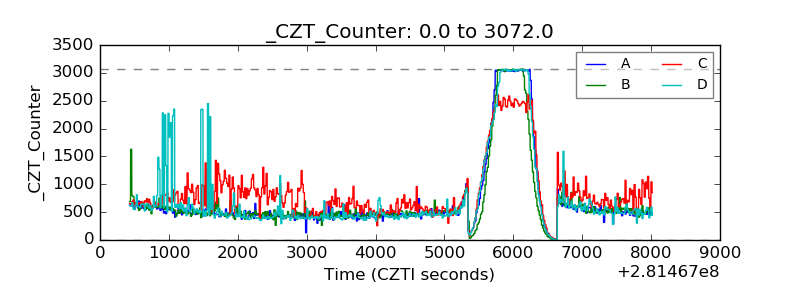 |
| +2.5 Volts monitor | 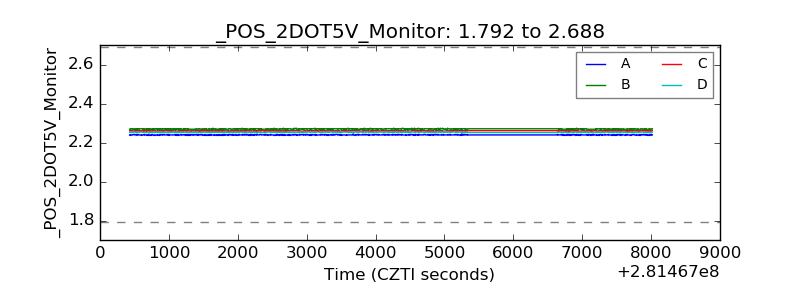 |
| +5 Volts monitor | 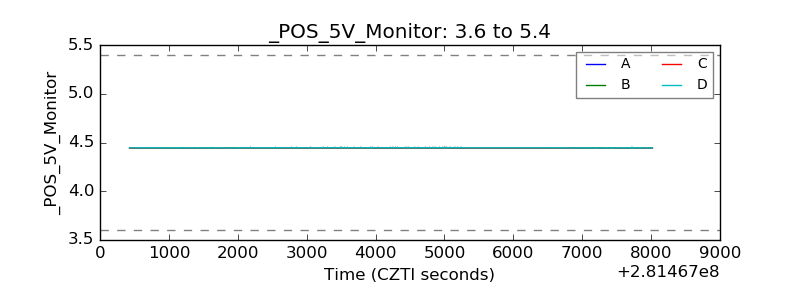 |
| _ROLL_ROT | 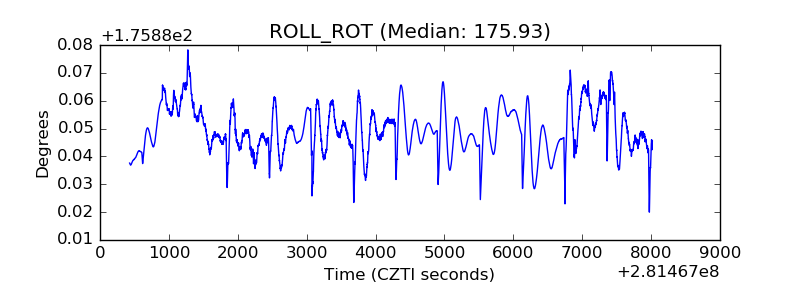 |
| _Roll_DEC | 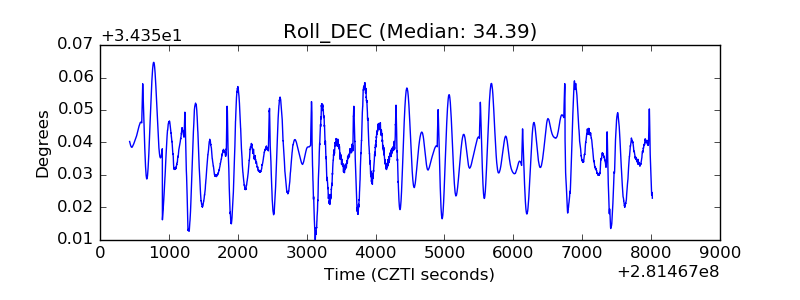 |
| _Roll_RA | 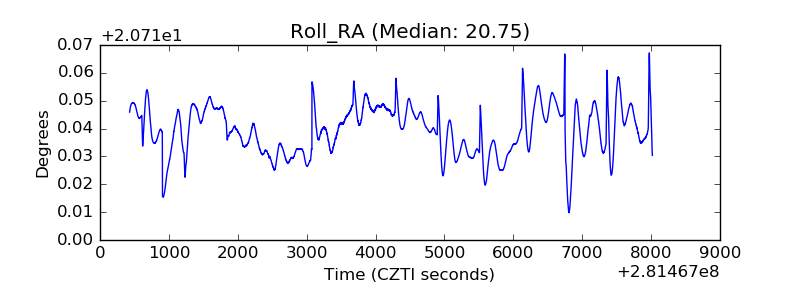 |
| Veto Counter | 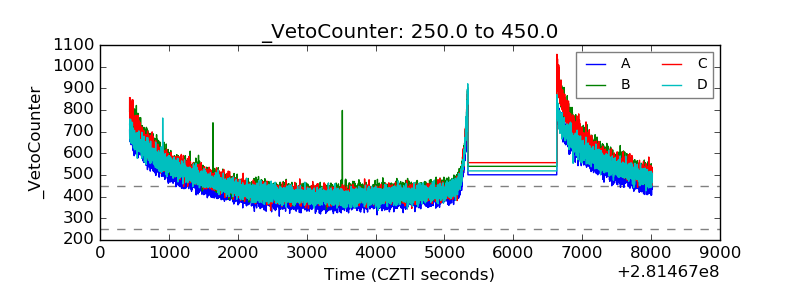 |