| Param | Original file | Final file |
|---|---|---|
| Filename | modeM0/AS1A05_185T04_9000002548_17196cztM0_level2.evt | modeM0/AS1A05_185T04_9000002548_17196cztM0_level2_quad_clean.evt |
| Size (bytes) | 513,809,280 | 89,274,240 |
| Size | 490.0 MB | 85.1 MB |
| Events in quadrant A | 2,987,024 | 594,910 |
| Events in quadrant B | 3,209,472 | 603,404 |
| Events in quadrant C | 4,233,836 | 558,917 |
| Events in quadrant D | 4,716,079 | 519,391 |
| Mode SS | |||
|---|---|---|---|
| Quadrant | BADHDUFLAG | Total packets | Discarded packets |
| A | 0 | 124 | 0 |
| B | 0 | 124 | 0 |
| C | 0 | 124 | 0 |
| D | 0 | 124 | 0 |
| Mode M9 | |||
|---|---|---|---|
| Quadrant | BADHDUFLAG | Total packets | Discarded packets |
| A | 0 | 16 | 0 |
| B | 0 | 17 | 0 |
| C | 0 | 17 | 0 |
| D | 0 | 17 | 0 |
| Mode M0 | |||
|---|---|---|---|
| Quadrant | BADHDUFLAG | Total packets | Discarded packets |
| A | 0 | 12736 | 2 |
| B | 0 | 13370 | 2 |
| C | 0 | 16670 | 2 |
| D | 0 | 18174 | 2 |
| Quadrant | Total seconds | Saturated seconds | Saturation percentage |
|---|---|---|---|
| A | 6110 | 23 | 0.376432% |
| B | 6110 | 35 | 0.572831% |
| C | 6110 | 182 | 2.978723% |
| D | 6109 | 564 | 9.232280% |
Noise dominated data is calculated using 1-second bins in cleaned event files. If a bin has >2000 counts, and if more than 50% of those come from <1% of pixels, then it is considered to be noise-dominated and hence unusable.
| Quadrant | # 1 sec bins | Bins with >0 counts | Bins with >2000 counts | High rate bins dominated by noise | Noise dominated (total time) | Noise dominated (detector-on time) | Marked lightcurve |
|---|---|---|---|---|---|---|---|
| A | 7465 | 6111 | 0 | 0 | 0.00% | 0.00% | 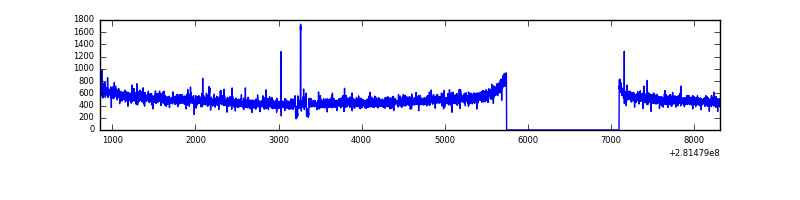 |
| B | 7465 | 6111 | 1 | 1 | 0.01% | 0.02% | 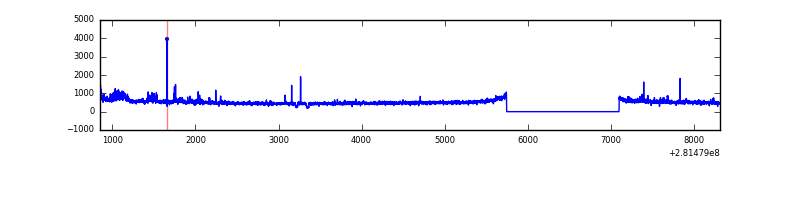 |
| C | 7465 | 6111 | 0 | 0 | 0.00% | 0.00% | 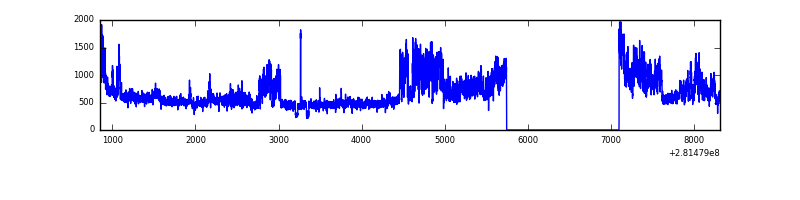 |
| D | 7464 | 6110 | 505 | 505 | 6.77% | 8.27% | 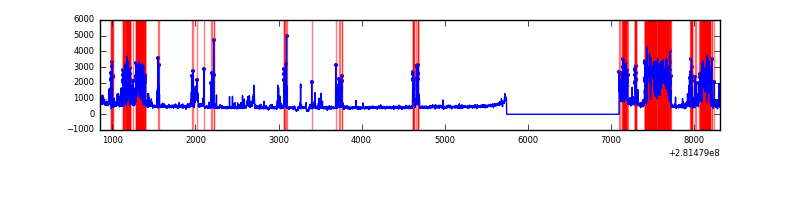 |
Top three noisy pixels from each quadrant. If the there are fewer than three noisy pixels in the level2.evt file, extra rows are filled as -1
| Pixel properties | Quadrant properties | ||||||
|---|---|---|---|---|---|---|---|
| Quadrant | DetID | PixID | Counts | Sigma | Mean | Median | Sigma |
| A | 12 | 189 | 7631 | 44.41 | 774 | 759 | 154.7 |
| A | 4 | 2 | 7065 | 40.75 | 774 | 759 | 154.7 |
| A | 0 | 226 | 6899 | 39.68 | 774 | 759 | 154.7 |
| B | 15 | 35 | 60922 | 412.05 | 777 | 757 | 146.0 |
| B | 0 | 219 | 33987 | 227.58 | 777 | 757 | 146.0 |
| B | 0 | 189 | 23561 | 156.18 | 777 | 757 | 146.0 |
| C | 3 | 233 | 1232499 | 7212.59 | 739 | 745 | 170.8 |
| C | 14 | 238 | 114469 | 665.92 | 739 | 745 | 170.8 |
| C | 13 | 61 | 5196 | 26.06 | 739 | 745 | 170.8 |
| D | 5 | 222 | 670310 | 3883.64 | 719 | 698 | 172.4 |
| D | 11 | 176 | 617992 | 3580.21 | 719 | 698 | 172.4 |
| D | 7 | 38 | 365998 | 2118.68 | 719 | 698 | 172.4 |
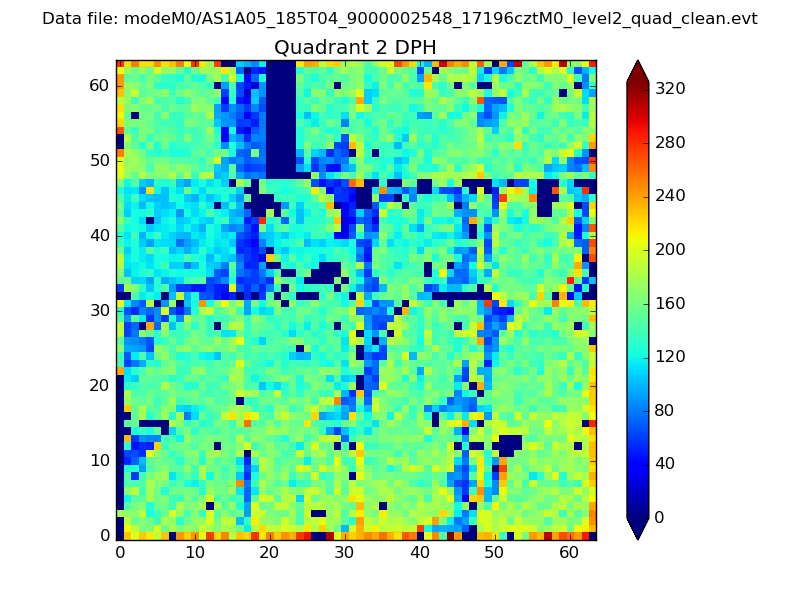
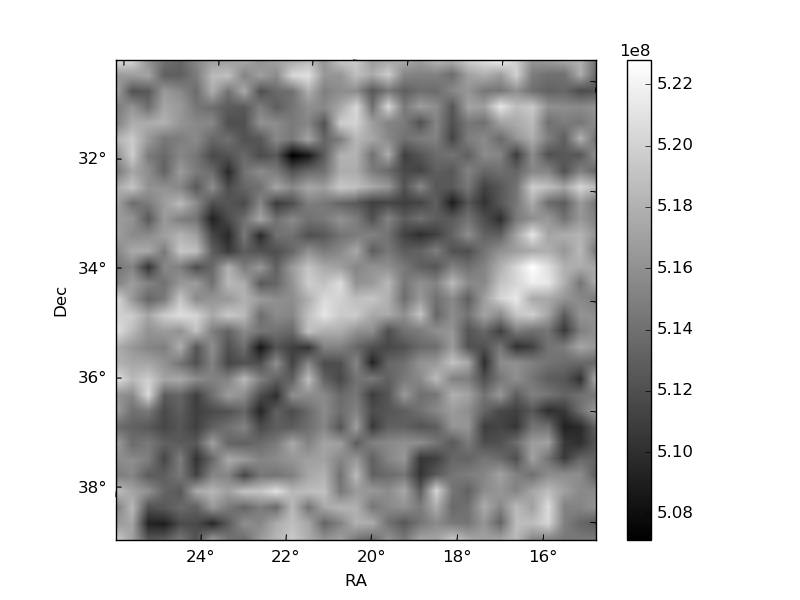
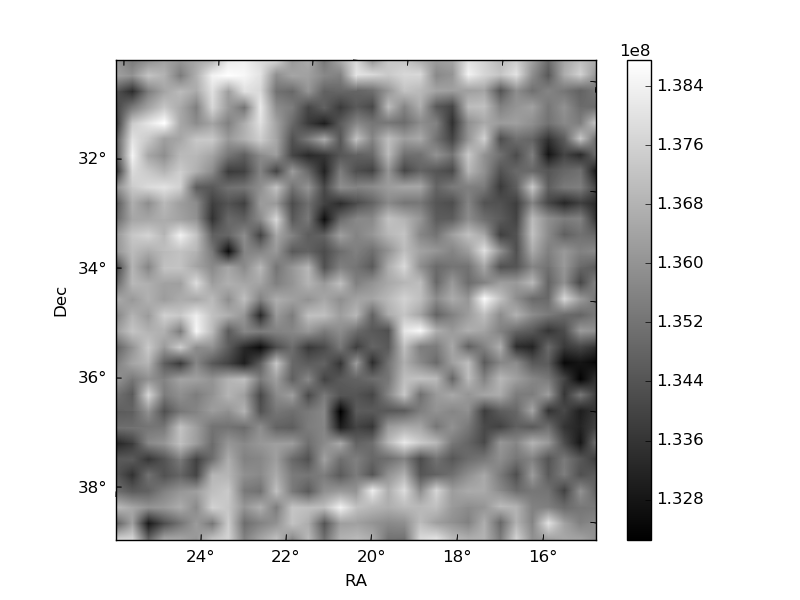
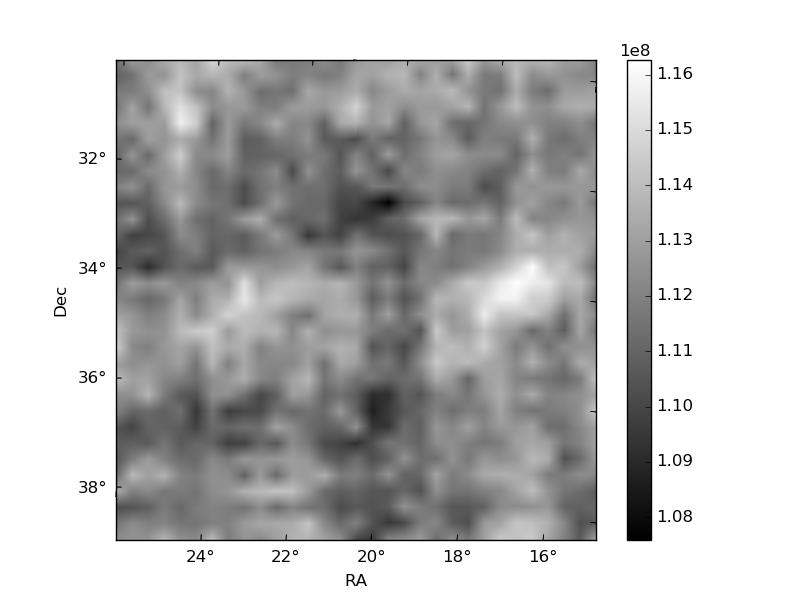
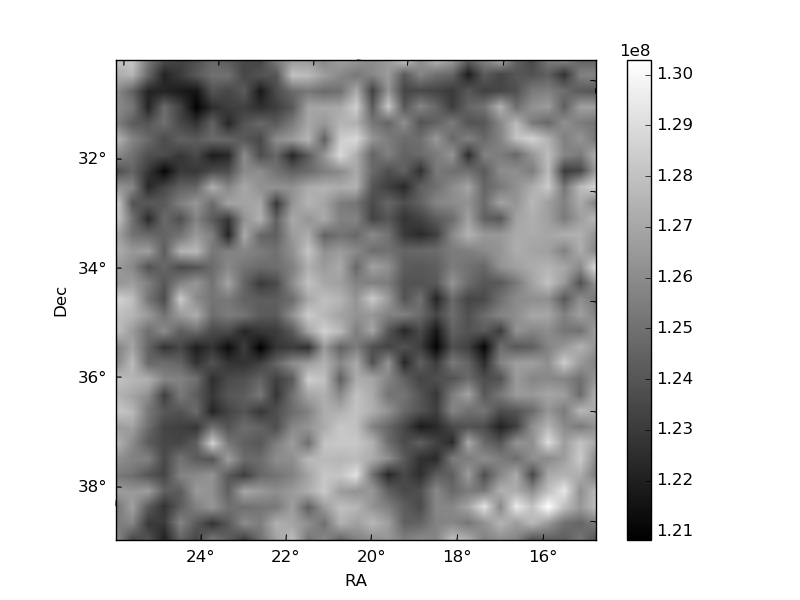
Histogram calculated using DETX and DETY for each event in the final _common_clean file
| Quadrant A | 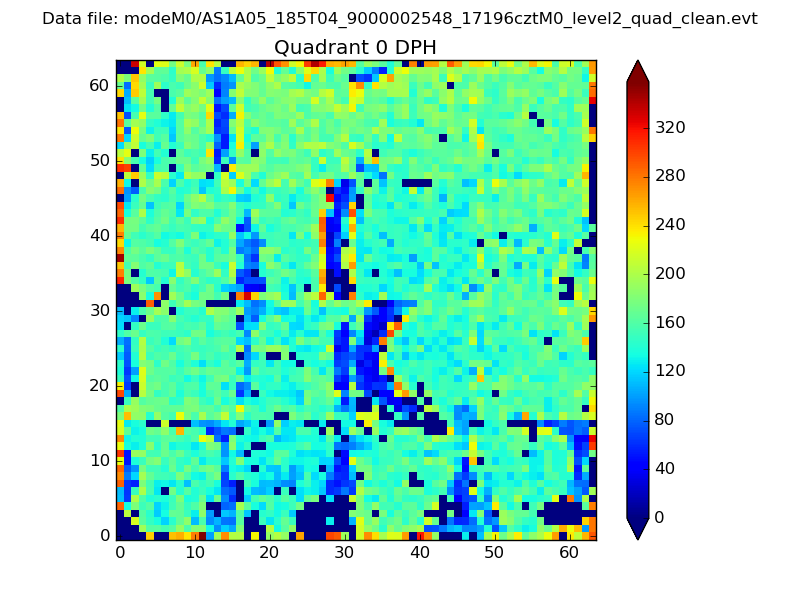 |
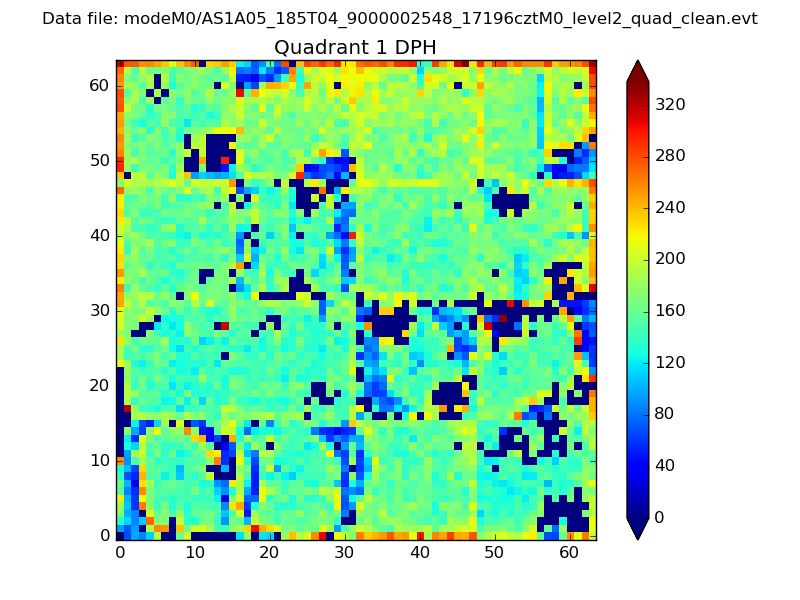 |
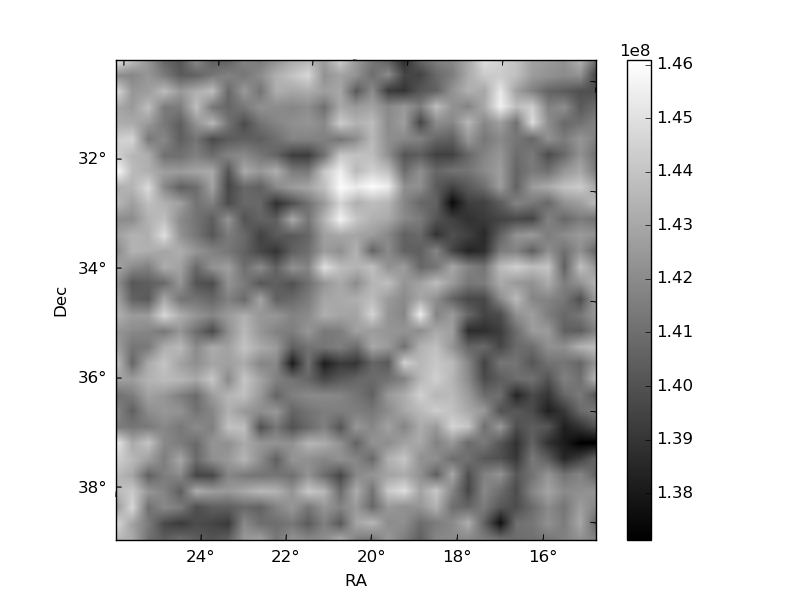
Quadrant B |
|---|---|---|---|
| Quadrant D | 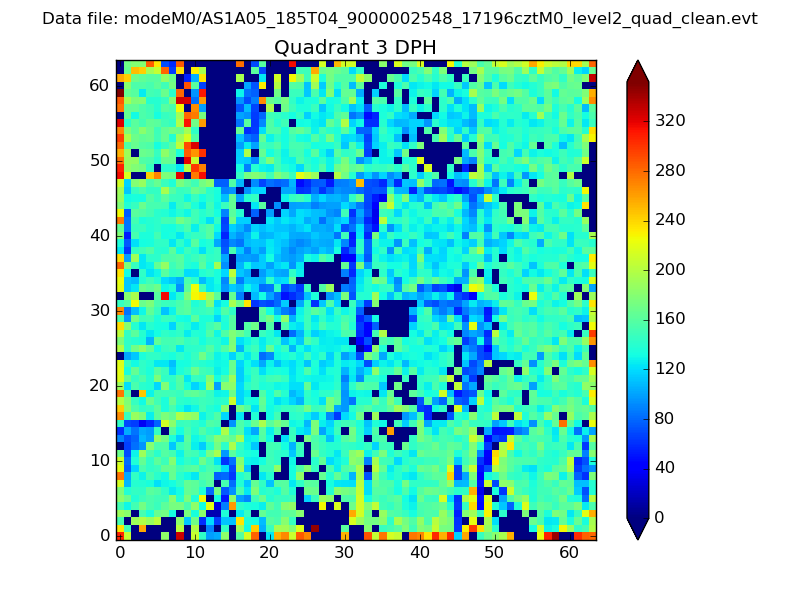 |
 |
Quadrant C |
| Plot type | Count rate plots | Images |
|---|---|---|
| Comparison with Poisson distribution Blue bars denote a histogram of data divided into 1 sec bins. Red curve is a Poisson curve with rate = median count rate of data. |
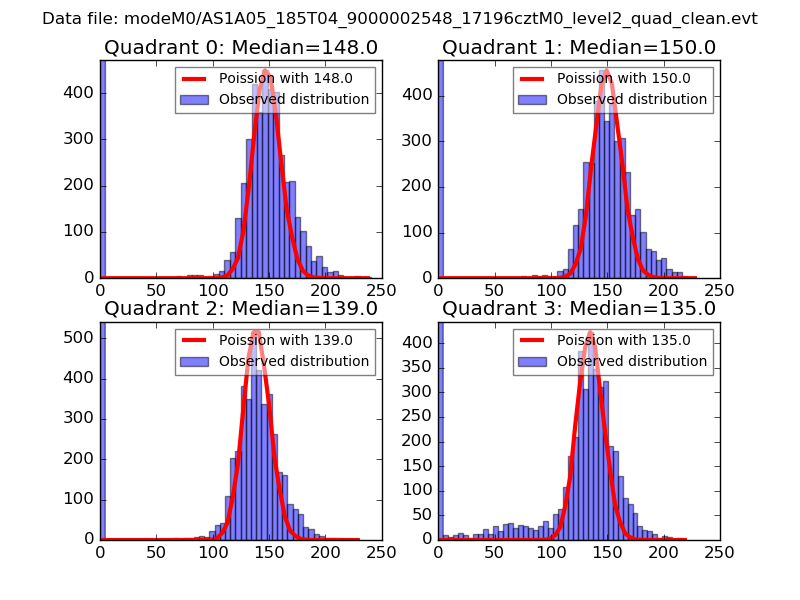 |
 |
| Quadrant-wise count rates Data is divided into 100 sec bins |
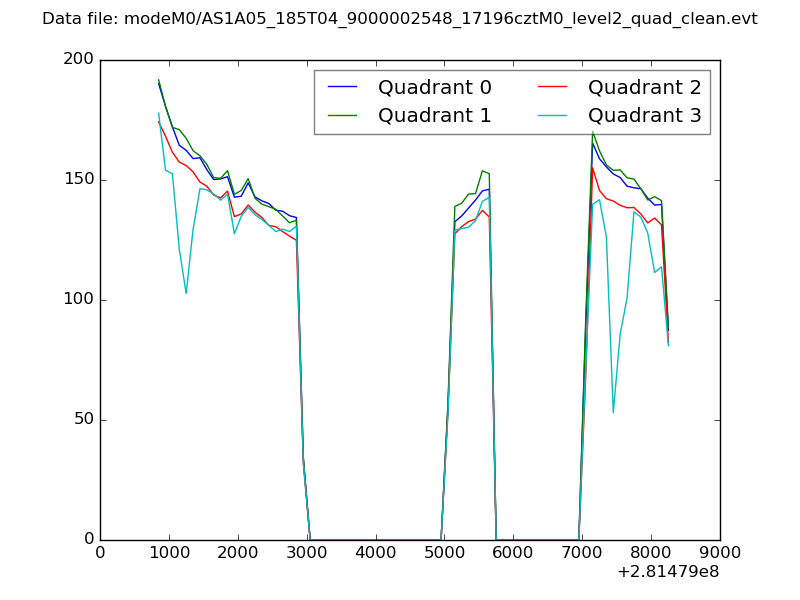 |
|
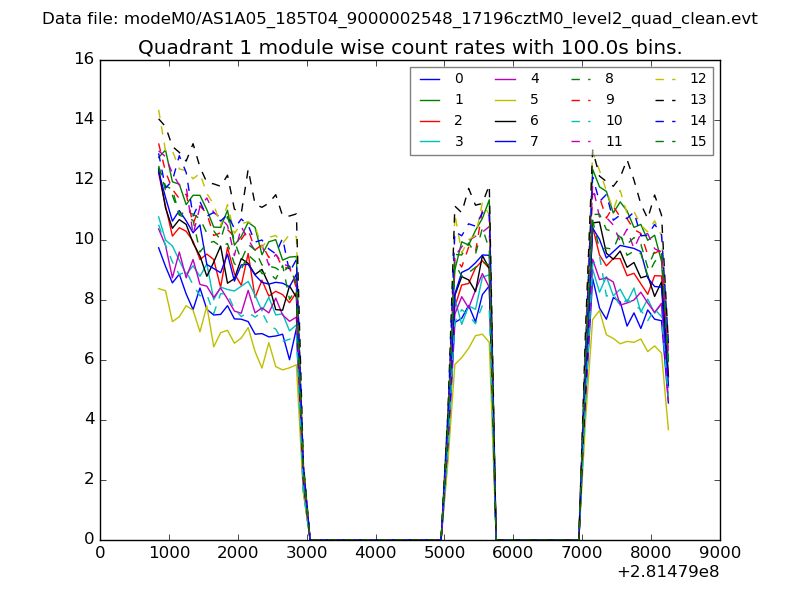
| Module-wise count rates for Quadrant A Data is divided into 100 sec bins |
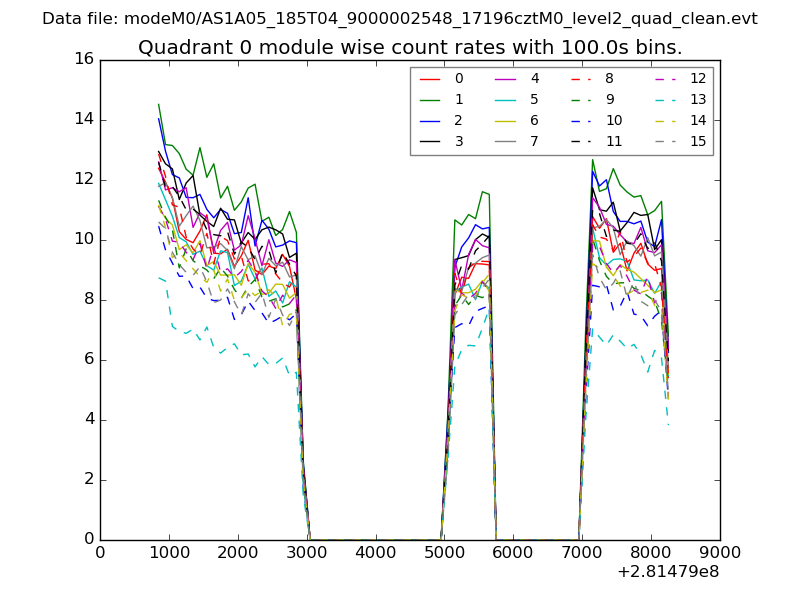 |
 |
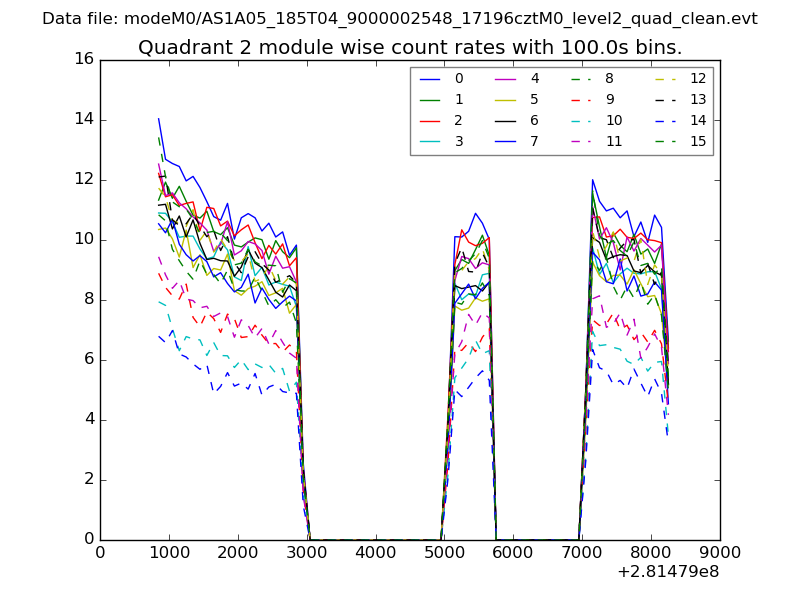
| Module-wise count rates for Quadrant B Data is divided into 100 sec bins |
 |
 |
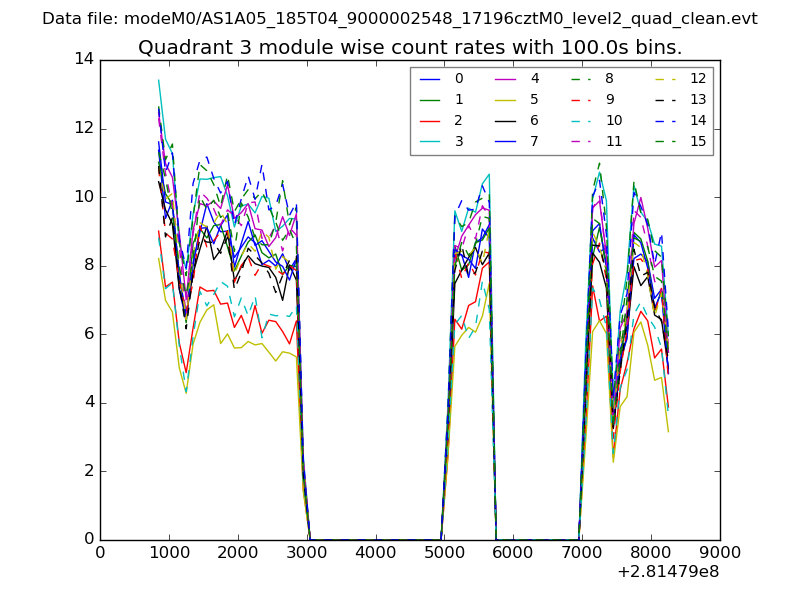
| Module-wise count rates for Quadrant C Data is divided into 100 sec bins |
 |
 |
| Module-wise count rates for Quadrant D Data is divided into 100 sec bins |
 |
 |
| Parameter | Plot |
|---|---|
| CZT HV Monitor | 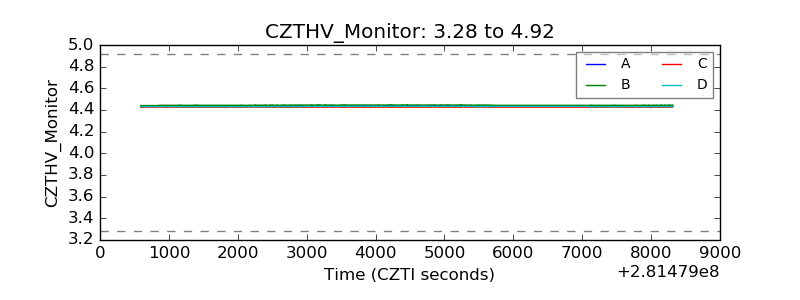 |
| D_VDD | 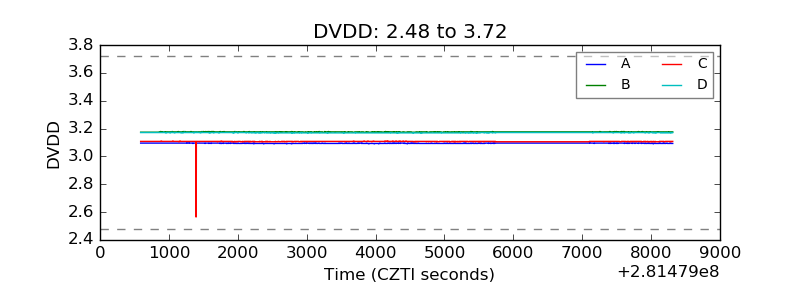 |
| Temperature 1 |  |
| Veto HV Monitor | 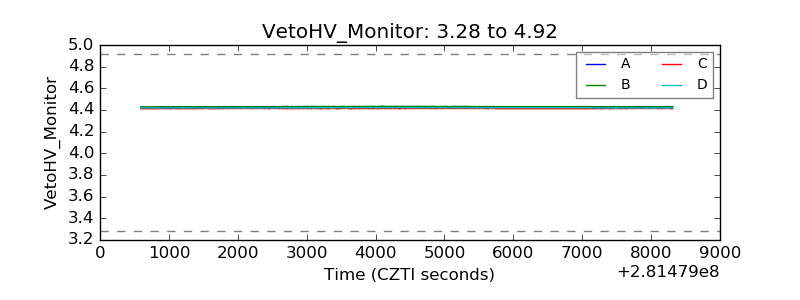 |
| Veto LLD | 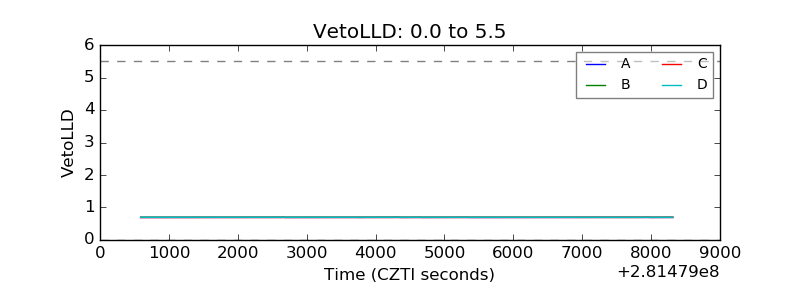 |
| Alpha Counter | 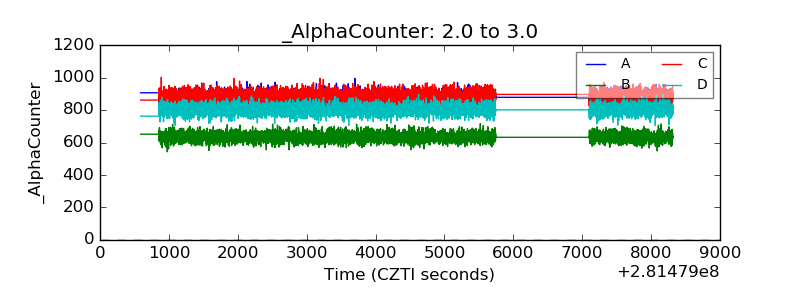 |
| _CPM_Rate | 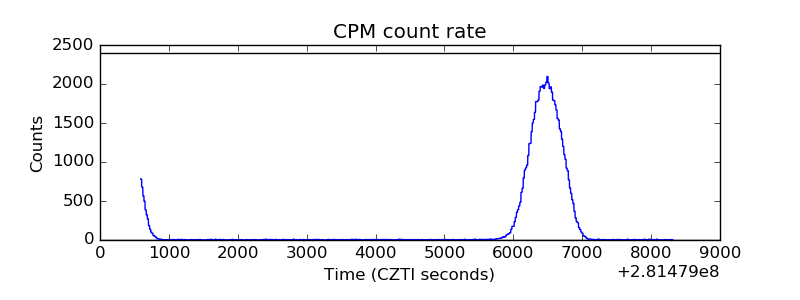 |
| CZT Counter | 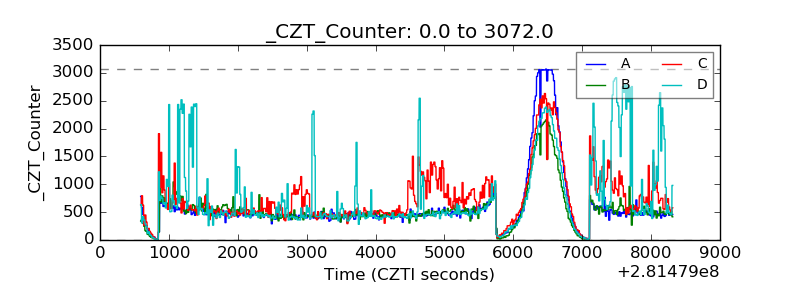 |
| +2.5 Volts monitor |  |
| +5 Volts monitor |  |
| _ROLL_ROT | 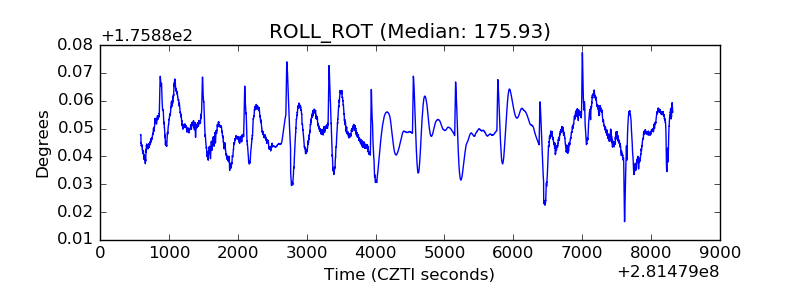 |
| _Roll_DEC | 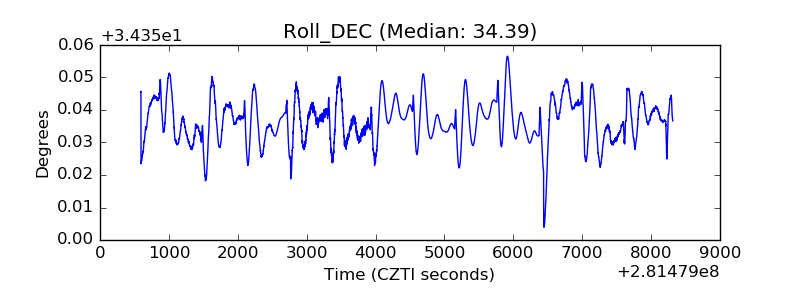 |
| _Roll_RA | 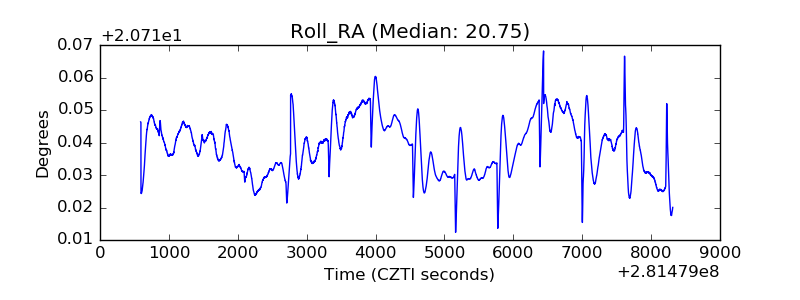 |
| Veto Counter | 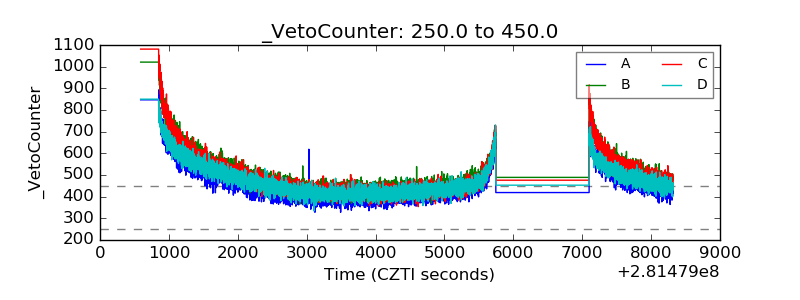 |