| Param | Original file | Final file |
|---|---|---|
| Filename | modeM0/AS1A05_185T04_9000002548_17197cztM0_level2.evt | modeM0/AS1A05_185T04_9000002548_17197cztM0_level2_quad_clean.evt |
| Size (bytes) | 491,984,640 | 88,162,560 |
| Size | 469.2 MB | 84.1 MB |
| Events in quadrant A | 2,983,454 | 579,336 |
| Events in quadrant B | 3,149,364 | 589,064 |
| Events in quadrant C | 4,087,985 | 548,324 |
| Events in quadrant D | 4,254,543 | 516,415 |
| Mode SS | |||
|---|---|---|---|
| Quadrant | BADHDUFLAG | Total packets | Discarded packets |
| A | 0 | 126 | 0 |
| B | 0 | 126 | 0 |
| C | 0 | 126 | 0 |
| D | 0 | 126 | 0 |
| Mode M9 | |||
|---|---|---|---|
| Quadrant | BADHDUFLAG | Total packets | Discarded packets |
| A | 0 | 24 | 0 |
| B | 0 | 25 | 0 |
| C | 0 | 25 | 0 |
| D | 0 | 25 | 0 |
| Mode M0 | |||
|---|---|---|---|
| Quadrant | BADHDUFLAG | Total packets | Discarded packets |
| A | 0 | 12974 | 2 |
| B | 0 | 13324 | 2 |
| C | 0 | 16199 | 2 |
| D | 0 | 16996 | 2 |
| Quadrant | Total seconds | Saturated seconds | Saturation percentage |
|---|---|---|---|
| A | 6258 | 24 | 0.383509% |
| B | 6258 | 47 | 0.751039% |
| C | 6258 | 156 | 2.492809% |
| D | 6258 | 402 | 6.423778% |
Noise dominated data is calculated using 1-second bins in cleaned event files. If a bin has >2000 counts, and if more than 50% of those come from <1% of pixels, then it is considered to be noise-dominated and hence unusable.
| Quadrant | # 1 sec bins | Bins with >0 counts | Bins with >2000 counts | High rate bins dominated by noise | Noise dominated (total time) | Noise dominated (detector-on time) | Marked lightcurve |
|---|---|---|---|---|---|---|---|
| A | 7473 | 6259 | 1 | 1 | 0.01% | 0.02% | 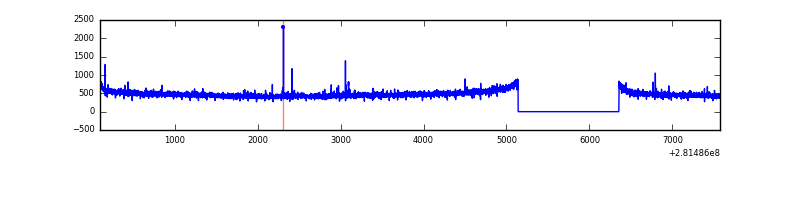 |
| B | 7473 | 6259 | 2 | 2 | 0.03% | 0.03% | 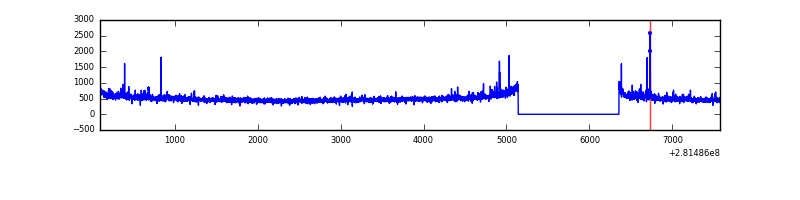 |
| C | 7473 | 6259 | 0 | 0 | 0.00% | 0.00% | 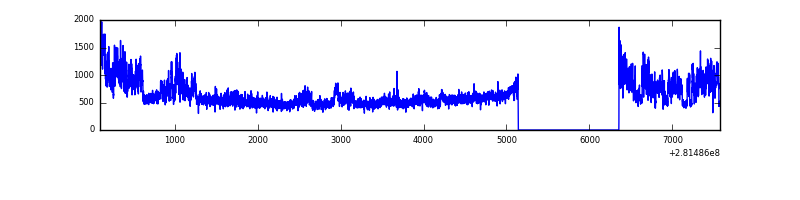 |
| D | 7473 | 6259 | 367 | 367 | 4.91% | 5.86% | 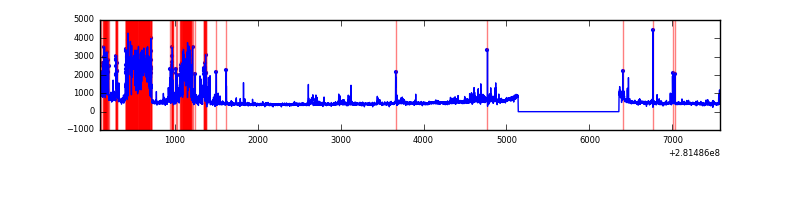 |
Top three noisy pixels from each quadrant. If the there are fewer than three noisy pixels in the level2.evt file, extra rows are filled as -1
| Pixel properties | Quadrant properties | ||||||
|---|---|---|---|---|---|---|---|
| Quadrant | DetID | PixID | Counts | Sigma | Mean | Median | Sigma |
| A | 4 | 2 | 16105 | 99.3 | 770 | 755 | 154.6 |
| A | 12 | 189 | 7156 | 41.41 | 770 | 755 | 154.6 |
| A | 0 | 226 | 6856 | 39.47 | 770 | 755 | 154.6 |
| B | 0 | 219 | 48177 | 321.41 | 776 | 758 | 147.5 |
| B | 0 | 229 | 26920 | 177.33 | 776 | 758 | 147.5 |
| B | 12 | 111 | 17015 | 110.19 | 776 | 758 | 147.5 |
| C | 3 | 233 | 1055224 | 6125.66 | 741 | 747 | 172.1 |
| C | 14 | 238 | 115463 | 666.41 | 741 | 747 | 172.1 |
| C | 1 | 16 | 28871 | 163.38 | 741 | 747 | 172.1 |
| D | 11 | 176 | 710675 | 4034.6 | 727 | 708 | 176.0 |
| D | 7 | 38 | 366805 | 2080.46 | 727 | 708 | 176.0 |
| D | 5 | 222 | 365454 | 2072.78 | 727 | 708 | 176.0 |
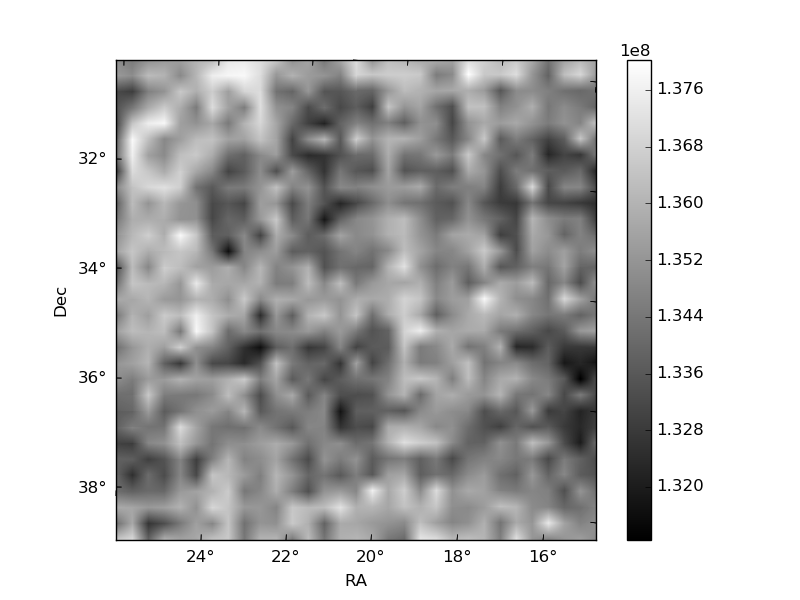
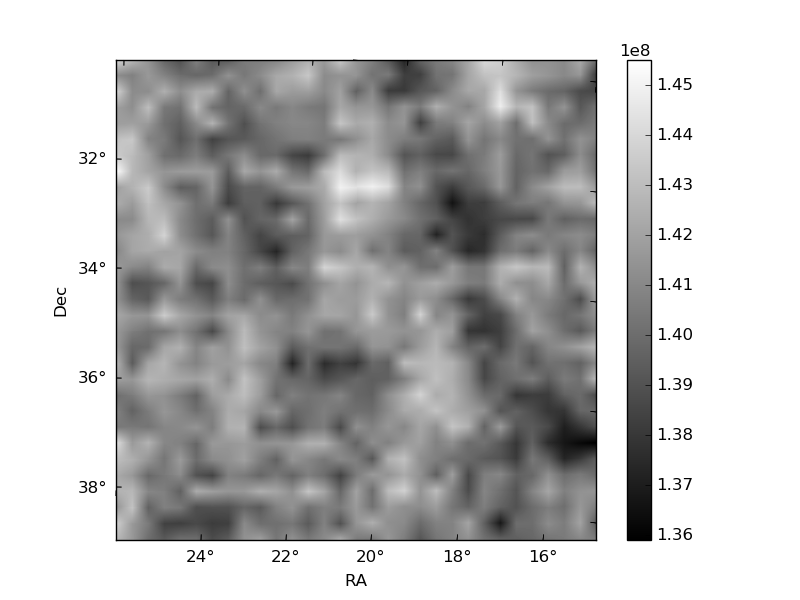
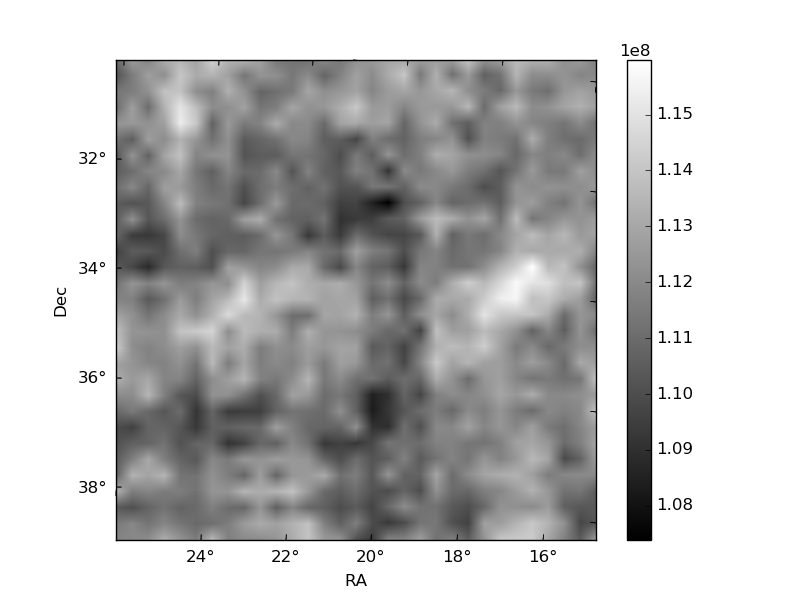
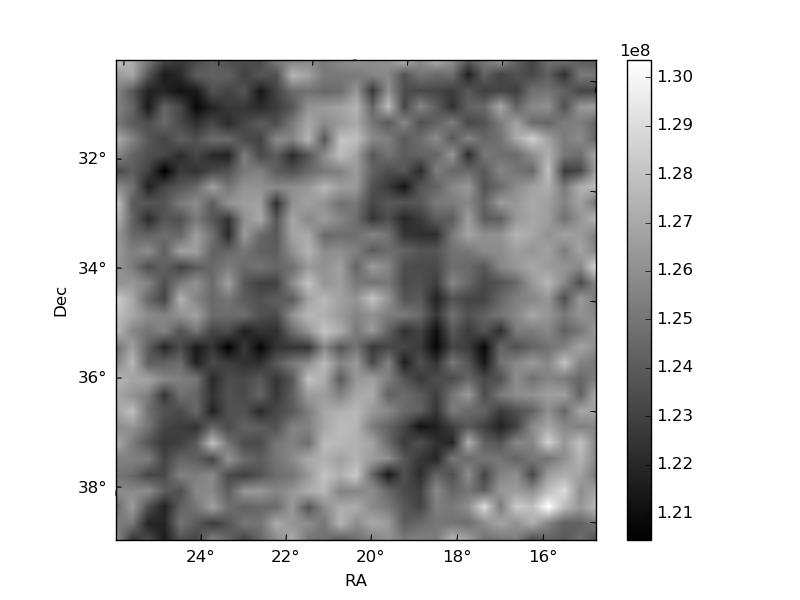
Histogram calculated using DETX and DETY for each event in the final _common_clean file
| Quadrant A | 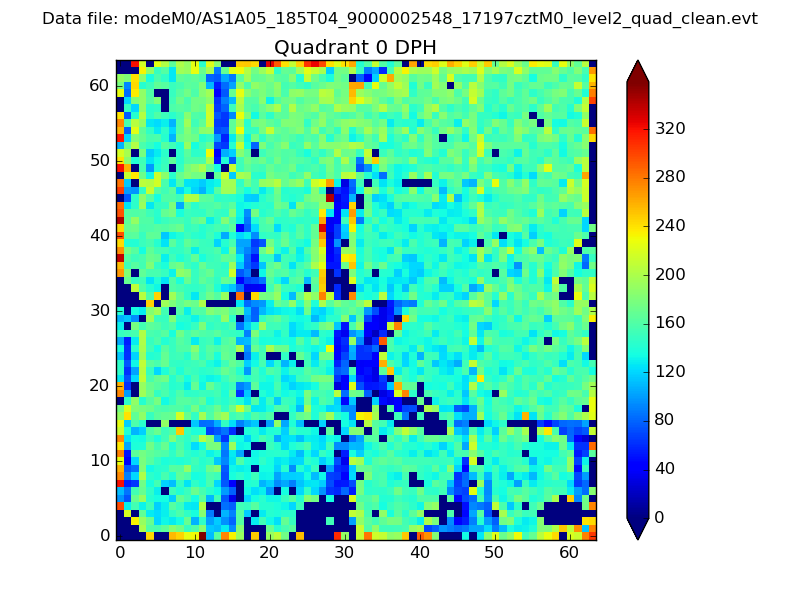 |
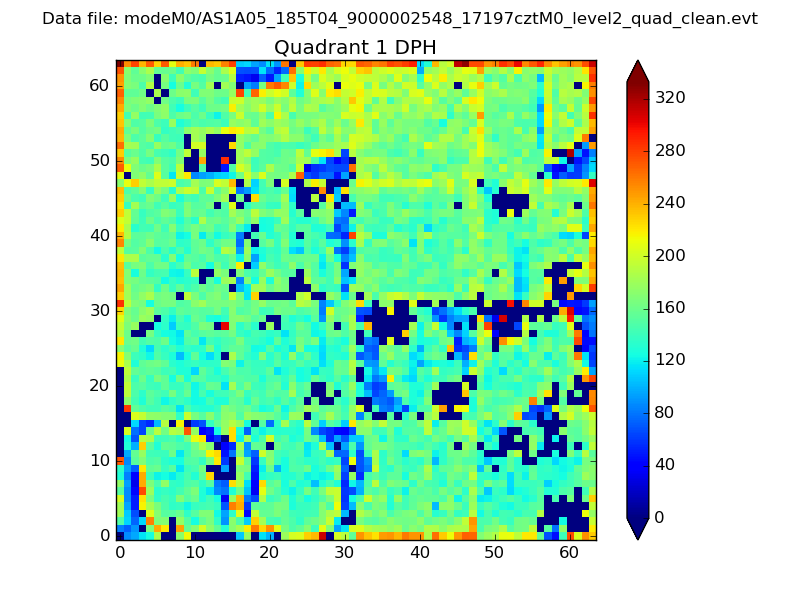 |
Quadrant B |
|---|---|---|---|
| Quadrant D | 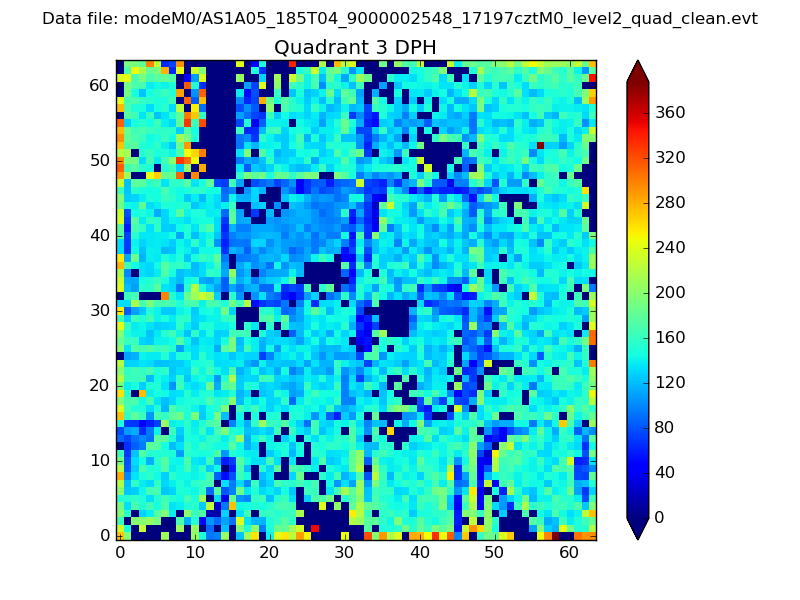 |
 |
Quadrant C |
| Plot type | Count rate plots | Images |
|---|---|---|
| Comparison with Poisson distribution Blue bars denote a histogram of data divided into 1 sec bins. Red curve is a Poisson curve with rate = median count rate of data. |
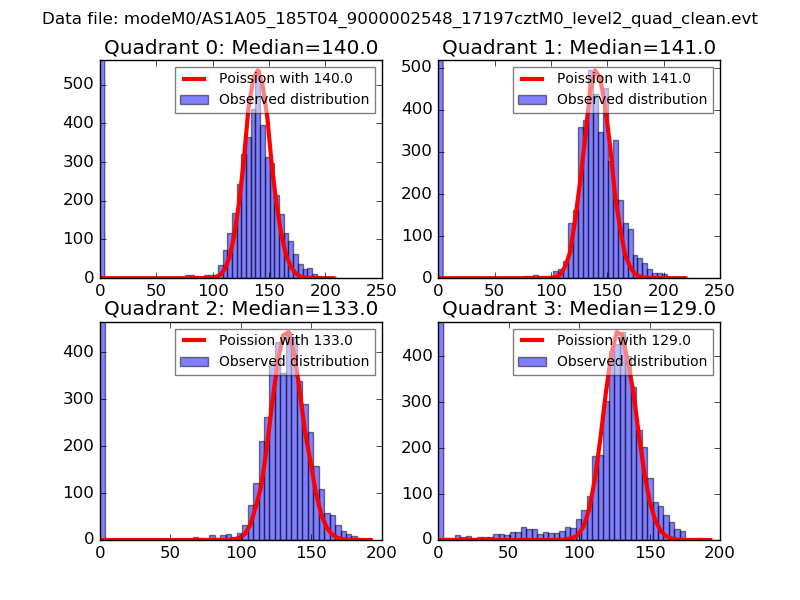 |
 |
| Quadrant-wise count rates Data is divided into 100 sec bins |
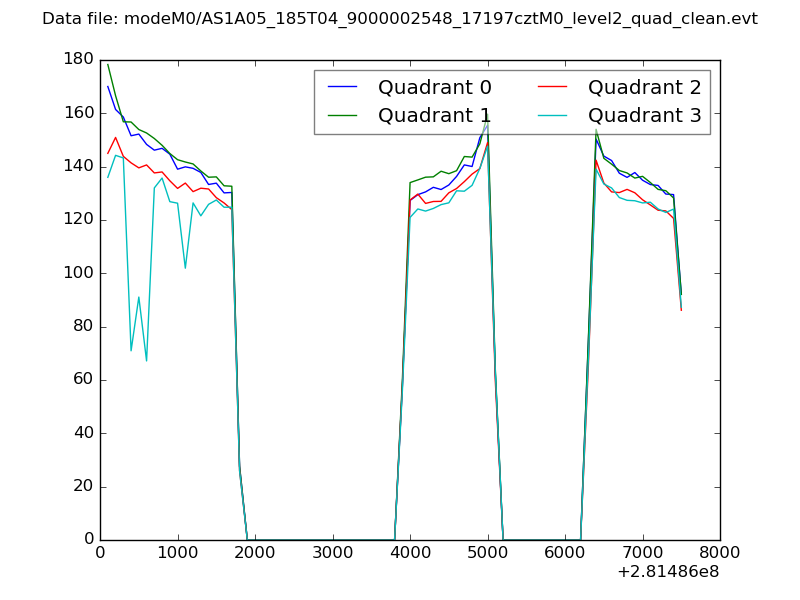 |
|
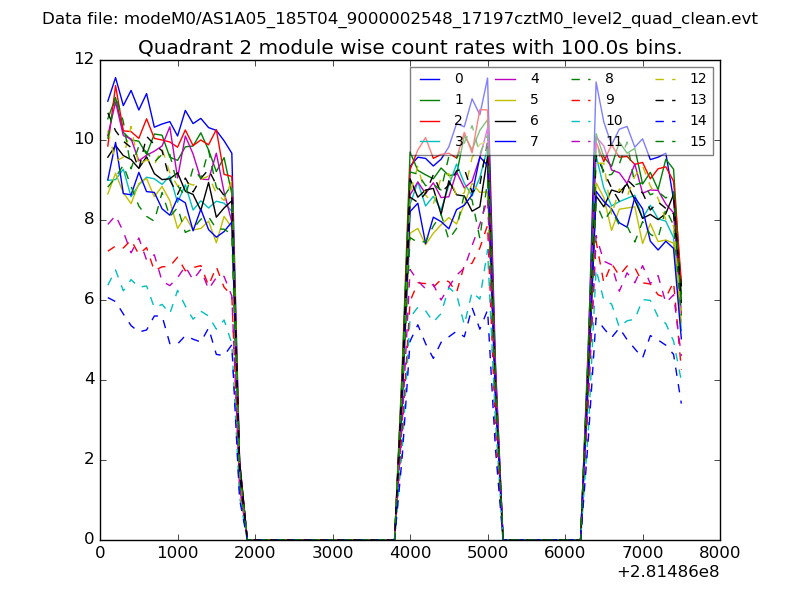
| Module-wise count rates for Quadrant A Data is divided into 100 sec bins |
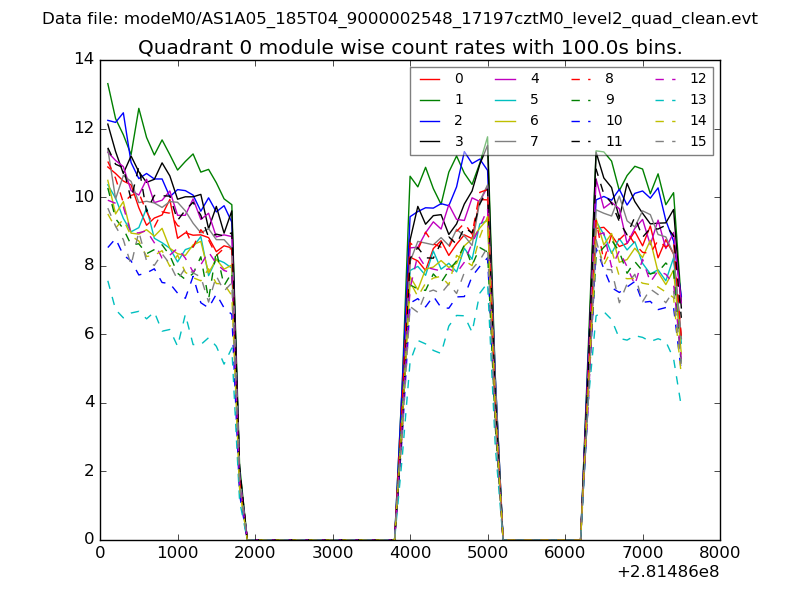 |
 |
| Module-wise count rates for Quadrant B Data is divided into 100 sec bins |
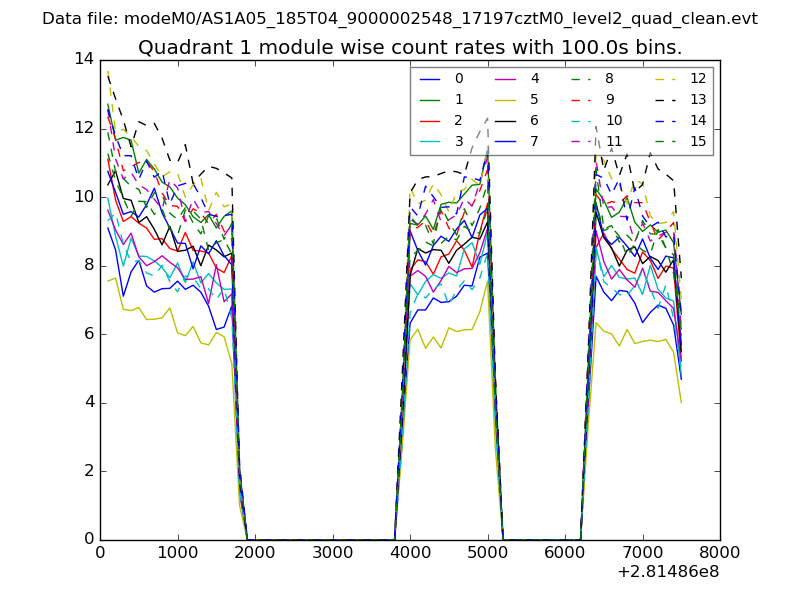 |
 |
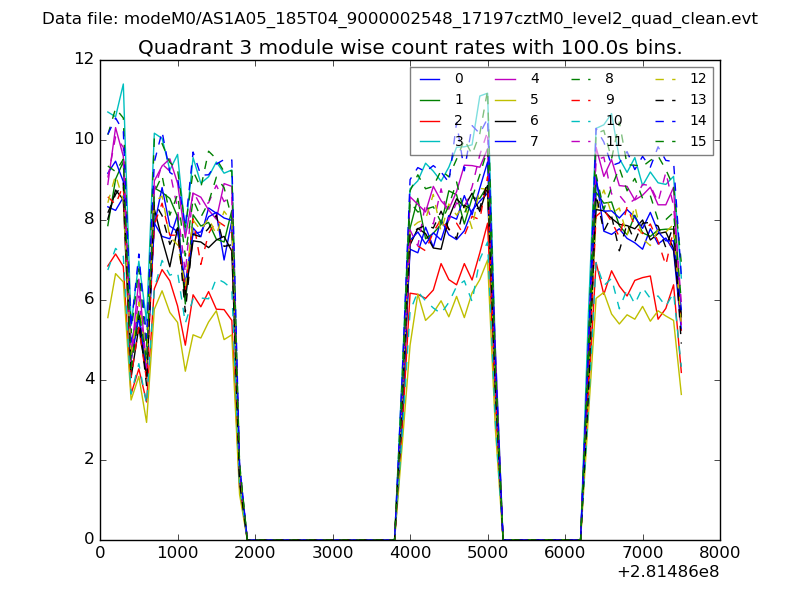
| Module-wise count rates for Quadrant C Data is divided into 100 sec bins |
 |
 |
| Module-wise count rates for Quadrant D Data is divided into 100 sec bins |
 |
 |
| Parameter | Plot |
|---|---|
| CZT HV Monitor | 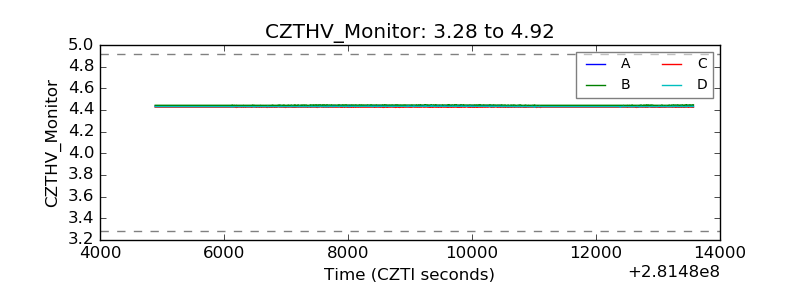 |
| D_VDD | 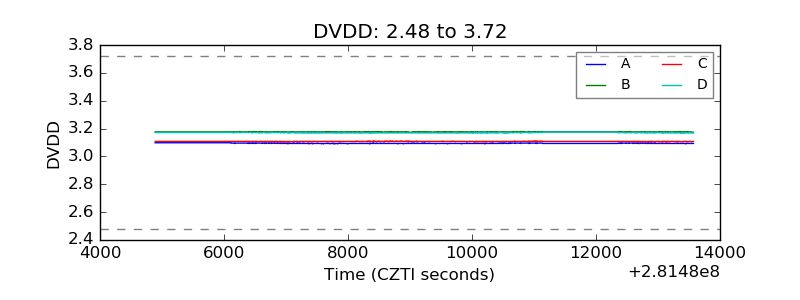 |
| Temperature 1 | 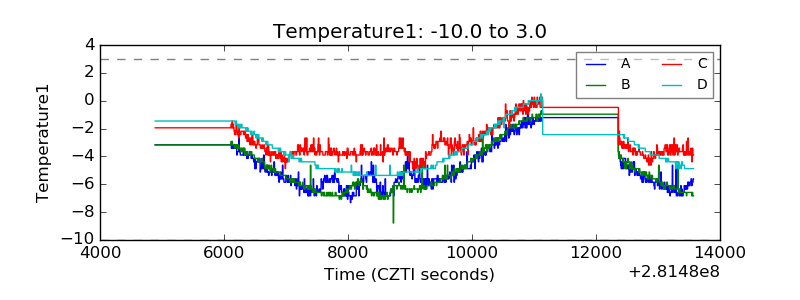 |
| Veto HV Monitor | 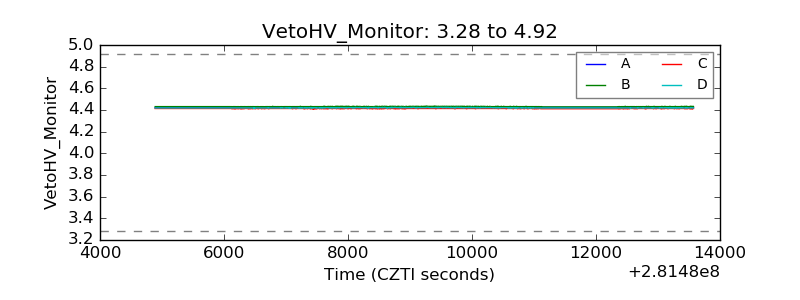 |
| Veto LLD | 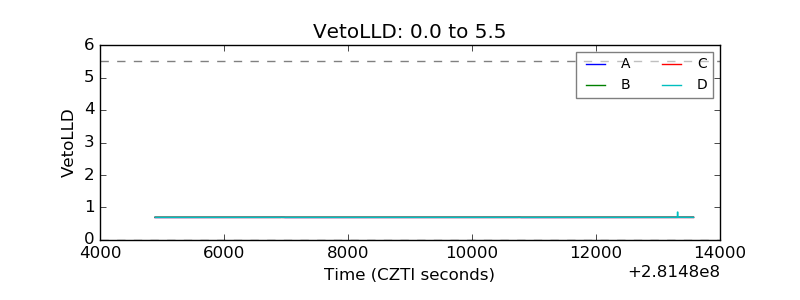 |
| Alpha Counter | 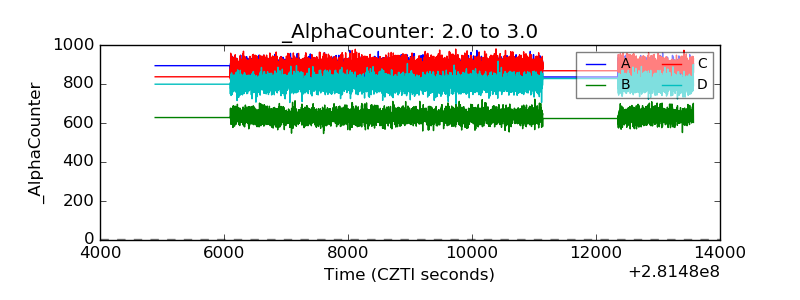 |
| _CPM_Rate | 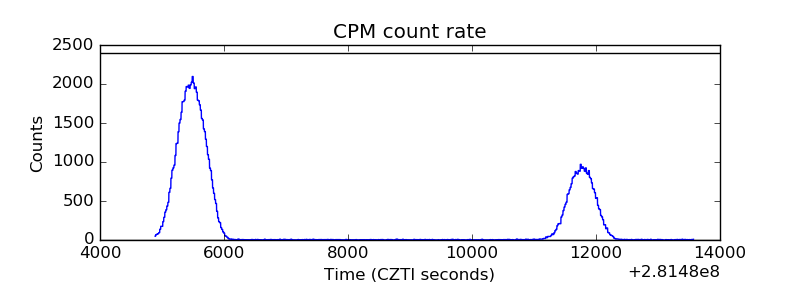 |
| CZT Counter | 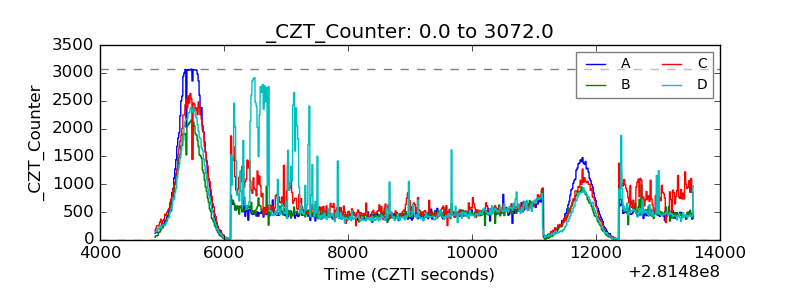 |
| +2.5 Volts monitor |  |
| +5 Volts monitor |  |
| _ROLL_ROT | 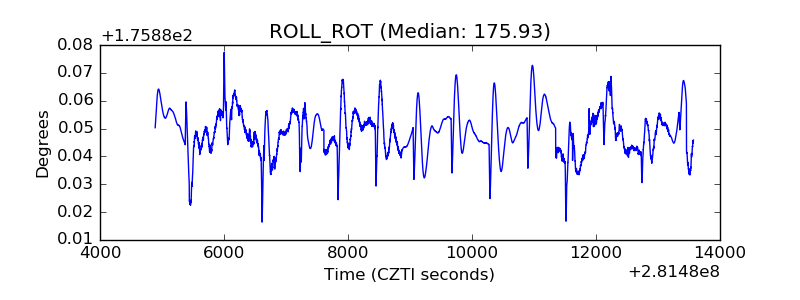 |
| _Roll_DEC | 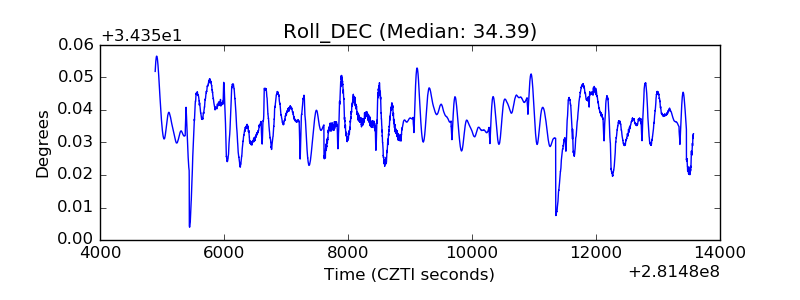 |
| _Roll_RA | 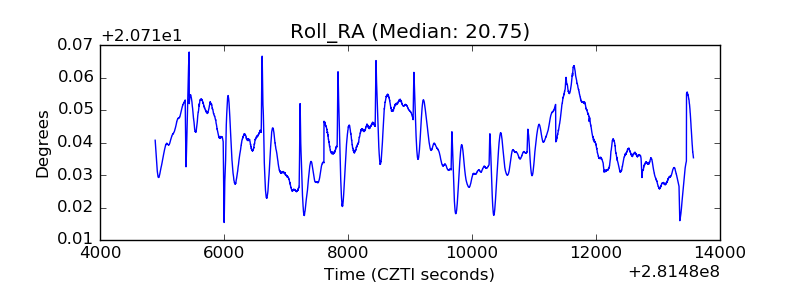 |
| Veto Counter | 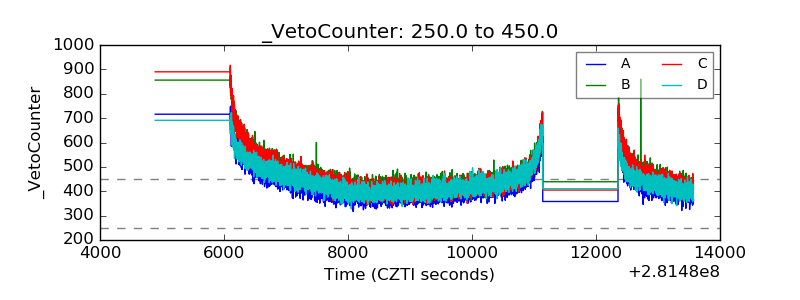 |