| Param | Original file | Final file |
|---|---|---|
| Filename | modeM0/AS1A05_185T04_9000002548_17198cztM0_level2.evt | modeM0/AS1A05_185T04_9000002548_17198cztM0_level2_quad_clean.evt |
| Size (bytes) | 502,079,040 | 88,113,600 |
| Size | 478.8 MB | 84.0 MB |
| Events in quadrant A | 3,181,505 | 564,508 |
| Events in quadrant B | 3,493,537 | 561,807 |
| Events in quadrant C | 4,622,248 | 534,922 |
| Events in quadrant D | 3,446,685 | 533,130 |
| Mode SS | |||
|---|---|---|---|
| Quadrant | BADHDUFLAG | Total packets | Discarded packets |
| A | 0 | 138 | 0 |
| B | 0 | 138 | 0 |
| C | 0 | 138 | 0 |
| D | 0 | 138 | 0 |
| Mode M9 | |||
|---|---|---|---|
| Quadrant | BADHDUFLAG | Total packets | Discarded packets |
| A | 0 | 22 | 0 |
| B | 0 | 22 | 0 |
| C | 0 | 22 | 0 |
| D | 0 | 22 | 0 |
| Mode M0 | |||
|---|---|---|---|
| Quadrant | BADHDUFLAG | Total packets | Discarded packets |
| A | 0 | 14014 | 2 |
| B | 0 | 14932 | 2 |
| C | 0 | 18178 | 2 |
| D | 0 | 14994 | 2 |
| Quadrant | Total seconds | Saturated seconds | Saturation percentage |
|---|---|---|---|
| A | 6806 | 30 | 0.440788% |
| B | 6806 | 119 | 1.748457% |
| C | 6806 | 182 | 2.674111% |
| D | 6807 | 57 | 0.837373% |
Noise dominated data is calculated using 1-second bins in cleaned event files. If a bin has >2000 counts, and if more than 50% of those come from <1% of pixels, then it is considered to be noise-dominated and hence unusable.
| Quadrant | # 1 sec bins | Bins with >0 counts | Bins with >2000 counts | High rate bins dominated by noise | Noise dominated (total time) | Noise dominated (detector-on time) | Marked lightcurve |
|---|---|---|---|---|---|---|---|
| A | 8951 | 6808 | 0 | 0 | 0.00% | 0.00% | 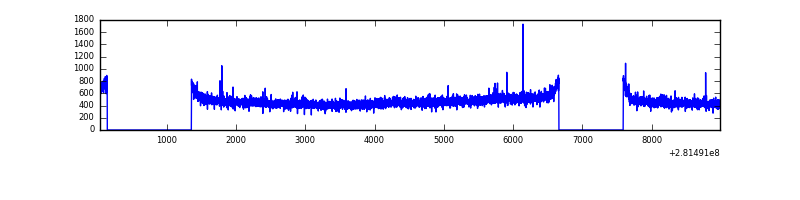 |
| B | 8951 | 6808 | 34 | 34 | 0.38% | 0.50% | 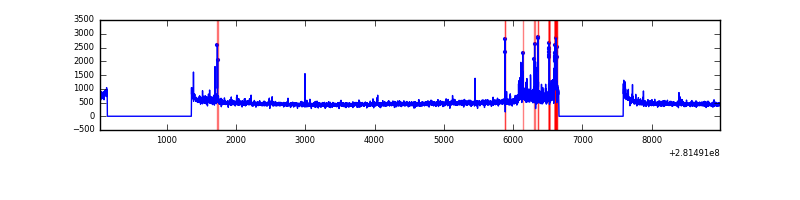 |
| C | 8951 | 6808 | 0 | 0 | 0.00% | 0.00% |  |
| D | 8952 | 6809 | 24 | 24 | 0.27% | 0.35% | 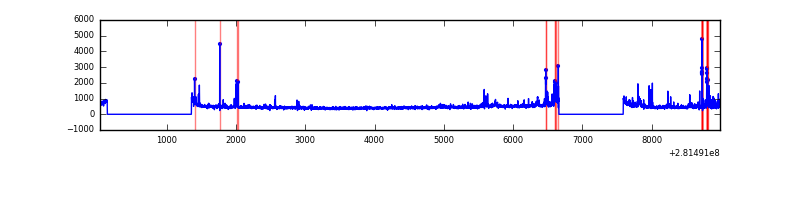 |
Top three noisy pixels from each quadrant. If the there are fewer than three noisy pixels in the level2.evt file, extra rows are filled as -1
| Pixel properties | Quadrant properties | ||||||
|---|---|---|---|---|---|---|---|
| Quadrant | DetID | PixID | Counts | Sigma | Mean | Median | Sigma |
| A | 12 | 189 | 14407 | 81.72 | 822 | 805 | 166.5 |
| A | 0 | 226 | 7091 | 37.76 | 822 | 805 | 166.5 |
| A | 12 | 194 | 6033 | 31.41 | 822 | 805 | 166.5 |
| B | 7 | 220 | 188952 | 1183.97 | 821 | 799 | 158.9 |
| B | 0 | 219 | 28191 | 172.37 | 821 | 799 | 158.9 |
| B | 12 | 111 | 18241 | 109.76 | 821 | 799 | 158.9 |
| C | 3 | 233 | 1418202 | 7696.1 | 786 | 789 | 184.2 |
| C | 14 | 238 | 119476 | 644.43 | 786 | 789 | 184.2 |
| C | 1 | 16 | 19710 | 102.73 | 786 | 789 | 184.2 |
| D | 5 | 222 | 257303 | 1333.08 | 795 | 774 | 192.4 |
| D | 13 | 189 | 74048 | 380.78 | 795 | 774 | 192.4 |
| D | 10 | 70 | 39436 | 200.91 | 795 | 774 | 192.4 |
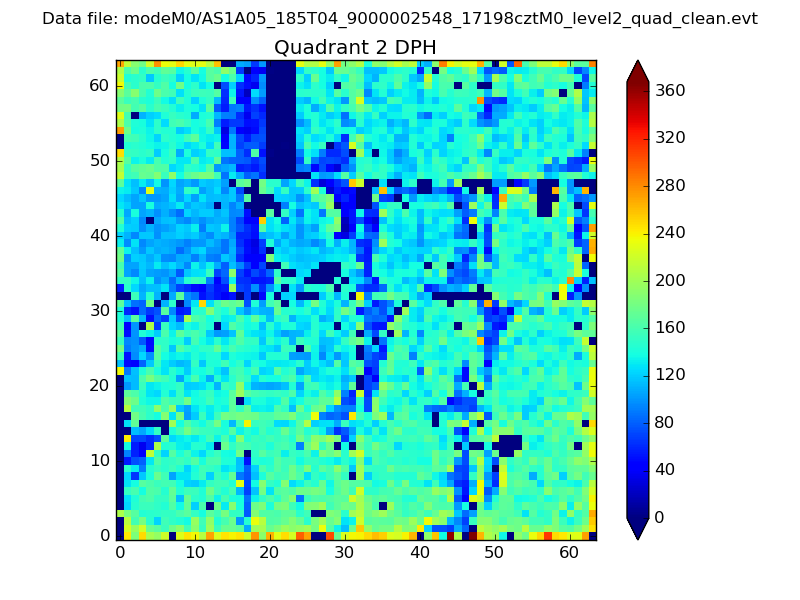
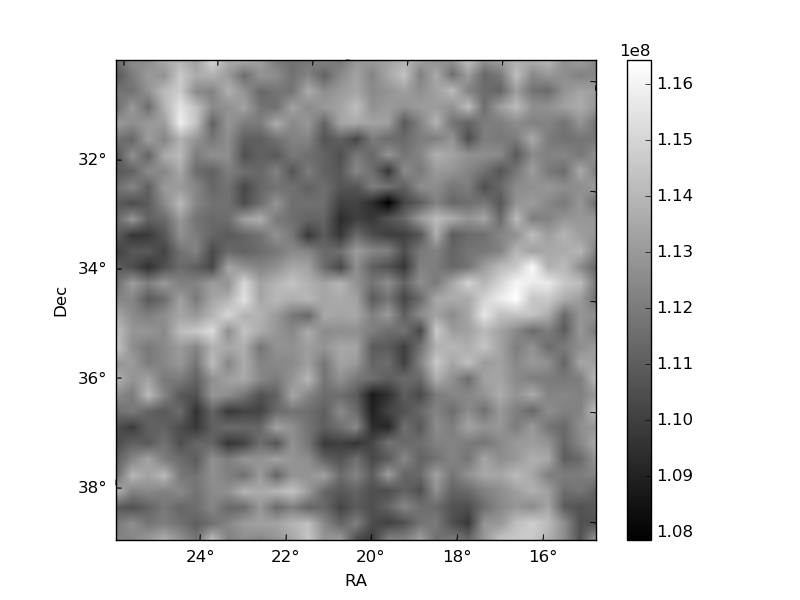
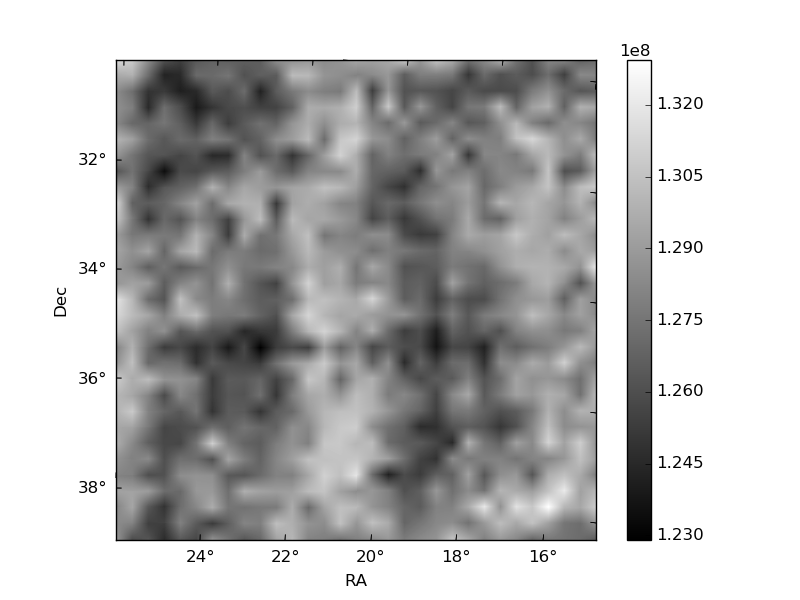
Histogram calculated using DETX and DETY for each event in the final _common_clean file
| Quadrant A |  |
 |
Quadrant B |
|---|---|---|---|
| Quadrant D |  |
 |
Quadrant C |
| Plot type | Count rate plots | Images |
|---|---|---|
| Comparison with Poisson distribution Blue bars denote a histogram of data divided into 1 sec bins. Red curve is a Poisson curve with rate = median count rate of data. |
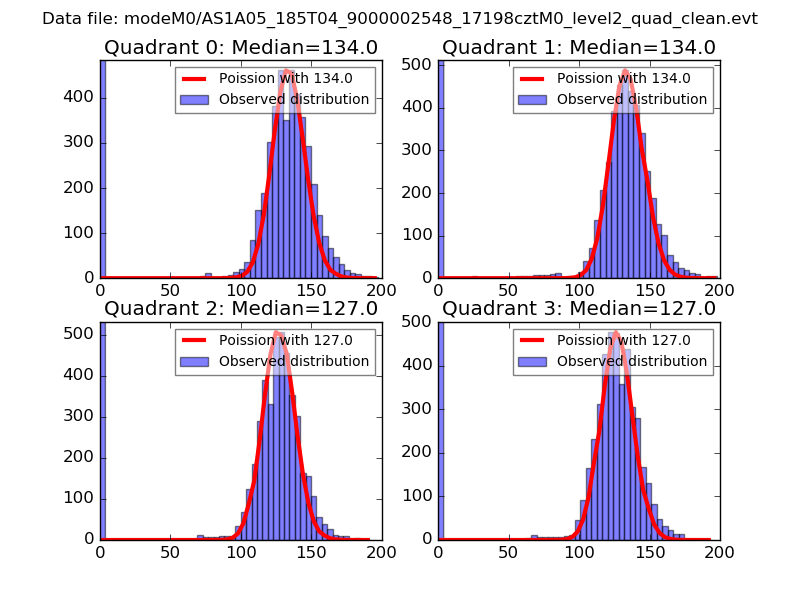 |
 |
| Quadrant-wise count rates Data is divided into 100 sec bins |
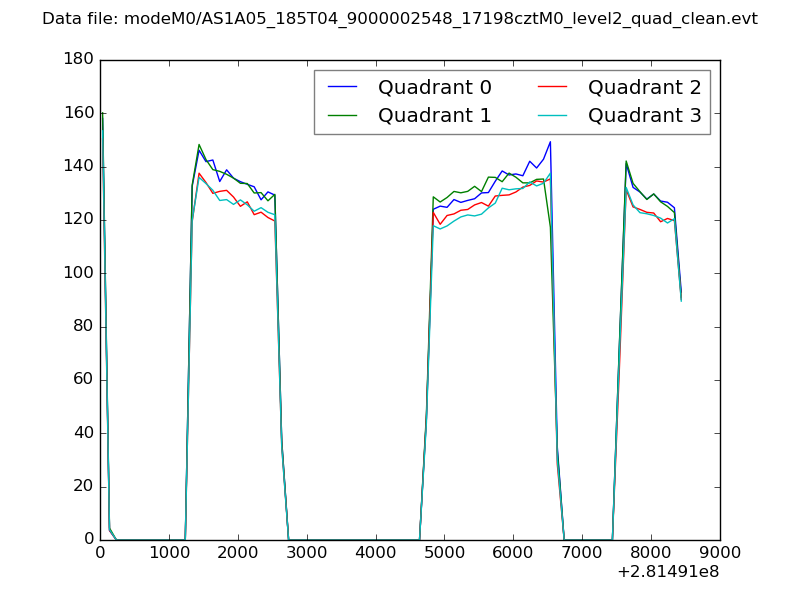 |
|
| Module-wise count rates for Quadrant A Data is divided into 100 sec bins |
 |
 |
| Module-wise count rates for Quadrant B Data is divided into 100 sec bins |
 |
 |
| Module-wise count rates for Quadrant C Data is divided into 100 sec bins |
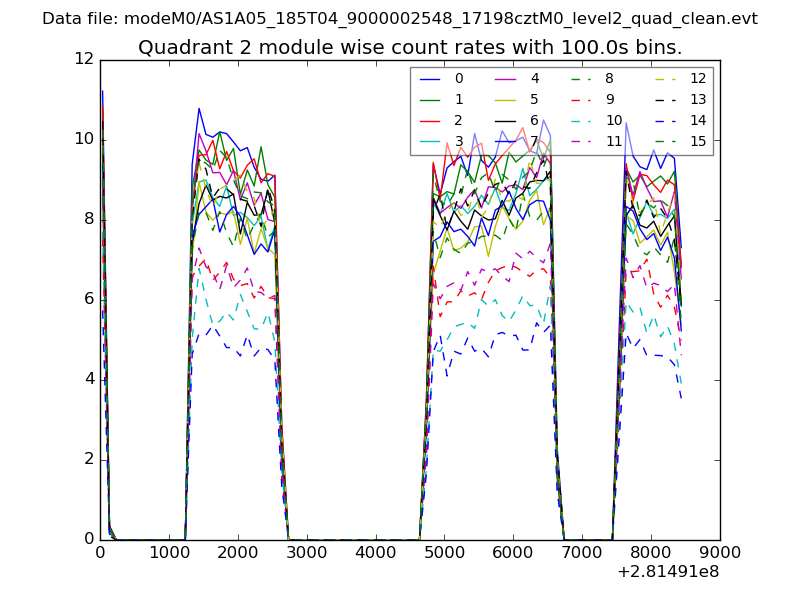 |
 |
| Module-wise count rates for Quadrant D Data is divided into 100 sec bins |
 |
 |
| Parameter | Plot |
|---|---|
| CZT HV Monitor | 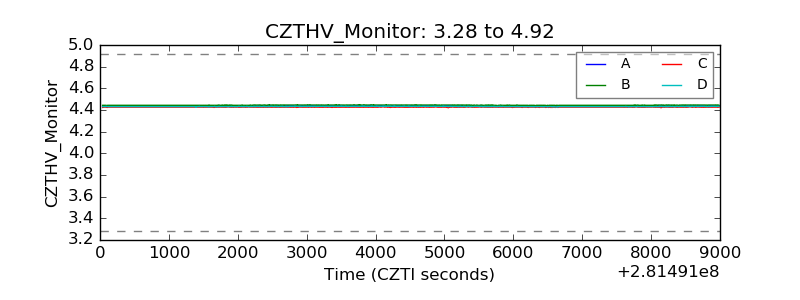 |
| D_VDD | 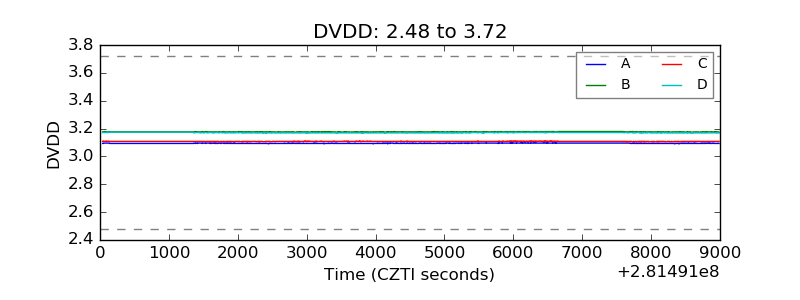 |
| Temperature 1 | 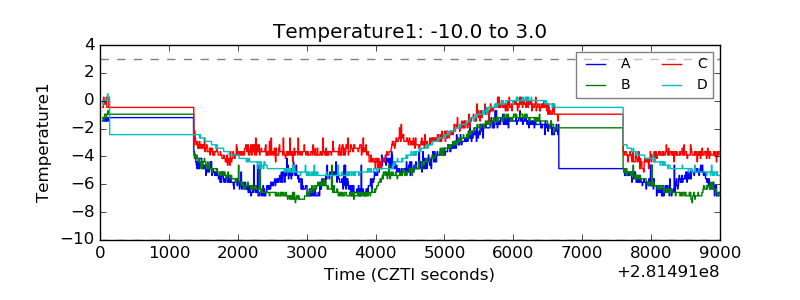 |
| Veto HV Monitor | 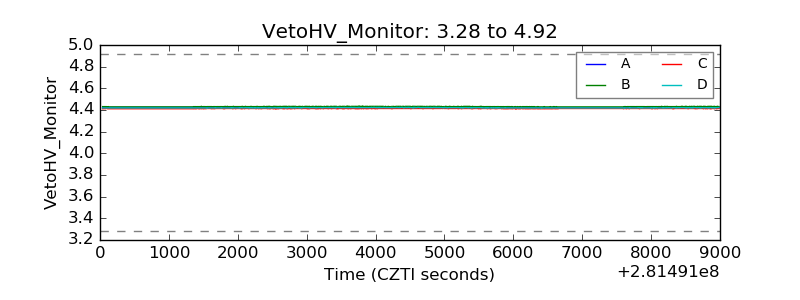 |
| Veto LLD | 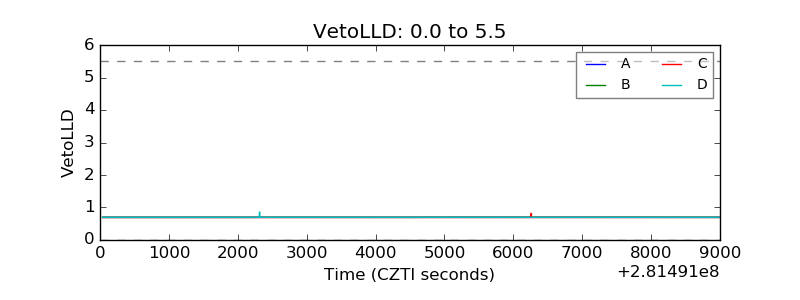 |
| Alpha Counter | 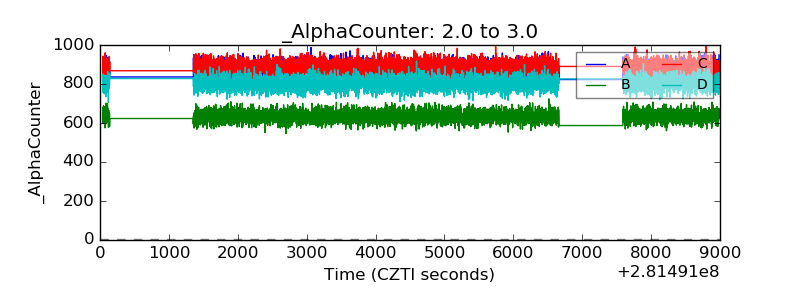 |
| _CPM_Rate | 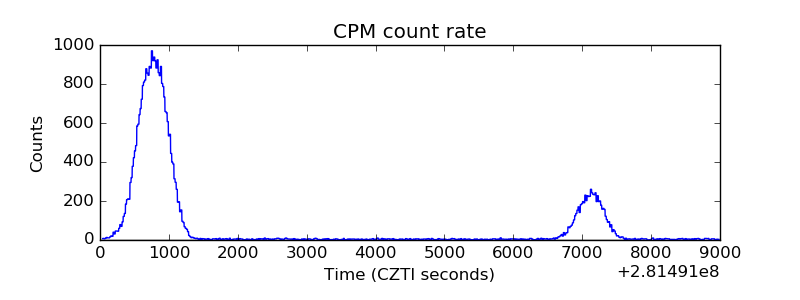 |
| CZT Counter | 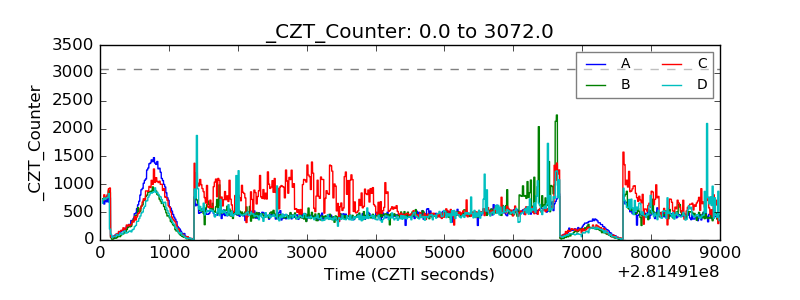 |
| +2.5 Volts monitor |  |
| +5 Volts monitor | 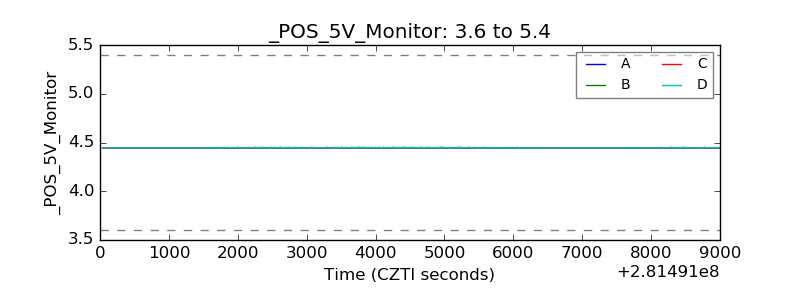 |
| _ROLL_ROT | 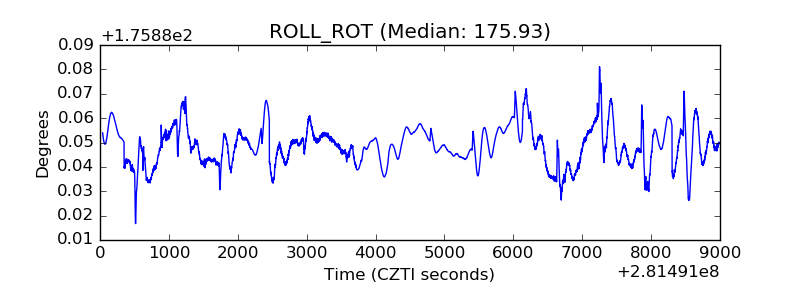 |
| _Roll_DEC | 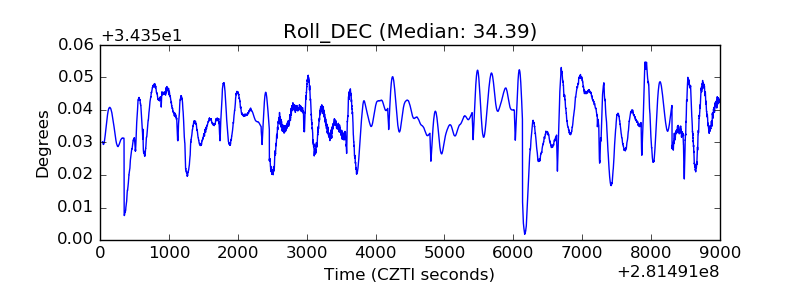 |
| _Roll_RA | 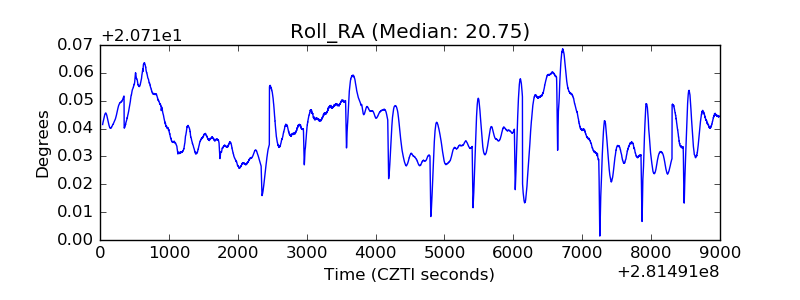 |
| Veto Counter | 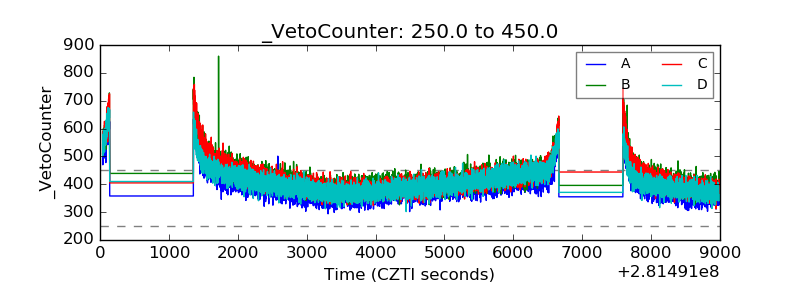 |