| Param | Original file | Final file |
|---|---|---|
| Filename | modeM0/AS1A05_185T04_9000002548_17199cztM0_level2.evt | modeM0/AS1A05_185T04_9000002548_17199cztM0_level2_quad_clean.evt |
| Size (bytes) | 521,366,400 | 84,052,800 |
| Size | 497.2 MB | 80.2 MB |
| Events in quadrant A | 3,269,172 | 527,334 |
| Events in quadrant B | 3,468,732 | 527,152 |
| Events in quadrant C | 4,852,938 | 497,176 |
| Events in quadrant D | 3,718,618 | 500,568 |
| Mode SS | |||
|---|---|---|---|
| Quadrant | BADHDUFLAG | Total packets | Discarded packets |
| A | 0 | 142 | 0 |
| B | 0 | 142 | 0 |
| C | 0 | 142 | 0 |
| D | 0 | 142 | 0 |
| Mode M9 | |||
|---|---|---|---|
| Quadrant | BADHDUFLAG | Total packets | Discarded packets |
| A | 0 | 8 | 0 |
| B | 0 | 9 | 0 |
| C | 0 | 9 | 0 |
| D | 0 | 9 | 0 |
| Mode M0 | |||
|---|---|---|---|
| Quadrant | BADHDUFLAG | Total packets | Discarded packets |
| A | 0 | 14540 | 2 |
| B | 0 | 15059 | 2 |
| C | 0 | 19342 | 2 |
| D | 0 | 15879 | 2 |
| Quadrant | Total seconds | Saturated seconds | Saturation percentage |
|---|---|---|---|
| A | 7083 | 32 | 0.451786% |
| B | 7083 | 82 | 1.157702% |
| C | 7083 | 184 | 2.597769% |
| D | 7083 | 45 | 0.635324% |
Noise dominated data is calculated using 1-second bins in cleaned event files. If a bin has >2000 counts, and if more than 50% of those come from <1% of pixels, then it is considered to be noise-dominated and hence unusable.
| Quadrant | # 1 sec bins | Bins with >0 counts | Bins with >2000 counts | High rate bins dominated by noise | Noise dominated (total time) | Noise dominated (detector-on time) | Marked lightcurve |
|---|---|---|---|---|---|---|---|
| A | 7648 | 7084 | 3 | 3 | 0.04% | 0.04% | 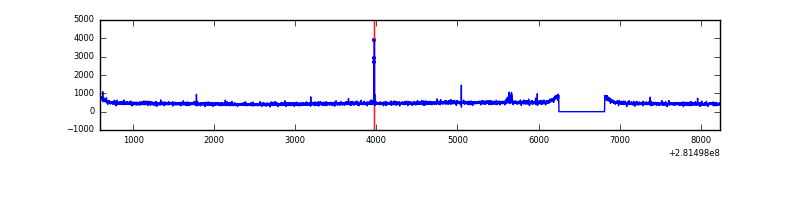 |
| B | 7648 | 7084 | 22 | 22 | 0.29% | 0.31% | 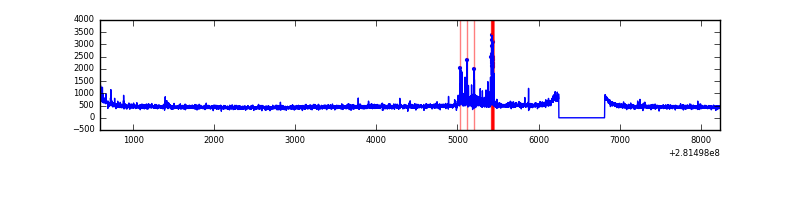 |
| C | 7648 | 7084 | 0 | 0 | 0.00% | 0.00% | 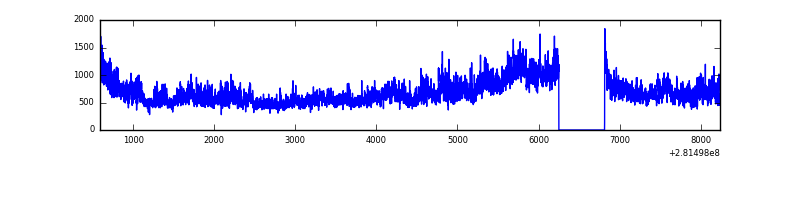 |
| D | 7648 | 7084 | 30 | 30 | 0.39% | 0.42% | 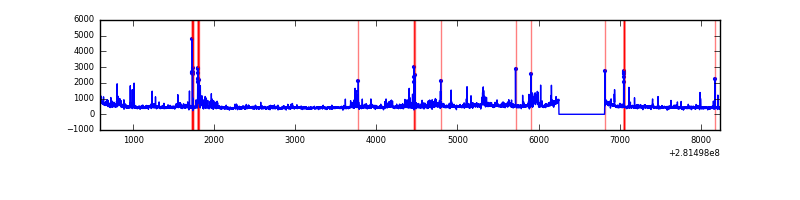 |
Top three noisy pixels from each quadrant. If the there are fewer than three noisy pixels in the level2.evt file, extra rows are filled as -1
| Pixel properties | Quadrant properties | ||||||
|---|---|---|---|---|---|---|---|
| Quadrant | DetID | PixID | Counts | Sigma | Mean | Median | Sigma |
| A | 12 | 189 | 21606 | 121.79 | 841 | 822 | 170.7 |
| A | 4 | 2 | 14205 | 78.42 | 841 | 822 | 170.7 |
| A | 0 | 226 | 7375 | 38.4 | 841 | 822 | 170.7 |
| B | 7 | 220 | 139345 | 857.33 | 841 | 819 | 161.6 |
| B | 12 | 111 | 18923 | 112.04 | 841 | 819 | 161.6 |
| B | 11 | 111 | 16265 | 95.59 | 841 | 819 | 161.6 |
| C | 3 | 233 | 1588235 | 8388.77 | 804 | 809 | 189.2 |
| C | 14 | 238 | 123315 | 647.38 | 804 | 809 | 189.2 |
| C | 1 | 16 | 5799 | 26.37 | 804 | 809 | 189.2 |
| D | 5 | 222 | 399553 | 2015.13 | 814 | 791 | 197.9 |
| D | 13 | 189 | 85862 | 429.9 | 814 | 791 | 197.9 |
| D | 10 | 70 | 58521 | 291.74 | 814 | 791 | 197.9 |
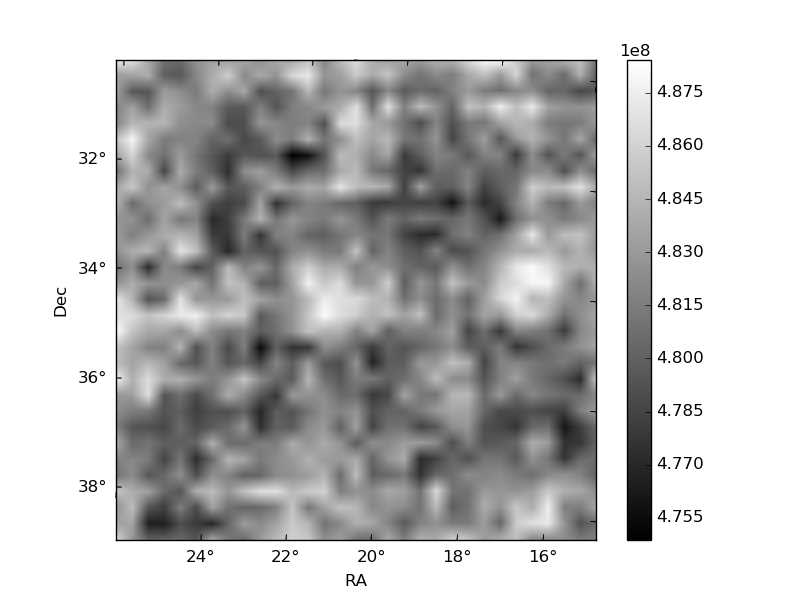
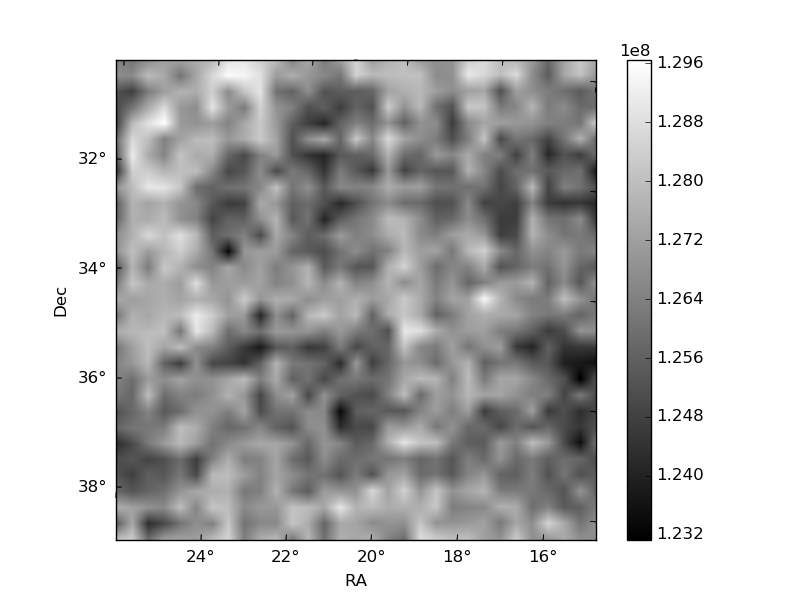
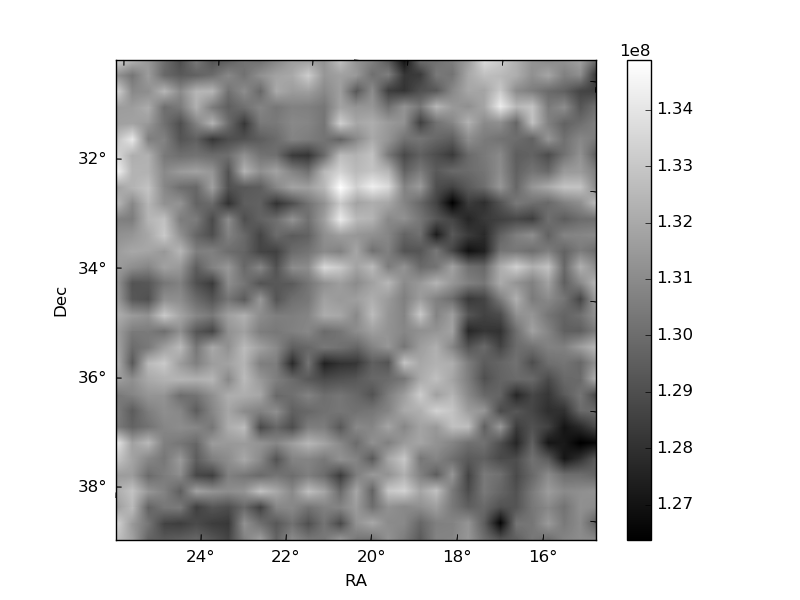
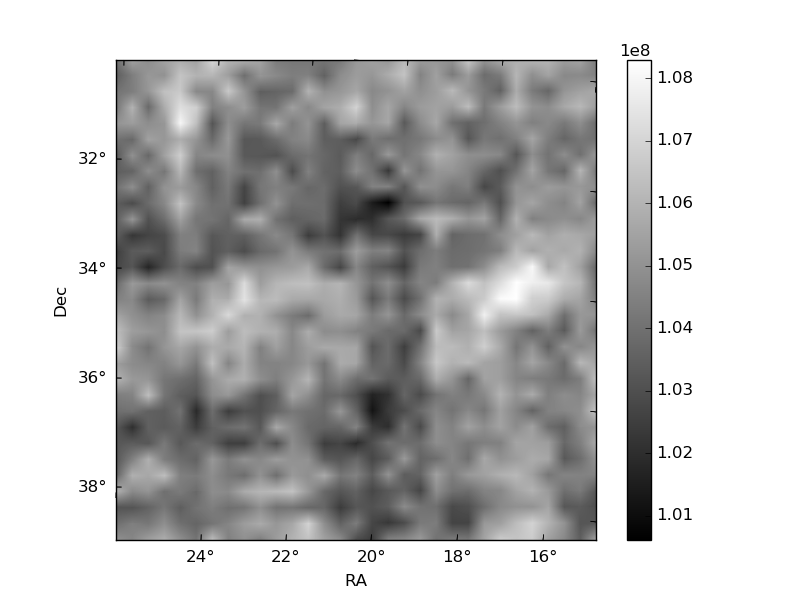
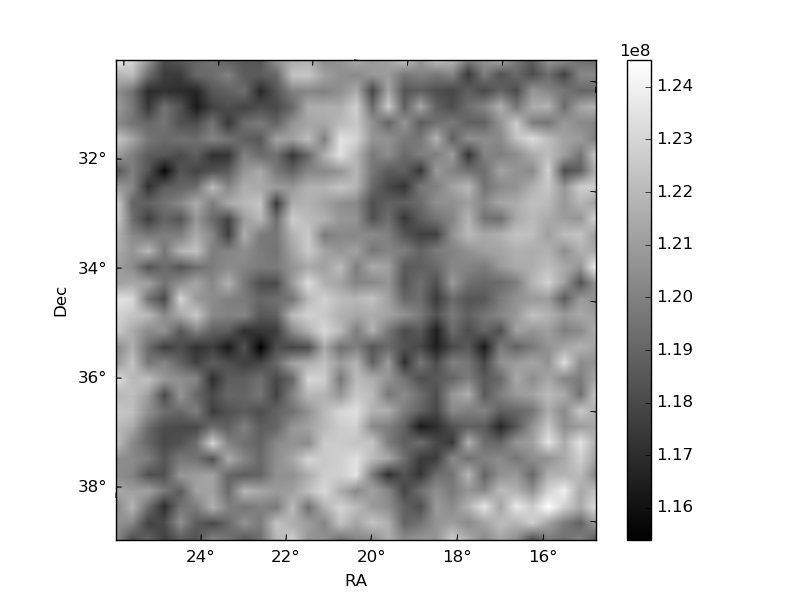
Histogram calculated using DETX and DETY for each event in the final _common_clean file
| Quadrant A | 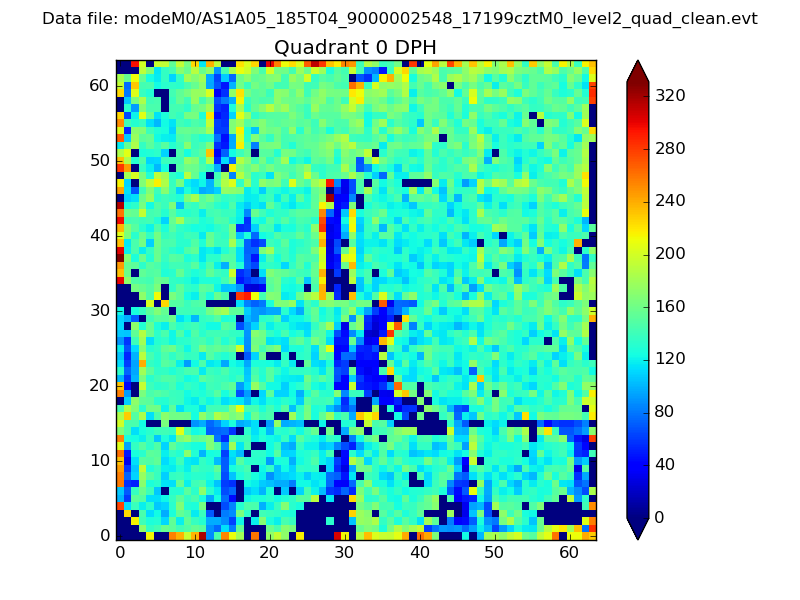 |
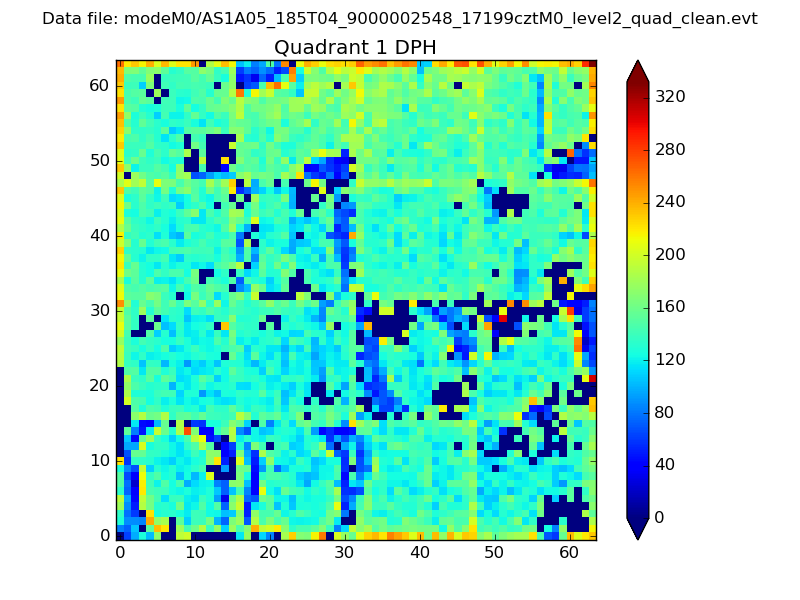 |
Quadrant B |
|---|---|---|---|
| Quadrant D | 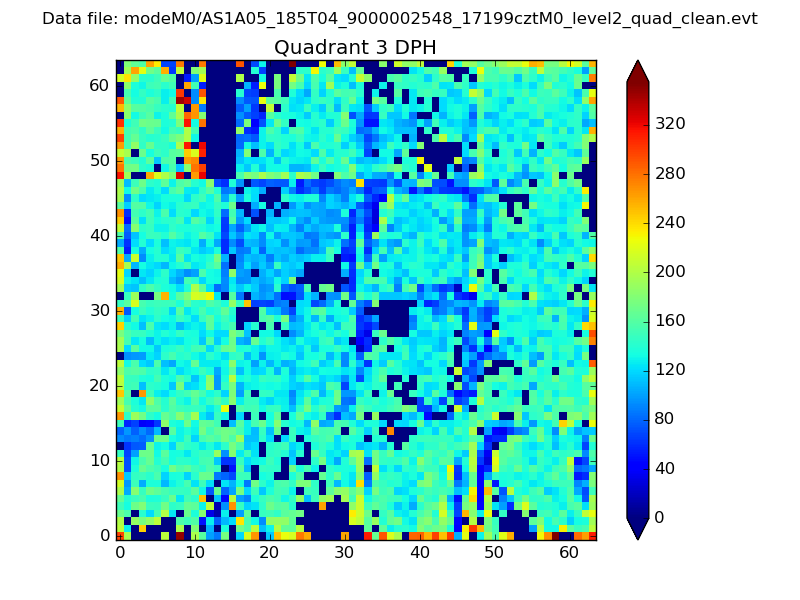 |
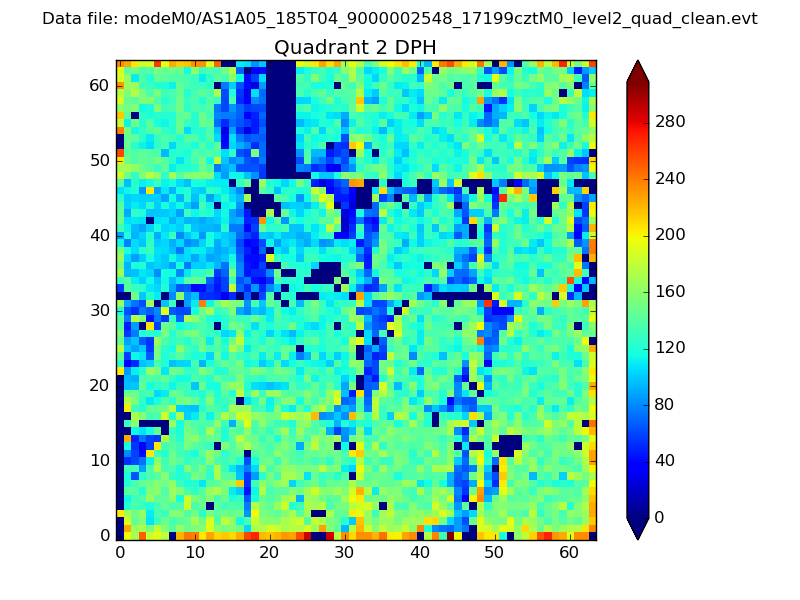 |
Quadrant C |
| Plot type | Count rate plots | Images |
|---|---|---|
| Comparison with Poisson distribution Blue bars denote a histogram of data divided into 1 sec bins. Red curve is a Poisson curve with rate = median count rate of data. |
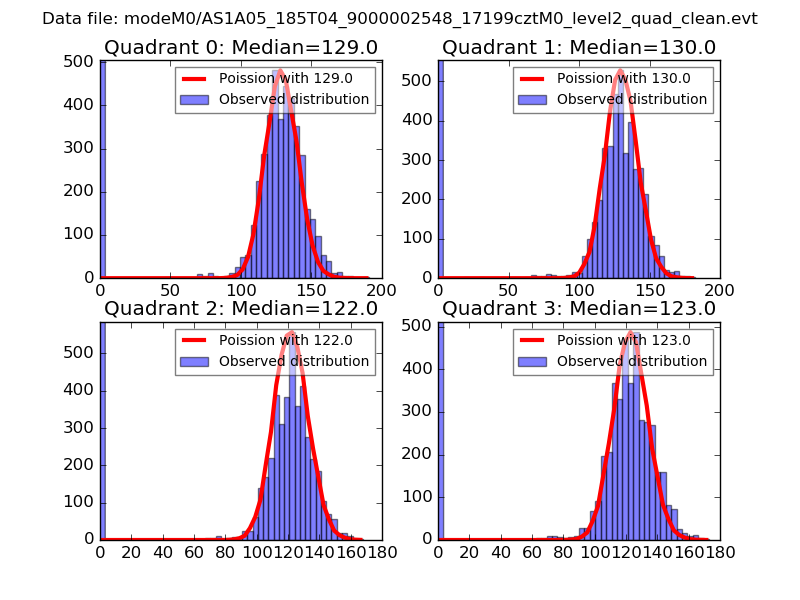 |
 |
| Quadrant-wise count rates Data is divided into 100 sec bins |
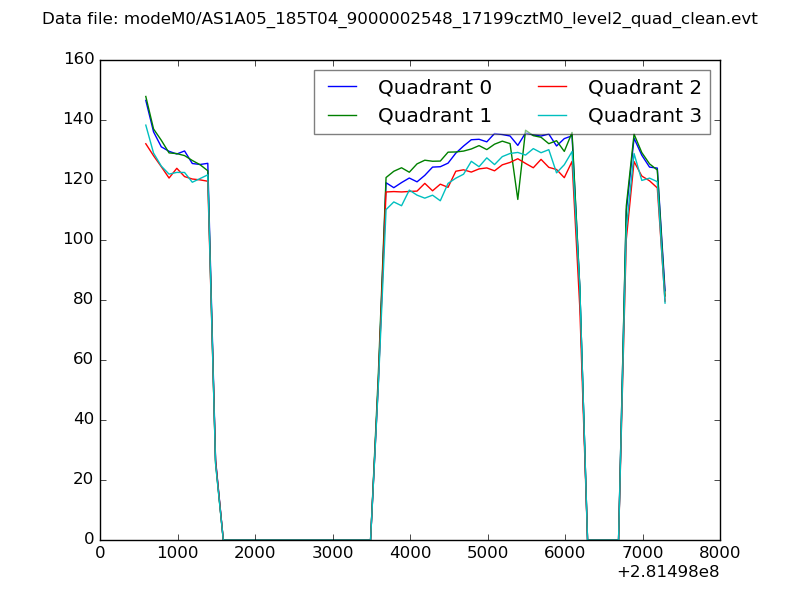 |
|
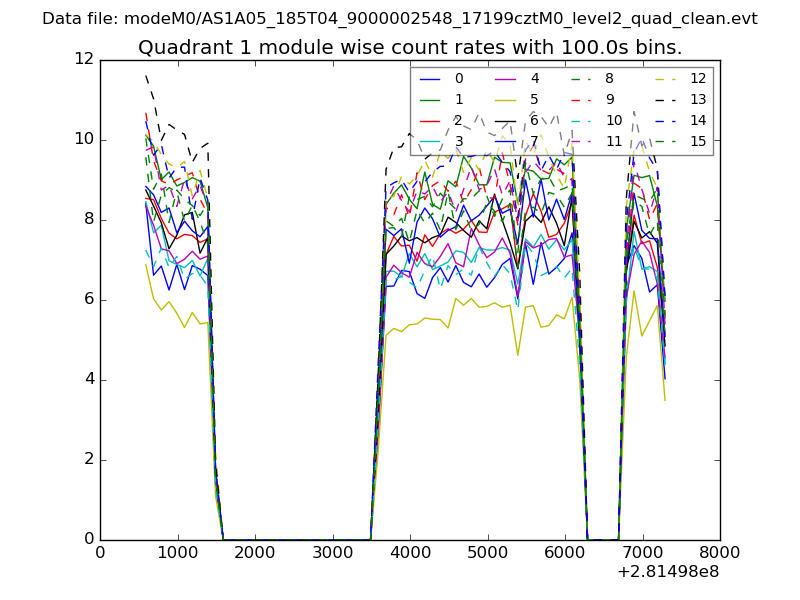
| Module-wise count rates for Quadrant A Data is divided into 100 sec bins |
 |
 |
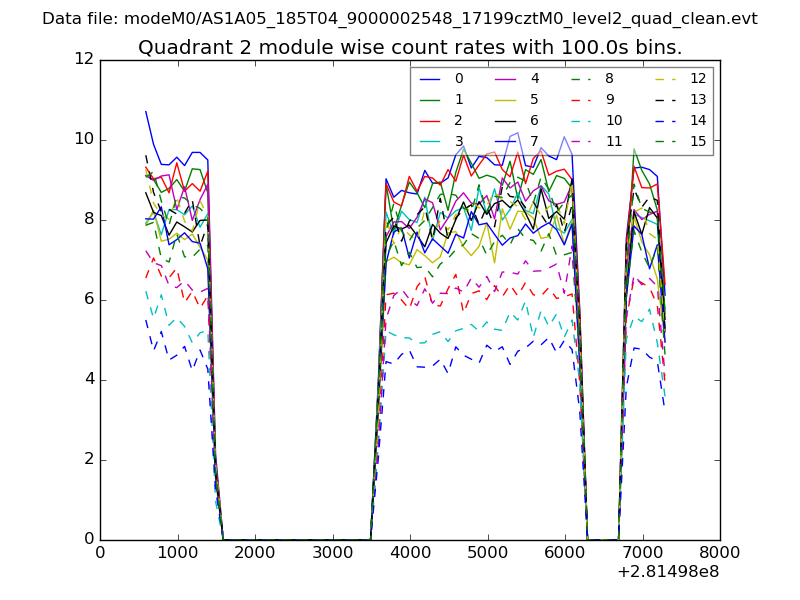
| Module-wise count rates for Quadrant B Data is divided into 100 sec bins |
 |
 |
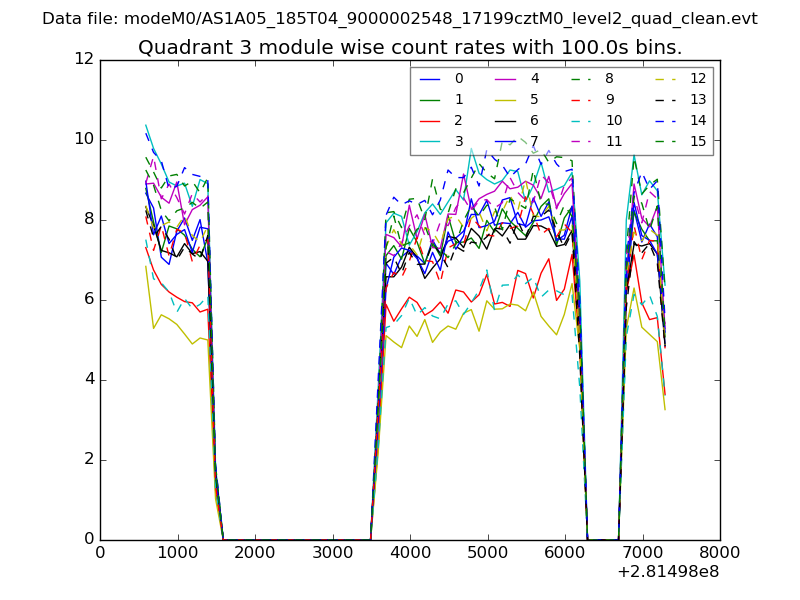
| Module-wise count rates for Quadrant C Data is divided into 100 sec bins |
 |
 |
| Module-wise count rates for Quadrant D Data is divided into 100 sec bins |
 |
 |
| Parameter | Plot |
|---|---|
| CZT HV Monitor | 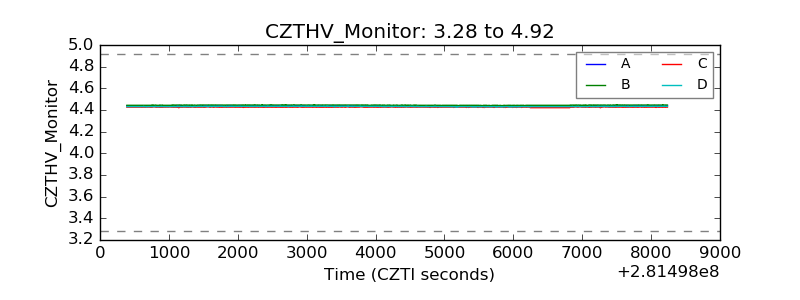 |
| D_VDD | 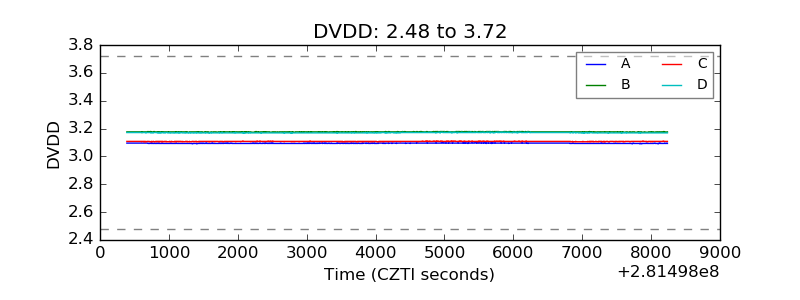 |
| Temperature 1 |  |
| Veto HV Monitor | 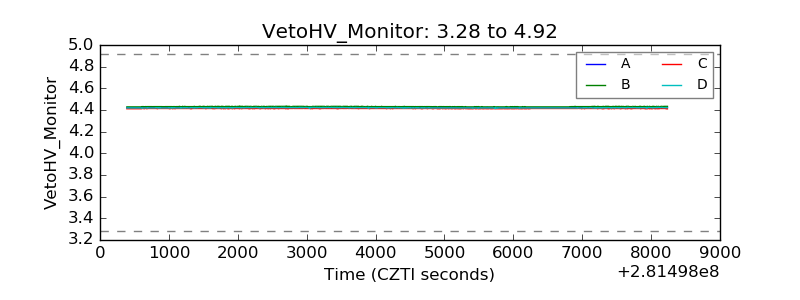 |
| Veto LLD | 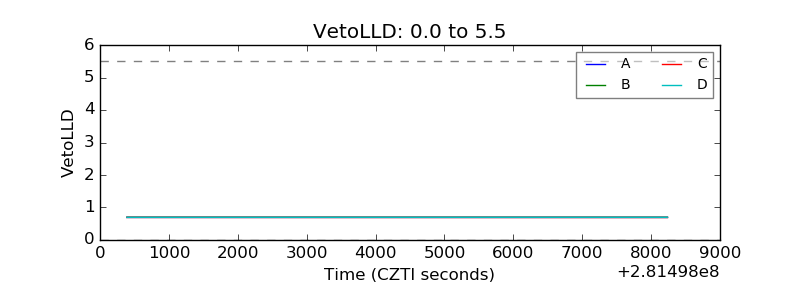 |
| Alpha Counter | 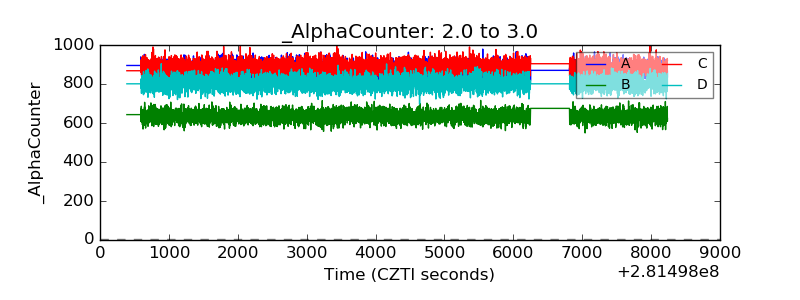 |
| _CPM_Rate | 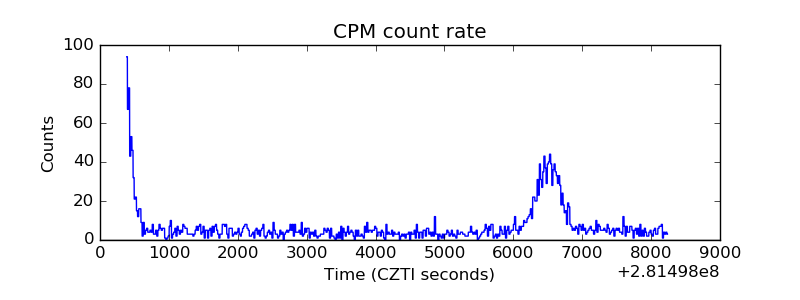 |
| CZT Counter | 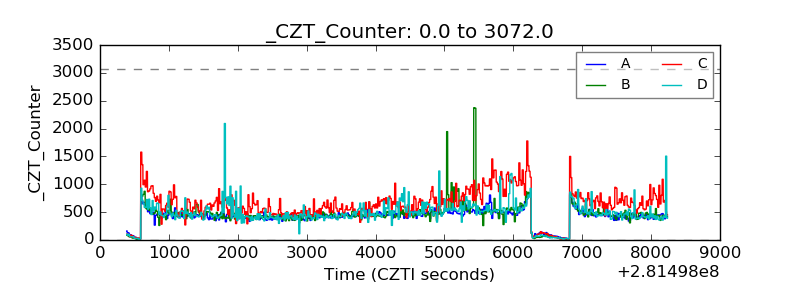 |
| +2.5 Volts monitor |  |
| +5 Volts monitor |  |
| _ROLL_ROT | 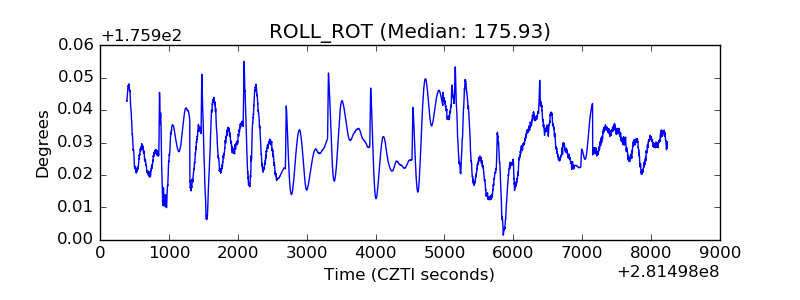 |
| _Roll_DEC | 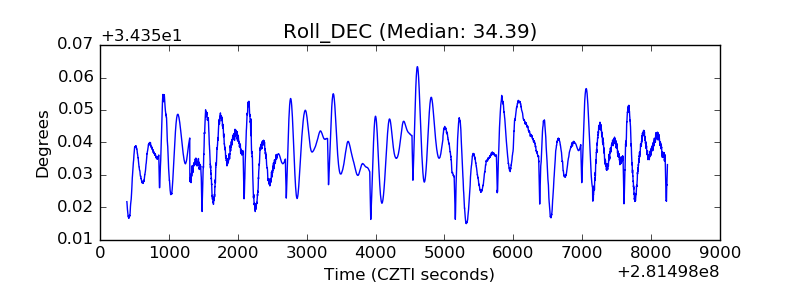 |
| _Roll_RA | 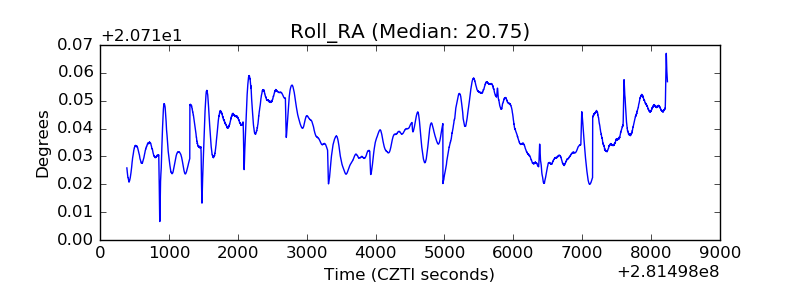 |
| Veto Counter | 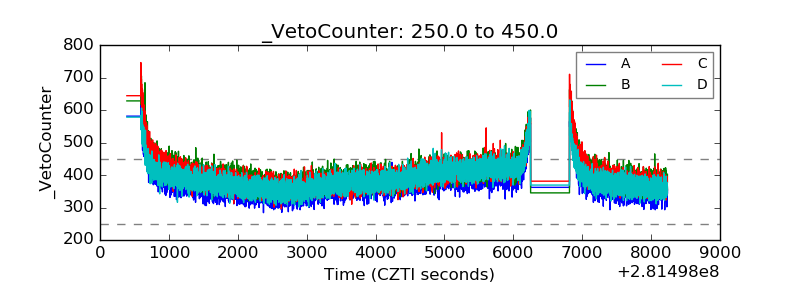 |