| Param | Original file | Final file |
|---|---|---|
| Filename | modeM0/AS1A05_185T04_9000002548_17200cztM0_level2.evt | modeM0/AS1A05_185T04_9000002548_17200cztM0_level2_quad_clean.evt |
| Size (bytes) | 660,067,200 | 98,032,320 |
| Size | 629.5 MB | 93.5 MB |
| Events in quadrant A | 3,989,898 | 619,481 |
| Events in quadrant B | 4,149,353 | 618,102 |
| Events in quadrant C | 5,871,735 | 584,780 |
| Events in quadrant D | 5,413,208 | 565,581 |
| Mode SS | |||
|---|---|---|---|
| Quadrant | BADHDUFLAG | Total packets | Discarded packets |
| A | 0 | 172 | 0 |
| B | 0 | 172 | 0 |
| C | 0 | 172 | 0 |
| D | 0 | 172 | 0 |
| Mode M9 | |||
|---|---|---|---|
| Quadrant | BADHDUFLAG | Total packets | Discarded packets |
| A | 0 | 8 | 0 |
| B | 0 | 8 | 0 |
| C | 0 | 8 | 0 |
| D | 0 | 8 | 0 |
| Mode M0 | |||
|---|---|---|---|
| Quadrant | BADHDUFLAG | Total packets | Discarded packets |
| A | 0 | 17416 | 2 |
| B | 0 | 17781 | 2 |
| C | 0 | 23192 | 2 |
| D | 0 | 21954 | 2 |
| Quadrant | Total seconds | Saturated seconds | Saturation percentage |
|---|---|---|---|
| A | 8349 | 141 | 1.688825% |
| B | 8349 | 200 | 2.395496% |
| C | 8349 | 337 | 4.036412% |
| D | 8349 | 587 | 7.030782% |
Noise dominated data is calculated using 1-second bins in cleaned event files. If a bin has >2000 counts, and if more than 50% of those come from <1% of pixels, then it is considered to be noise-dominated and hence unusable.
| Quadrant | # 1 sec bins | Bins with >0 counts | Bins with >2000 counts | High rate bins dominated by noise | Noise dominated (total time) | Noise dominated (detector-on time) | Marked lightcurve |
|---|---|---|---|---|---|---|---|
| A | 9159 | 8351 | 3 | 3 | 0.03% | 0.04% | 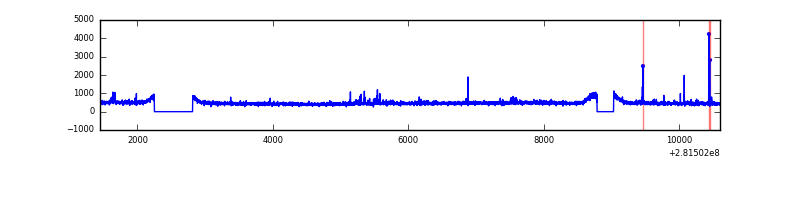 |
| B | 9159 | 8351 | 13 | 13 | 0.14% | 0.16% | 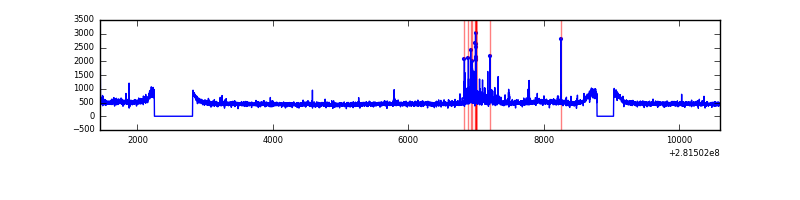 |
| C | 9159 | 8351 | 2 | 2 | 0.02% | 0.02% | 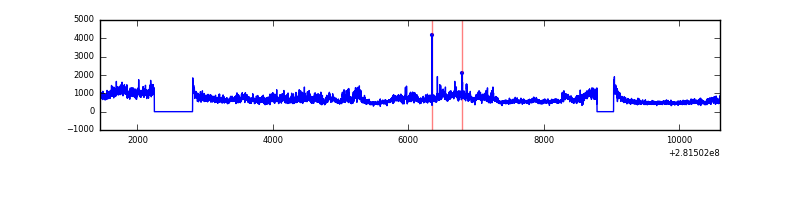 |
| D | 9159 | 8351 | 457 | 457 | 4.99% | 5.47% | 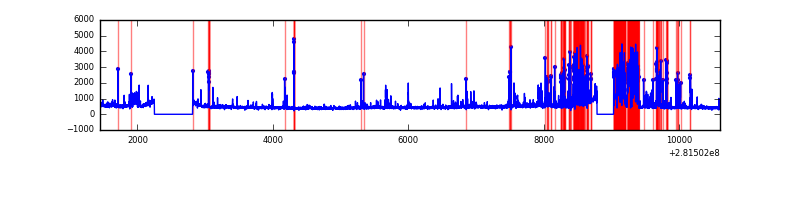 |
Top three noisy pixels from each quadrant. If the there are fewer than three noisy pixels in the level2.evt file, extra rows are filled as -1
| Pixel properties | Quadrant properties | ||||||
|---|---|---|---|---|---|---|---|
| Quadrant | DetID | PixID | Counts | Sigma | Mean | Median | Sigma |
| A | 4 | 2 | 61436 | 292.61 | 1013 | 989 | 206.6 |
| A | 12 | 189 | 35790 | 168.46 | 1013 | 989 | 206.6 |
| A | 0 | 226 | 8786 | 37.74 | 1013 | 989 | 206.6 |
| B | 7 | 220 | 127152 | 641.13 | 1015 | 989 | 196.8 |
| B | 12 | 111 | 23407 | 113.92 | 1015 | 989 | 196.8 |
| B | 11 | 111 | 19834 | 95.77 | 1015 | 989 | 196.8 |
| C | 3 | 233 | 1937975 | 8493.38 | 968 | 974 | 228.1 |
| C | 14 | 238 | 148536 | 647.03 | 968 | 974 | 228.1 |
| C | 0 | 207 | 9006 | 35.22 | 968 | 974 | 228.1 |
| D | 11 | 176 | 1221078 | 5279.57 | 950 | 921 | 231.1 |
| D | 13 | 189 | 153639 | 660.8 | 950 | 921 | 231.1 |
| D | 5 | 222 | 145790 | 626.84 | 950 | 921 | 231.1 |
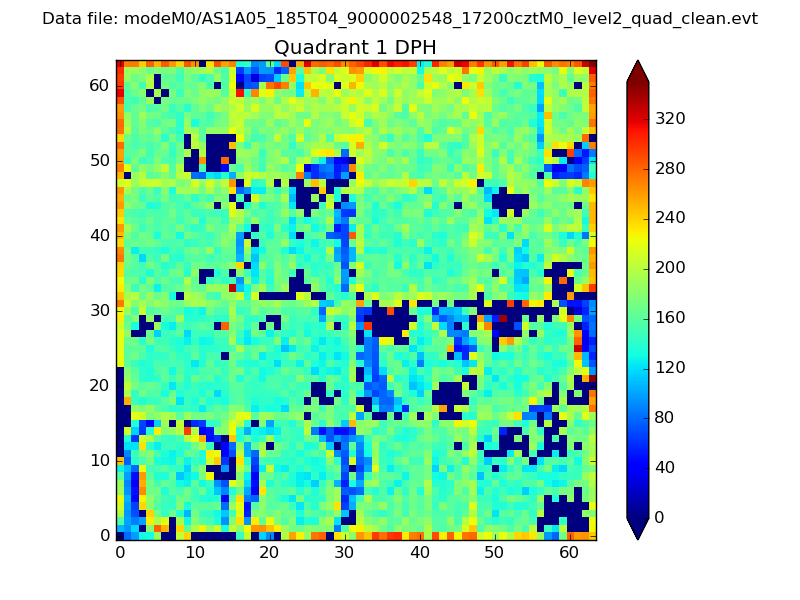
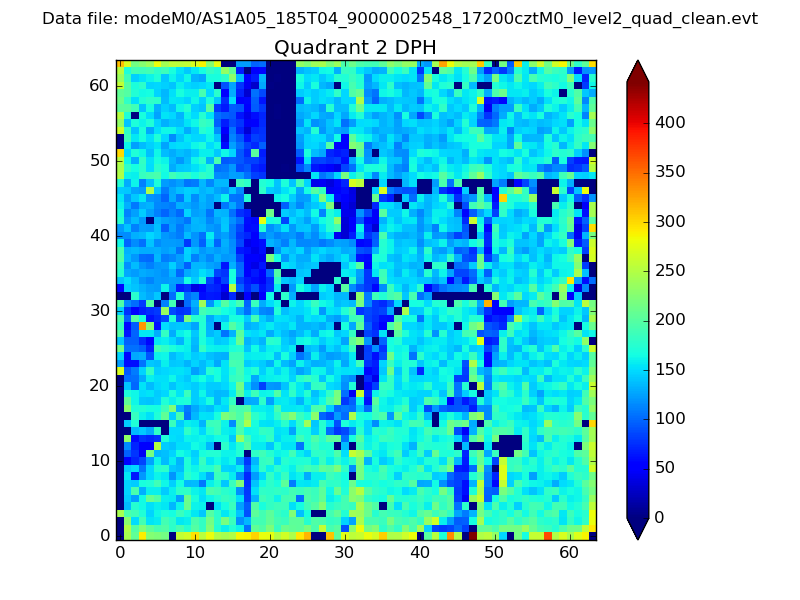
Histogram calculated using DETX and DETY for each event in the final _common_clean file
| Quadrant A |  |
 |
Quadrant B |
|---|---|---|---|
| Quadrant D |  |
 |
Quadrant C |
| Plot type | Count rate plots | Images |
|---|---|---|
| Comparison with Poisson distribution Blue bars denote a histogram of data divided into 1 sec bins. Red curve is a Poisson curve with rate = median count rate of data. |
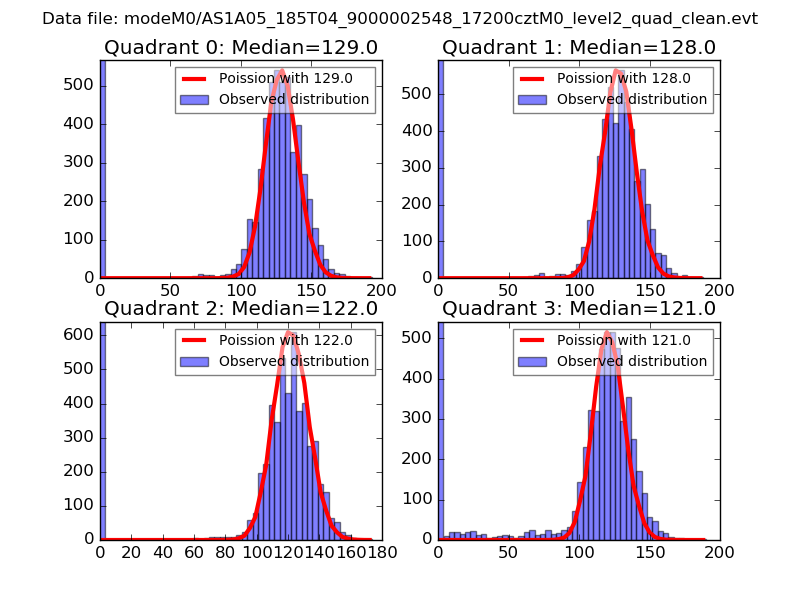 |
 |
| Quadrant-wise count rates Data is divided into 100 sec bins |
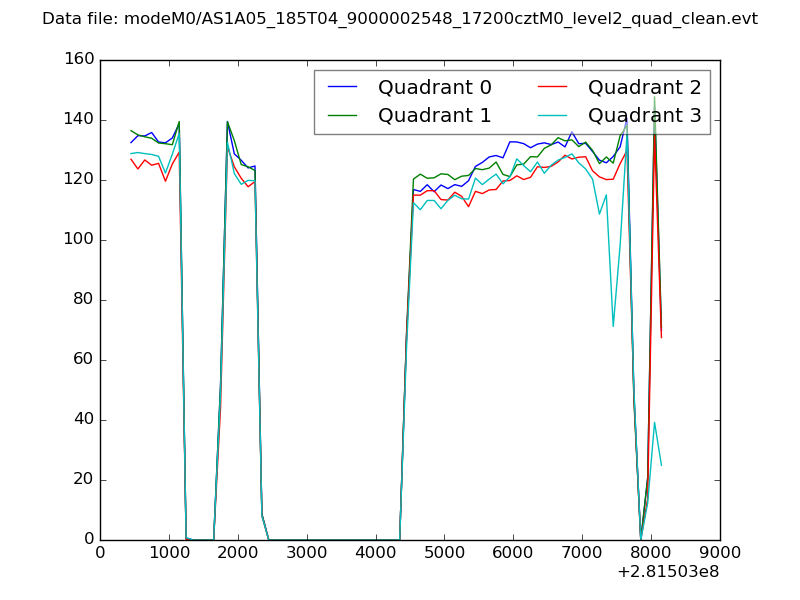 |
|
| Module-wise count rates for Quadrant A Data is divided into 100 sec bins |
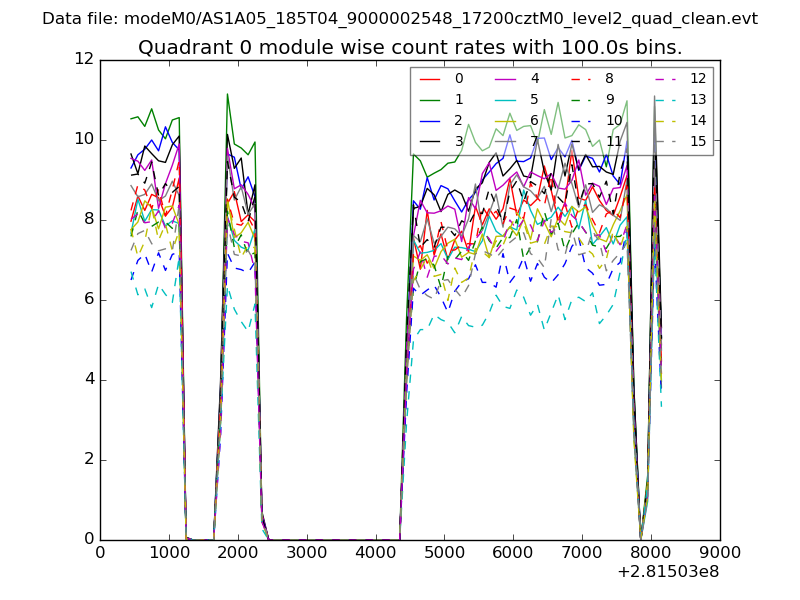 |
 |
| Module-wise count rates for Quadrant B Data is divided into 100 sec bins |
 |
 |
| Module-wise count rates for Quadrant C Data is divided into 100 sec bins |
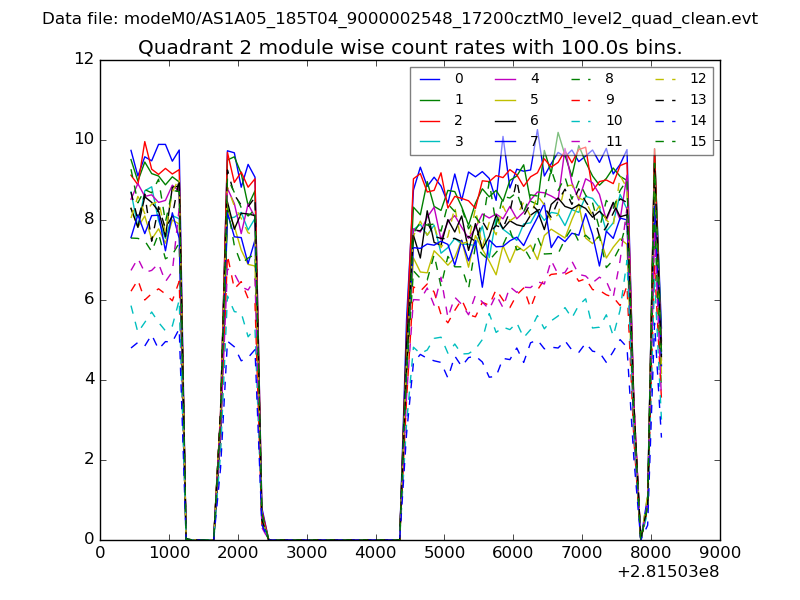 |
 |
| Module-wise count rates for Quadrant D Data is divided into 100 sec bins |
 |
 |
| Parameter | Plot |
|---|---|
| CZT HV Monitor | 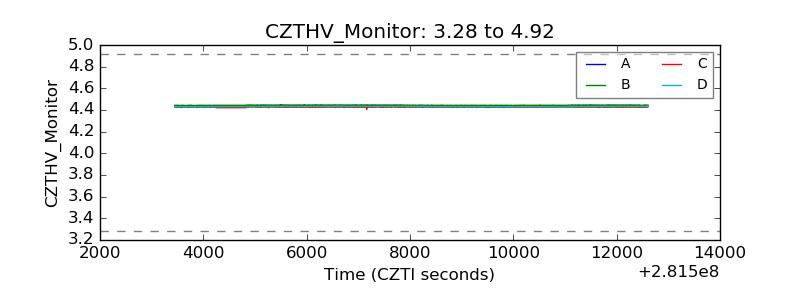 |
| D_VDD | 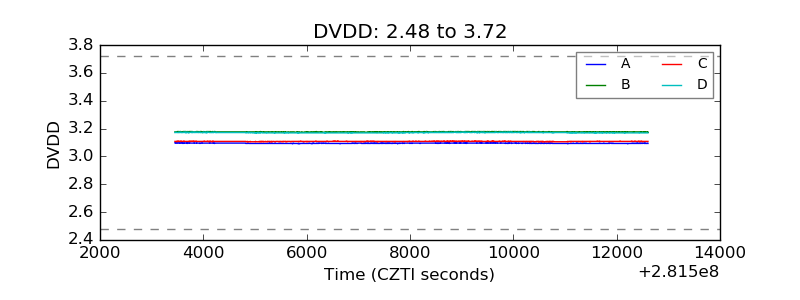 |
| Temperature 1 | 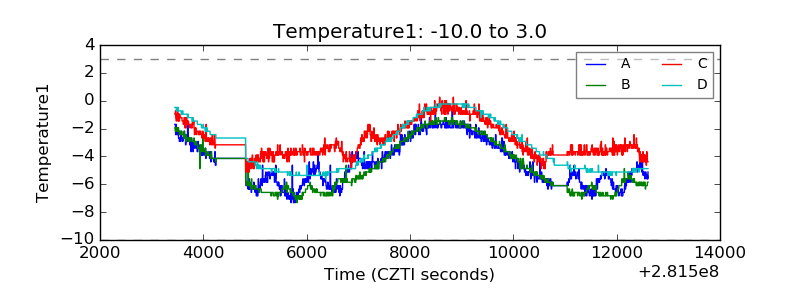 |
| Veto HV Monitor | 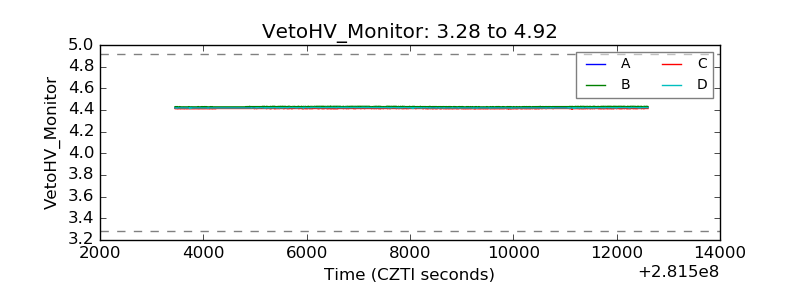 |
| Veto LLD |  |
| Alpha Counter | 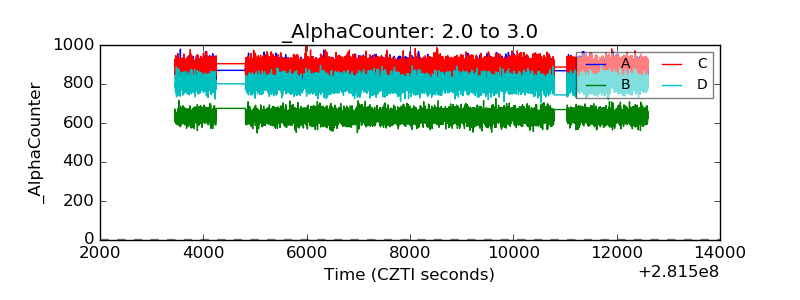 |
| _CPM_Rate | 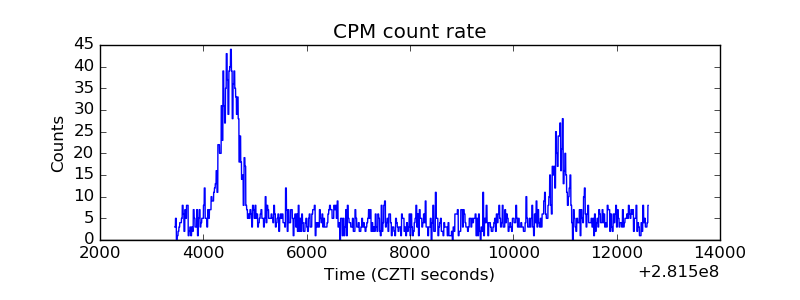 |
| CZT Counter |  |
| +2.5 Volts monitor | 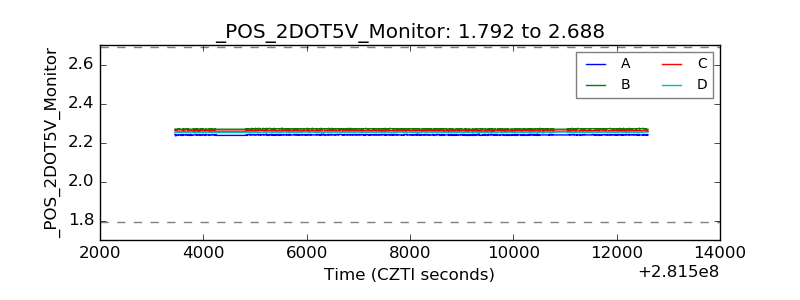 |
| +5 Volts monitor |  |
| _ROLL_ROT | 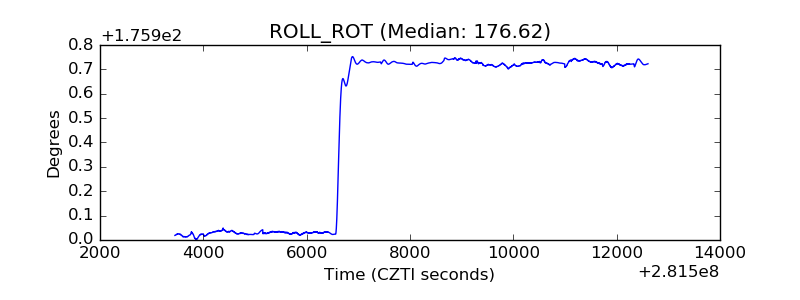 |
| _Roll_DEC | 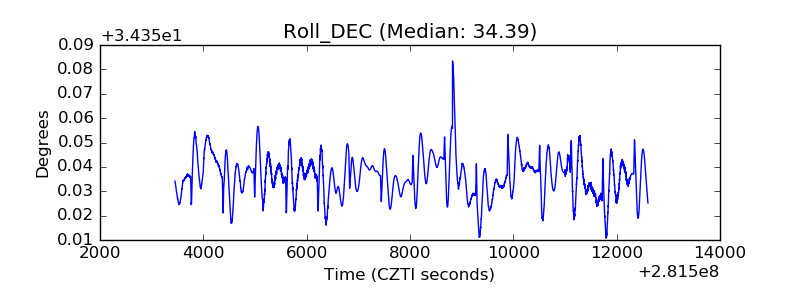 |
| _Roll_RA | 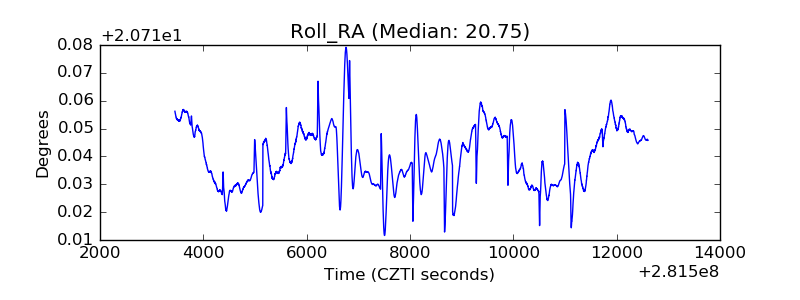 |
| Veto Counter |  |