| Param | Original file | Final file |
|---|---|---|
| Filename | modeM0/AS1A05_185T04_9000002548_17204cztM0_level2.evt | modeM0/AS1A05_185T04_9000002548_17204cztM0_level2_quad_clean.evt |
| Size (bytes) | 1,343,062,080 | 238,633,920 |
| Size | 1.3 GB | 227.6 MB |
| Events in quadrant A | 8,781,286 | 1,523,580 |
| Events in quadrant B | 9,207,171 | 1,522,600 |
| Events in quadrant C | 9,374,011 | 1,456,629 |
| Events in quadrant D | 12,042,346 | 1,430,300 |
| Mode SS | |||
|---|---|---|---|
| Quadrant | BADHDUFLAG | Total packets | Discarded packets |
| A | 0 | 384 | 0 |
| B | 0 | 384 | 0 |
| C | 0 | 384 | 0 |
| D | 0 | 384 | 0 |
| Mode M9 | |||
|---|---|---|---|
| Quadrant | BADHDUFLAG | Total packets | Discarded packets |
| A | 0 | 22 | 0 |
| B | 0 | 22 | 0 |
| C | 0 | 22 | 0 |
| D | 0 | 22 | 0 |
| Mode M0 | |||
|---|---|---|---|
| Quadrant | BADHDUFLAG | Total packets | Discarded packets |
| A | 0 | 38478 | 4 |
| B | 0 | 39367 | 4 |
| C | 0 | 39437 | 4 |
| D | 0 | 48381 | 4 |
| Quadrant | Total seconds | Saturated seconds | Saturation percentage |
|---|---|---|---|
| A | 18784 | 310 | 1.650341% |
| B | 18784 | 377 | 2.007027% |
| C | 18784 | 375 | 1.996380% |
| D | 18784 | 792 | 4.216354% |
Noise dominated data is calculated using 1-second bins in cleaned event files. If a bin has >2000 counts, and if more than 50% of those come from <1% of pixels, then it is considered to be noise-dominated and hence unusable.
| Quadrant | # 1 sec bins | Bins with >0 counts | Bins with >2000 counts | High rate bins dominated by noise | Noise dominated (total time) | Noise dominated (detector-on time) | Marked lightcurve |
|---|---|---|---|---|---|---|---|
| A | 21019 | 18787 | 0 | 0 | 0.00% | 0.00% |  |
| B | 21019 | 18787 | 19 | 19 | 0.09% | 0.10% | 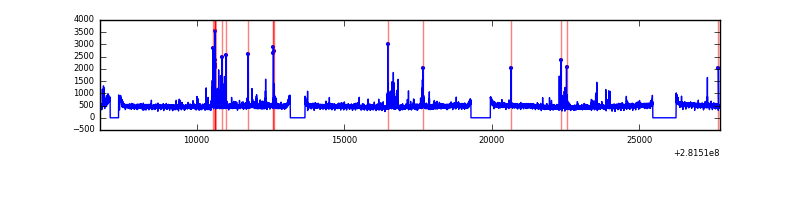 |
| C | 21019 | 18787 | 0 | 0 | 0.00% | 0.00% | 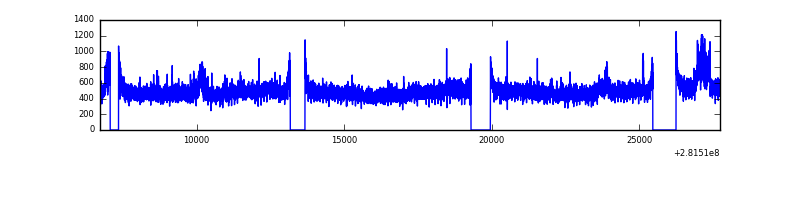 |
| D | 21019 | 18787 | 438 | 438 | 2.08% | 2.33% | 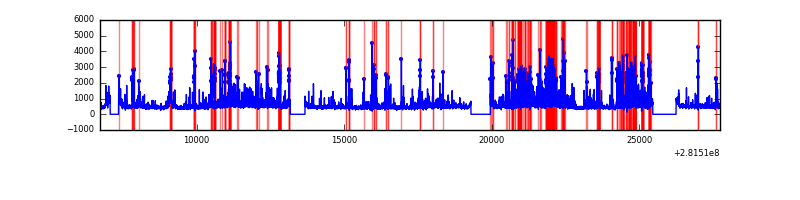 |
Top three noisy pixels from each quadrant. If the there are fewer than three noisy pixels in the level2.evt file, extra rows are filled as -1
| Pixel properties | Quadrant properties | ||||||
|---|---|---|---|---|---|---|---|
| Quadrant | DetID | PixID | Counts | Sigma | Mean | Median | Sigma |
| A | 12 | 189 | 115096 | 247.81 | 2249 | 2195 | 455.6 |
| A | 4 | 2 | 20956 | 41.18 | 2249 | 2195 | 455.6 |
| A | 0 | 226 | 19891 | 38.84 | 2249 | 2195 | 455.6 |
| B | 7 | 220 | 218312 | 501.77 | 2242 | 2179 | 430.7 |
| B | 0 | 197 | 69636 | 156.61 | 2242 | 2179 | 430.7 |
| B | 12 | 111 | 52437 | 116.68 | 2242 | 2179 | 430.7 |
| C | 3 | 233 | 631531 | 1250.56 | 2151 | 2159 | 503.3 |
| C | 14 | 238 | 329129 | 649.69 | 2151 | 2159 | 503.3 |
| C | 13 | 61 | 15514 | 26.54 | 2151 | 2159 | 503.3 |
| D | 5 | 222 | 2481308 | 4742.86 | 2166 | 2102 | 522.7 |
| D | 13 | 189 | 487994 | 929.54 | 2166 | 2102 | 522.7 |
| D | 11 | 176 | 415695 | 791.23 | 2166 | 2102 | 522.7 |
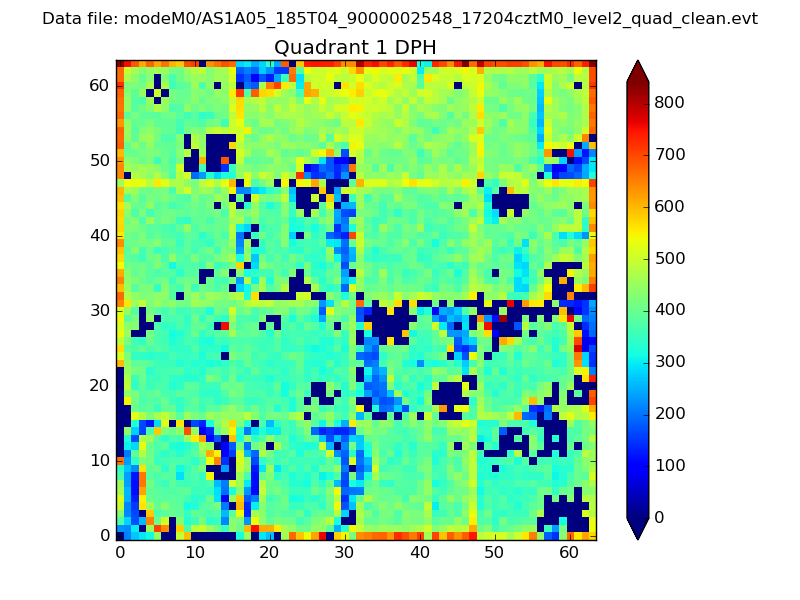
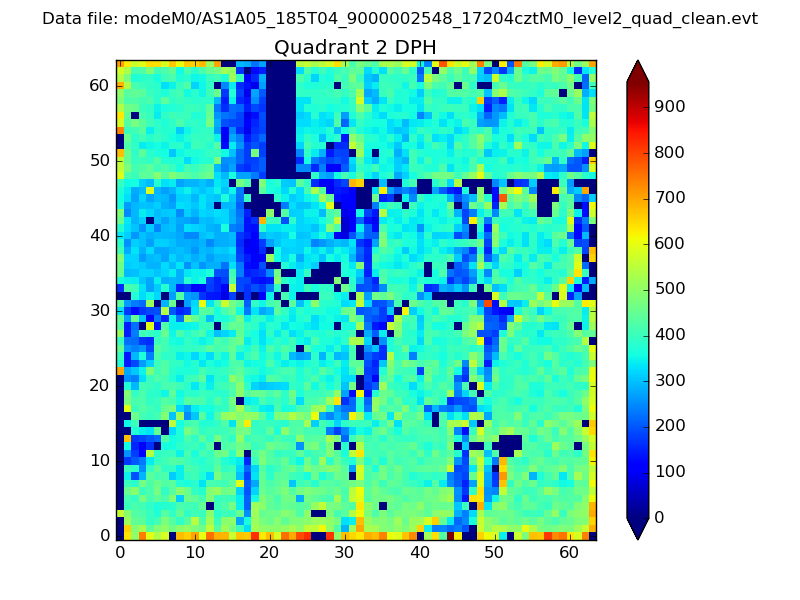
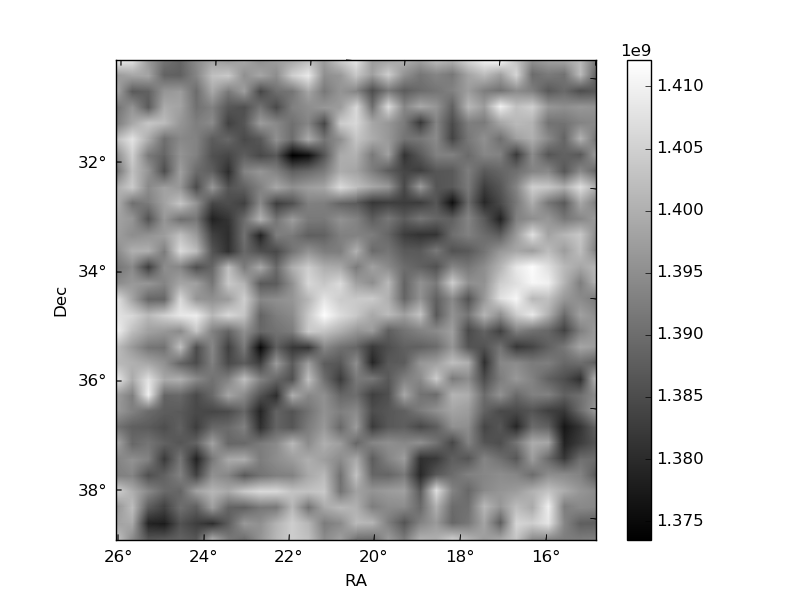
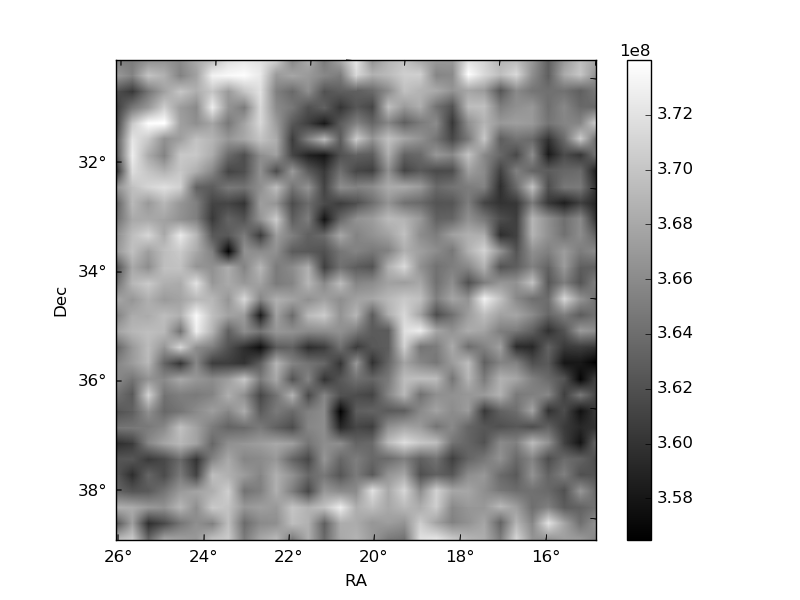
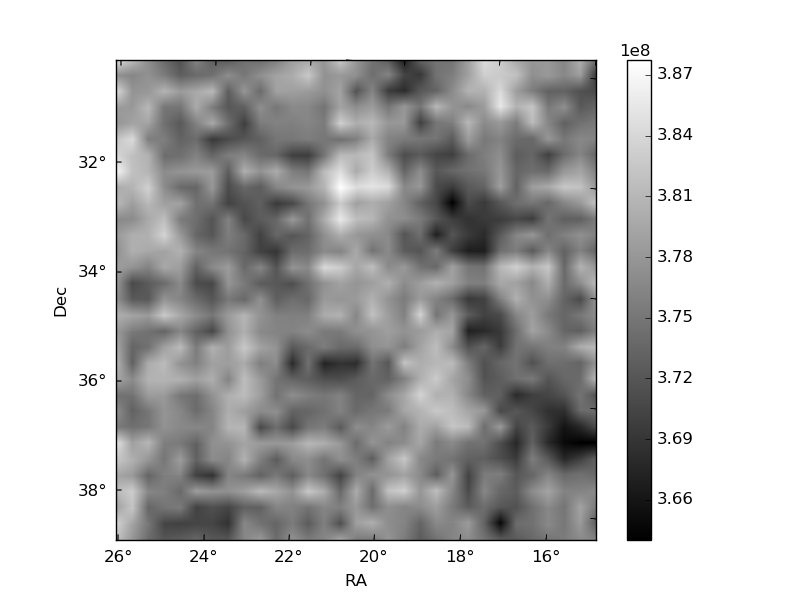
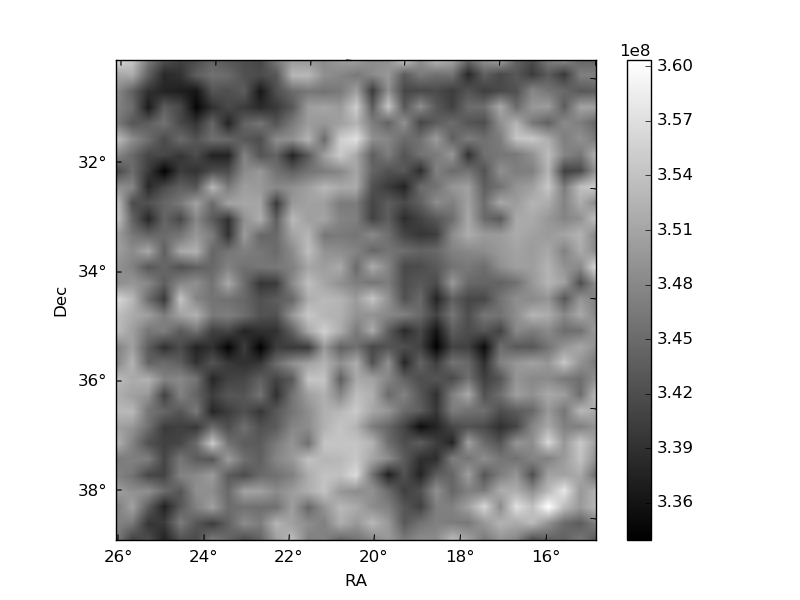
Histogram calculated using DETX and DETY for each event in the final _common_clean file
| Quadrant A | 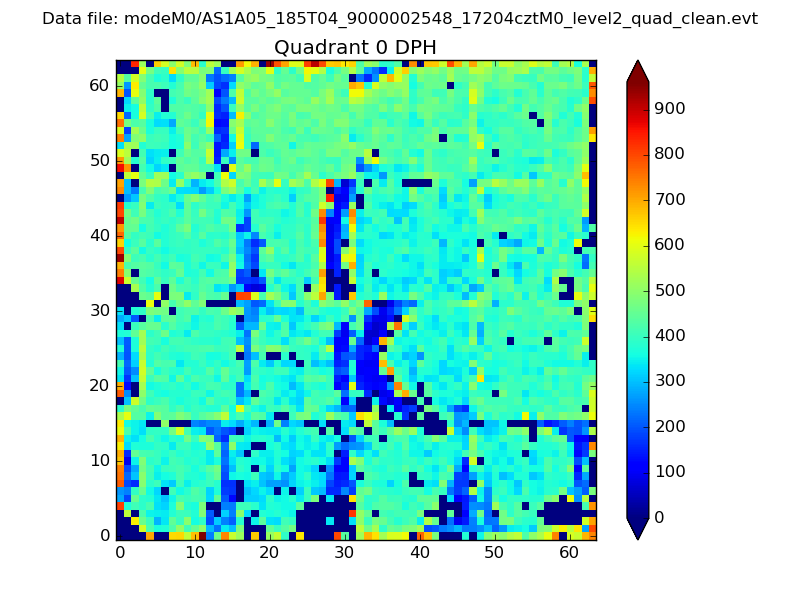 |
 |
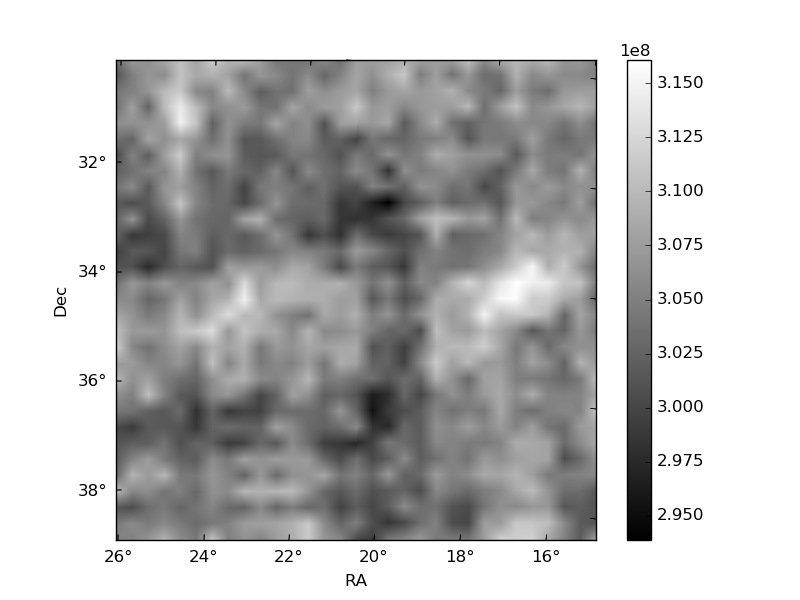
Quadrant B |
|---|---|---|---|
| Quadrant D | 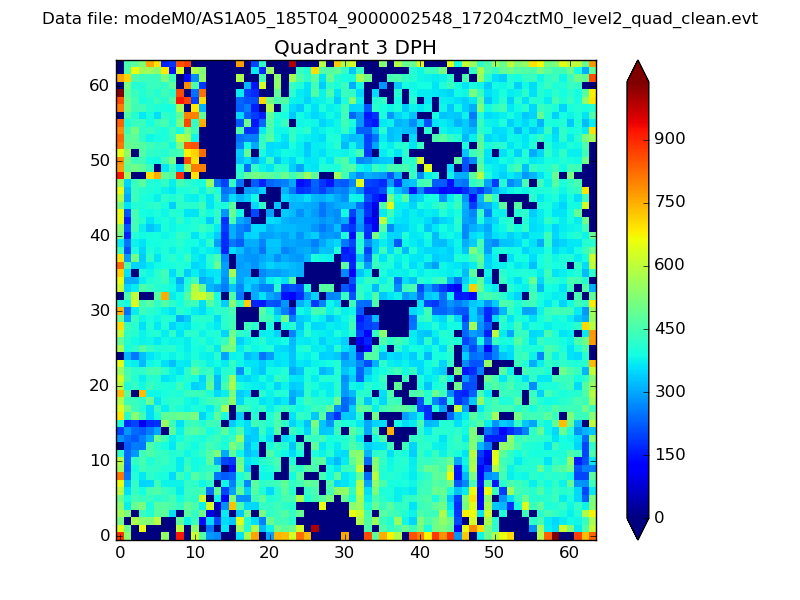 |
 |
Quadrant C |
| Plot type | Count rate plots | Images |
|---|---|---|
| Comparison with Poisson distribution Blue bars denote a histogram of data divided into 1 sec bins. Red curve is a Poisson curve with rate = median count rate of data. |
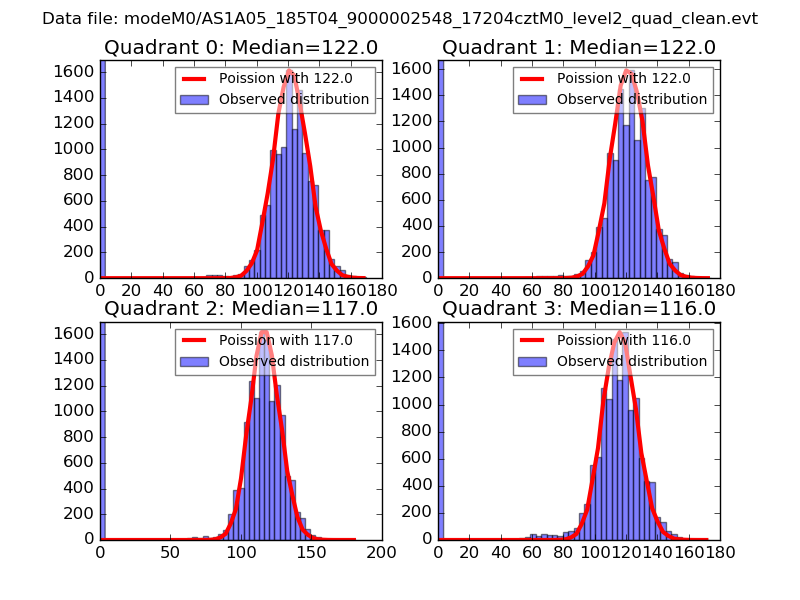 |
 |
| Quadrant-wise count rates Data is divided into 100 sec bins |
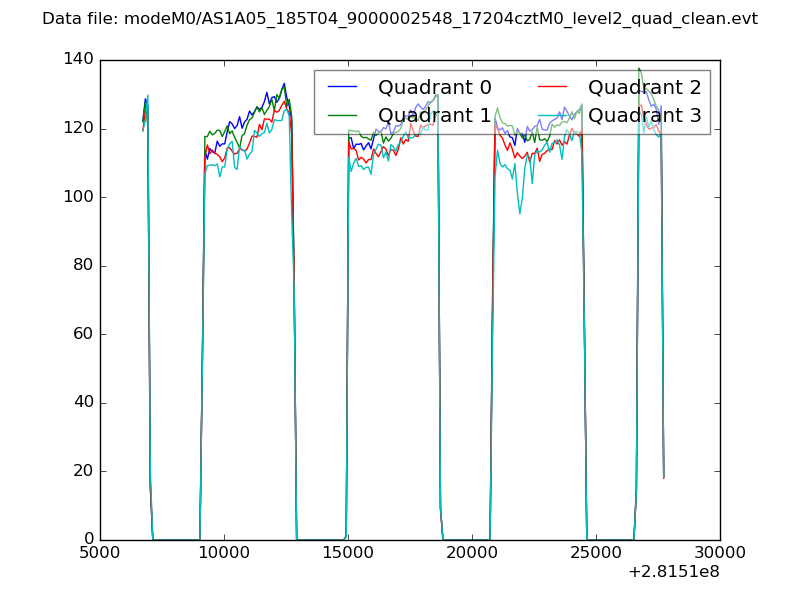 |
|
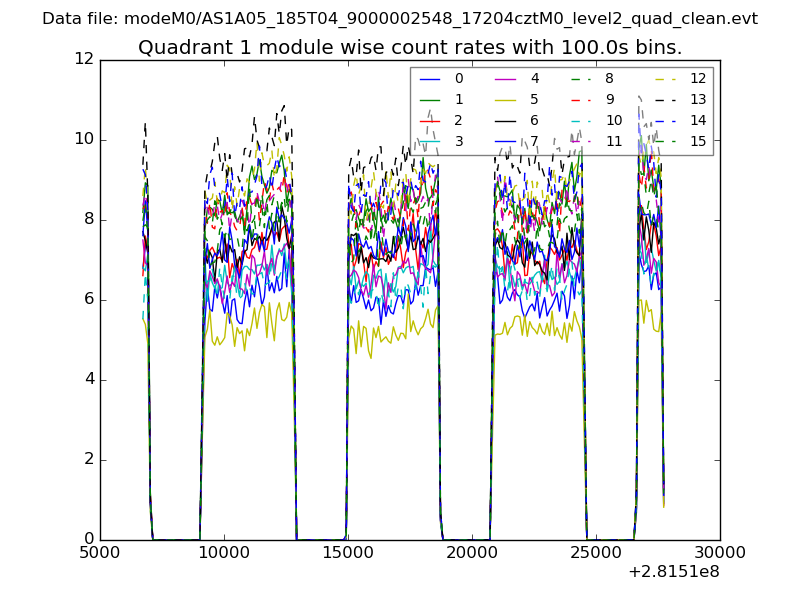
| Module-wise count rates for Quadrant A Data is divided into 100 sec bins |
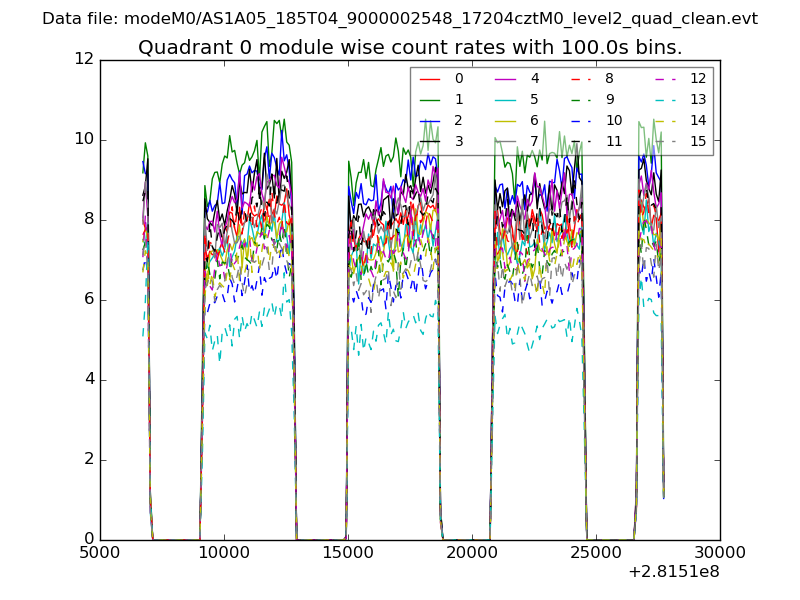 |
 |
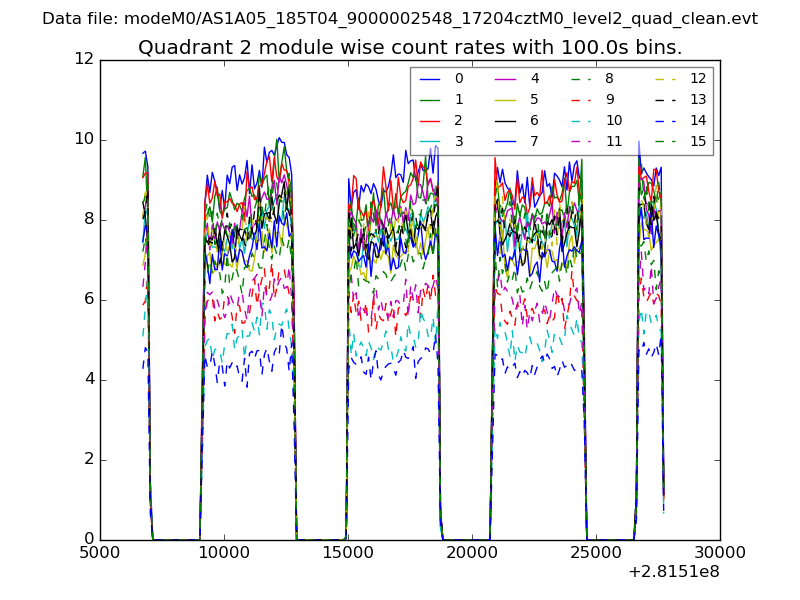
| Module-wise count rates for Quadrant B Data is divided into 100 sec bins |
 |
 |
| Module-wise count rates for Quadrant C Data is divided into 100 sec bins |
 |
 |
| Module-wise count rates for Quadrant D Data is divided into 100 sec bins |
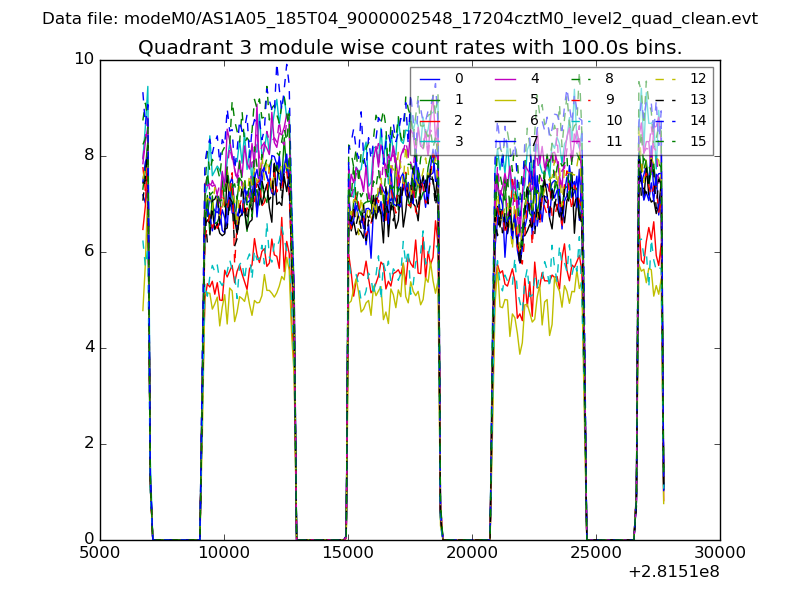 |
 |
| Parameter | Plot |
|---|---|
| CZT HV Monitor | 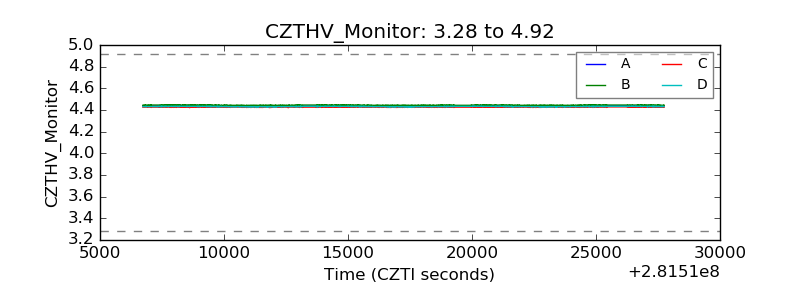 |
| D_VDD | 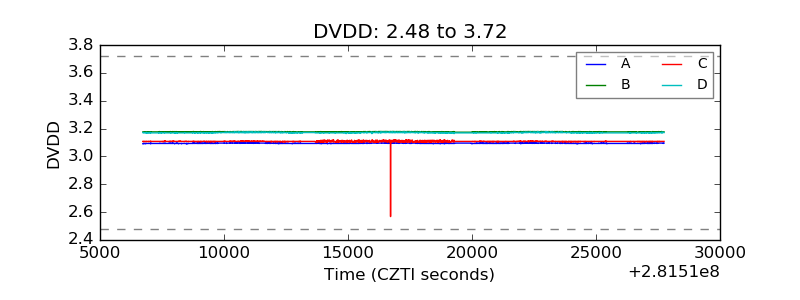 |
| Temperature 1 | 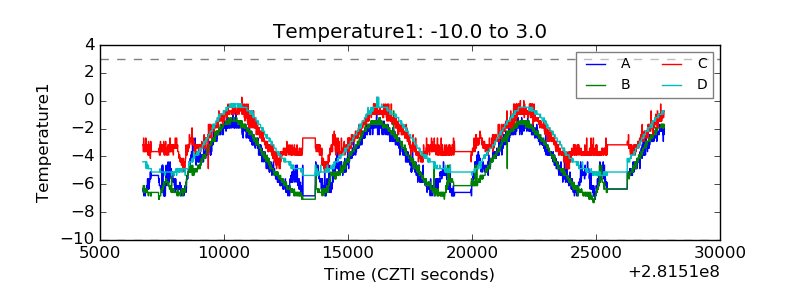 |
| Veto HV Monitor |  |
| Veto LLD | 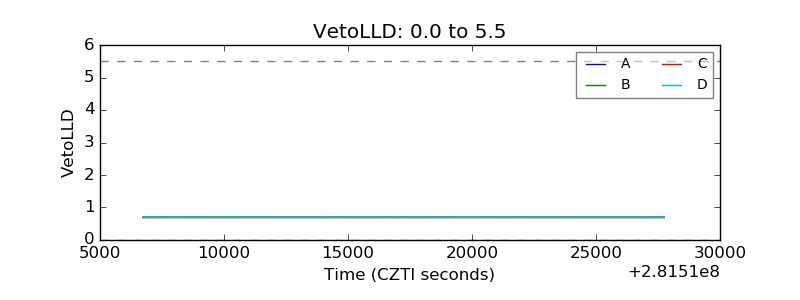 |
| Alpha Counter | 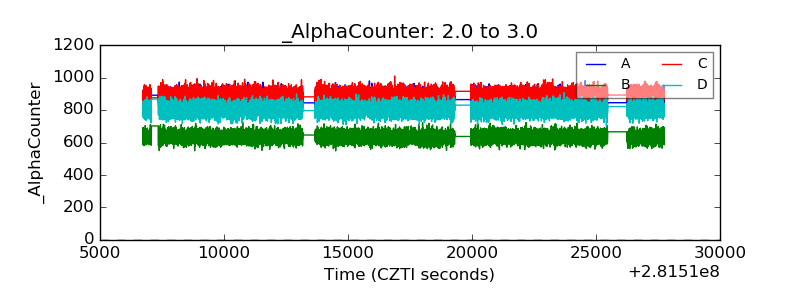 |
| _CPM_Rate | 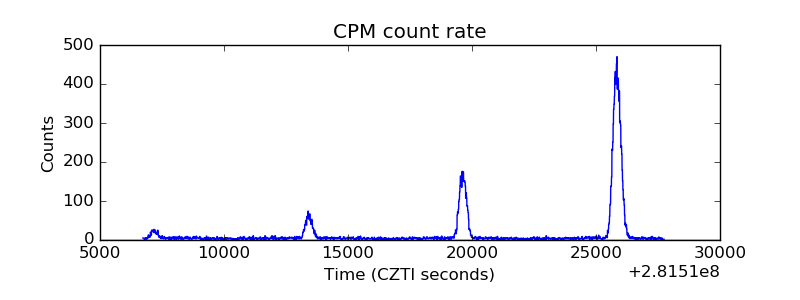 |
| CZT Counter | 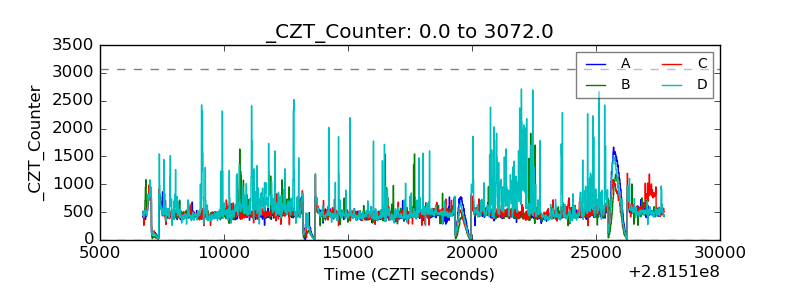 |
| +2.5 Volts monitor |  |
| +5 Volts monitor |  |
| _ROLL_ROT | 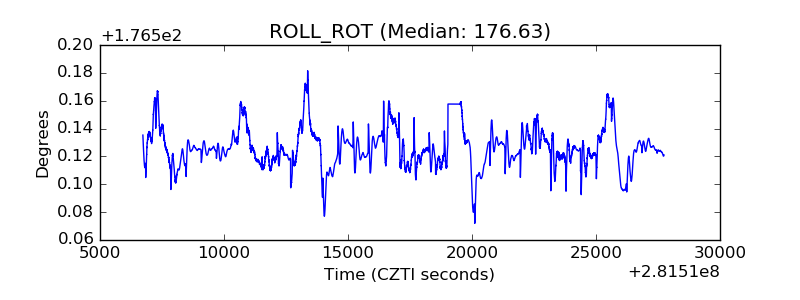 |
| _Roll_DEC | 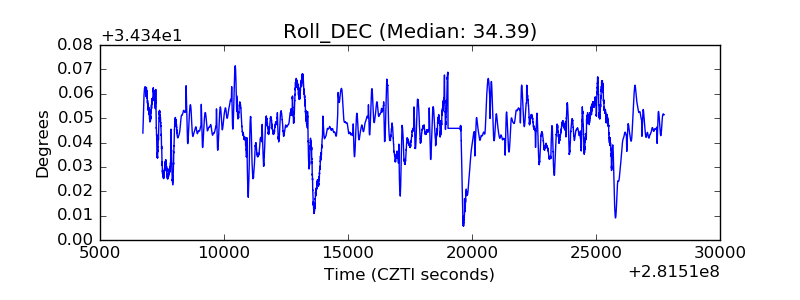 |
| _Roll_RA | 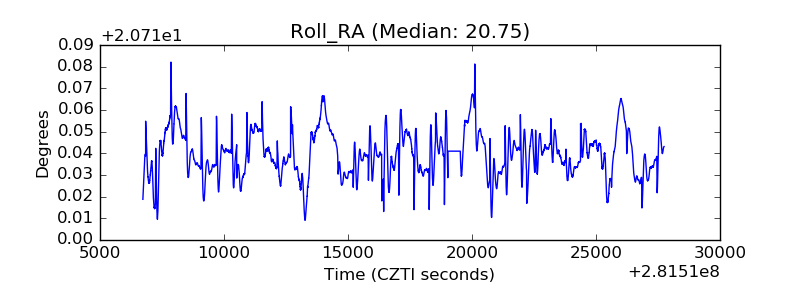 |
| Veto Counter | 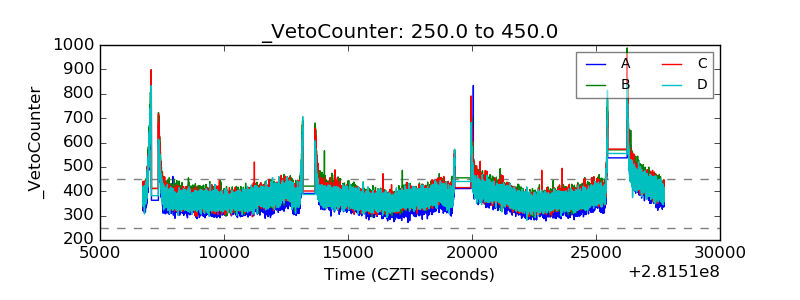 |