| Param | Original file | Final file |
|---|---|---|
| Filename | modeM0/AS1A05_185T04_9000002548_17207cztM0_level2.evt | modeM0/AS1A05_185T04_9000002548_17207cztM0_level2_quad_clean.evt |
| Size (bytes) | 478,347,840 | 101,364,480 |
| Size | 456.2 MB | 96.7 MB |
| Events in quadrant A | 3,106,940 | 681,326 |
| Events in quadrant B | 3,280,565 | 675,021 |
| Events in quadrant C | 3,591,612 | 634,208 |
| Events in quadrant D | 4,071,672 | 631,172 |
| Mode SS | |||
|---|---|---|---|
| Quadrant | BADHDUFLAG | Total packets | Discarded packets |
| A | 0 | 130 | 0 |
| B | 0 | 130 | 0 |
| C | 0 | 130 | 0 |
| D | 0 | 130 | 0 |
| Mode M9 | |||
|---|---|---|---|
| Quadrant | BADHDUFLAG | Total packets | Discarded packets |
| A | 0 | 11 | 0 |
| B | 0 | 11 | 0 |
| C | 0 | 11 | 0 |
| D | 0 | 11 | 0 |
| Mode M0 | |||
|---|---|---|---|
| Quadrant | BADHDUFLAG | Total packets | Discarded packets |
| A | 0 | 13442 | 1 |
| B | 0 | 13950 | 1 |
| C | 0 | 14749 | 1 |
| D | 0 | 16356 | 1 |
| Quadrant | Total seconds | Saturated seconds | Saturation percentage |
|---|---|---|---|
| A | 6424 | 48 | 0.747198% |
| B | 6425 | 52 | 0.809339% |
| C | 6425 | 68 | 1.058366% |
| D | 6425 | 199 | 3.097276% |
Noise dominated data is calculated using 1-second bins in cleaned event files. If a bin has >2000 counts, and if more than 50% of those come from <1% of pixels, then it is considered to be noise-dominated and hence unusable.
| Quadrant | # 1 sec bins | Bins with >0 counts | Bins with >2000 counts | High rate bins dominated by noise | Noise dominated (total time) | Noise dominated (detector-on time) | Marked lightcurve |
|---|---|---|---|---|---|---|---|
| A | 7520 | 6425 | 0 | 0 | 0.00% | 0.00% | 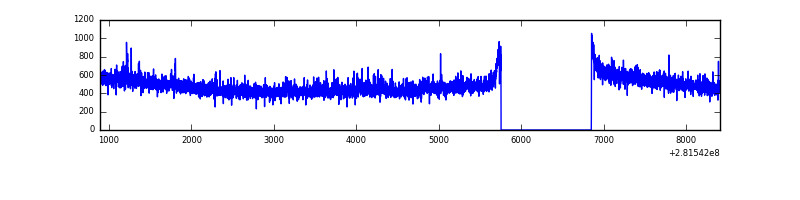 |
| B | 7521 | 6426 | 7 | 7 | 0.09% | 0.11% | 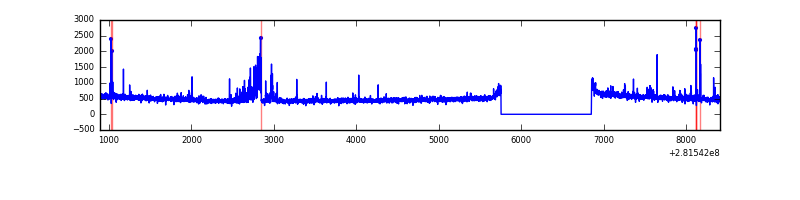 |
| C | 7521 | 6426 | 0 | 0 | 0.00% | 0.00% | 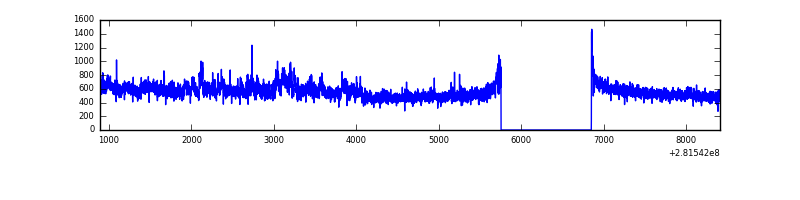 |
| D | 7521 | 6425 | 138 | 138 | 1.83% | 2.15% | 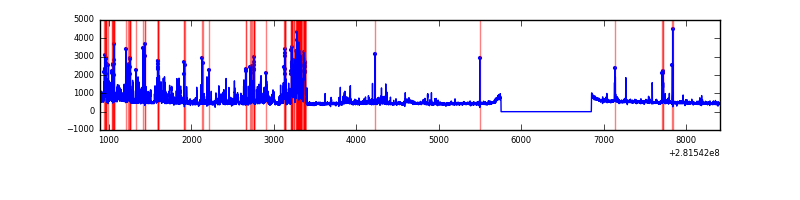 |
Top three noisy pixels from each quadrant. If the there are fewer than three noisy pixels in the level2.evt file, extra rows are filled as -1
| Pixel properties | Quadrant properties | ||||||
|---|---|---|---|---|---|---|---|
| Quadrant | DetID | PixID | Counts | Sigma | Mean | Median | Sigma |
| A | 12 | 189 | 49477 | 304.11 | 795 | 778 | 160.1 |
| A | 0 | 226 | 7236 | 40.33 | 795 | 778 | 160.1 |
| A | 12 | 194 | 5955 | 32.33 | 795 | 778 | 160.1 |
| B | 0 | 189 | 105585 | 704.25 | 786 | 767 | 148.8 |
| B | 0 | 197 | 27902 | 182.31 | 786 | 767 | 148.8 |
| B | 7 | 220 | 24726 | 160.97 | 786 | 767 | 148.8 |
| C | 3 | 233 | 541201 | 3073.4 | 752 | 756 | 175.8 |
| C | 14 | 238 | 115356 | 651.71 | 752 | 756 | 175.8 |
| C | 13 | 61 | 5357 | 26.16 | 752 | 756 | 175.8 |
| D | 5 | 222 | 602709 | 3239.52 | 768 | 747 | 185.8 |
| D | 11 | 176 | 304600 | 1635.22 | 768 | 747 | 185.8 |
| D | 13 | 189 | 152961 | 819.16 | 768 | 747 | 185.8 |
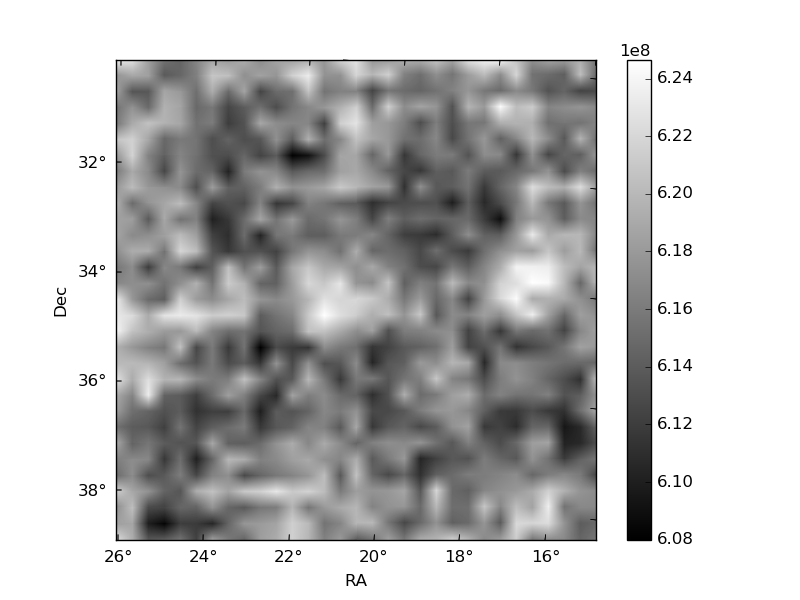
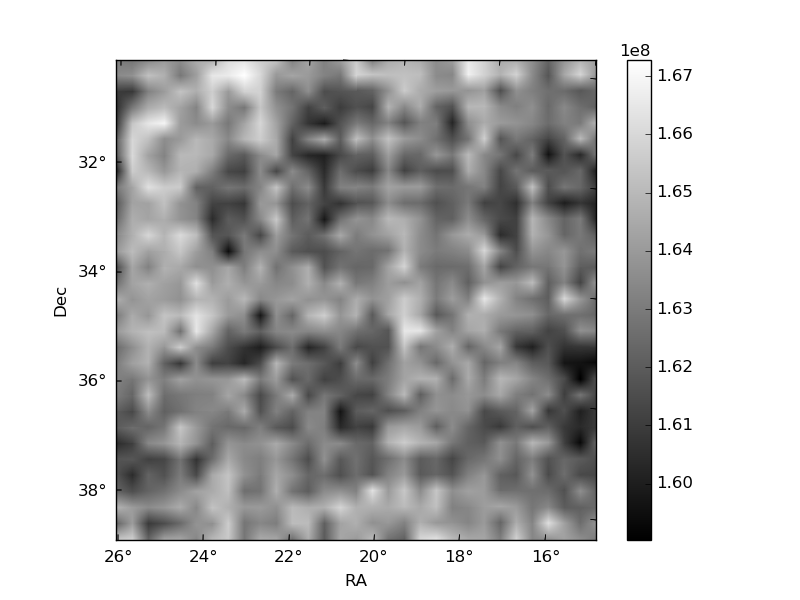
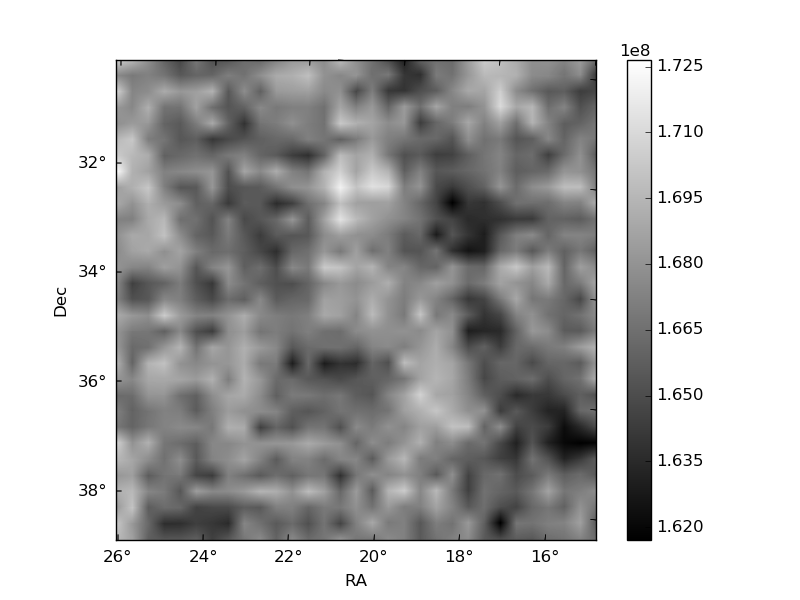
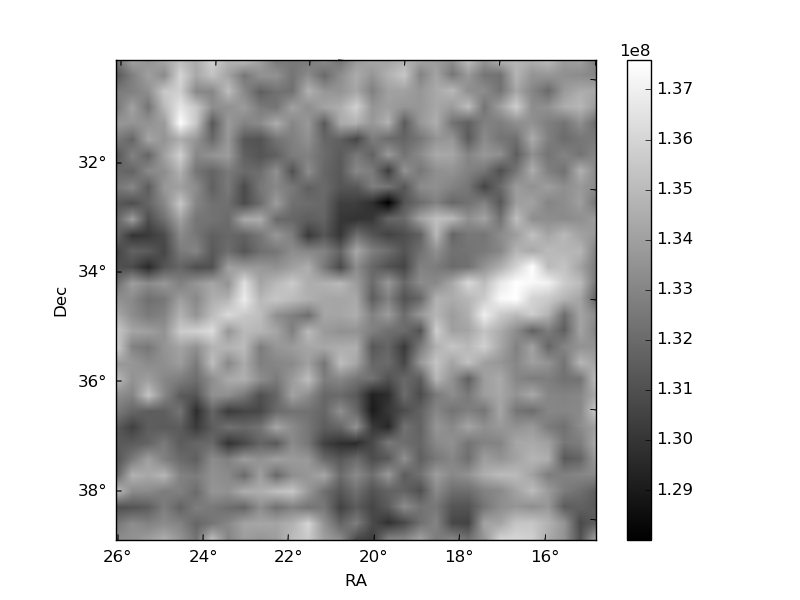
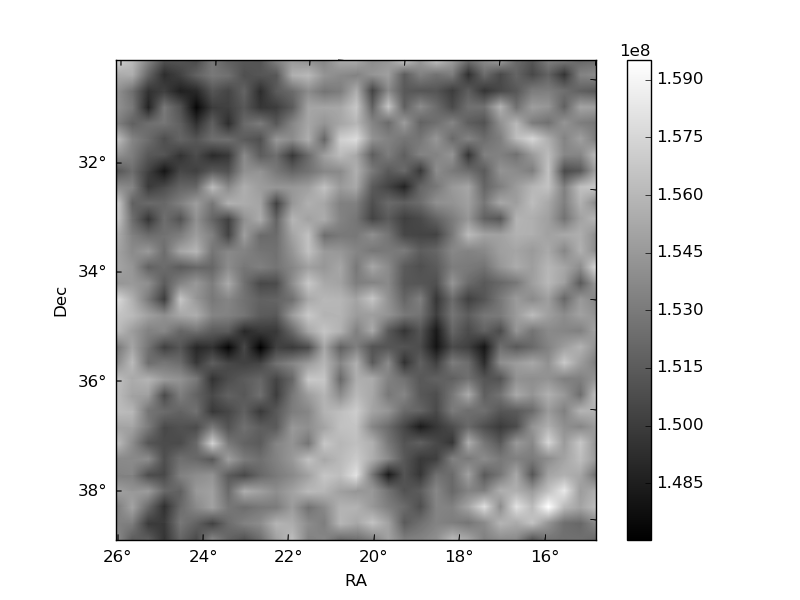
Histogram calculated using DETX and DETY for each event in the final _common_clean file
| Quadrant A | 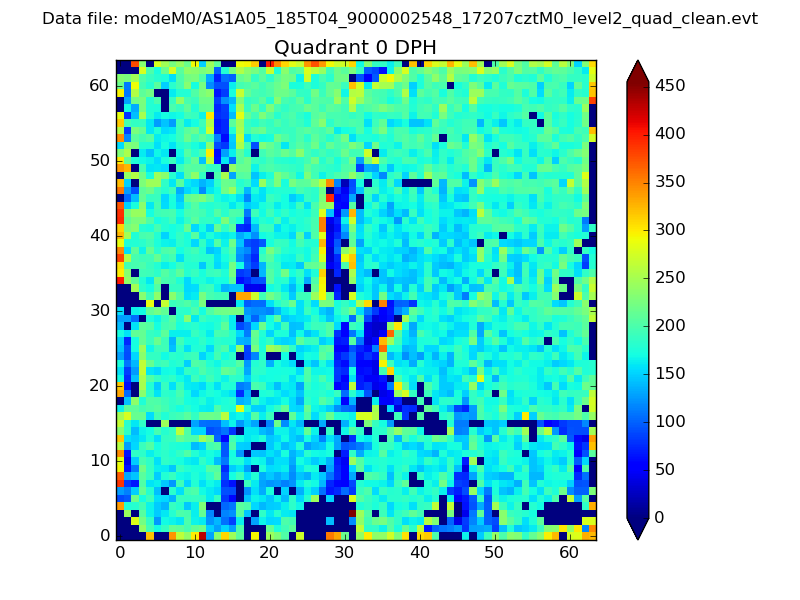 |
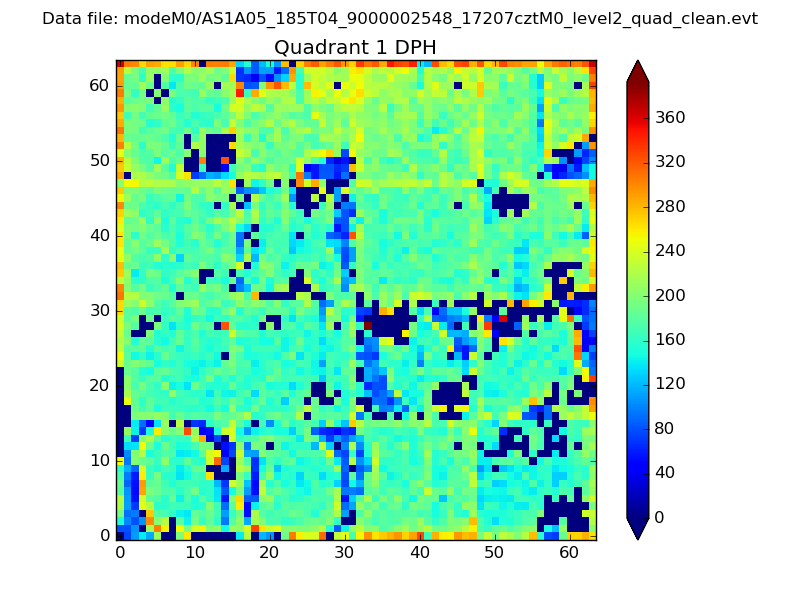 |
Quadrant B |
|---|---|---|---|
| Quadrant D | 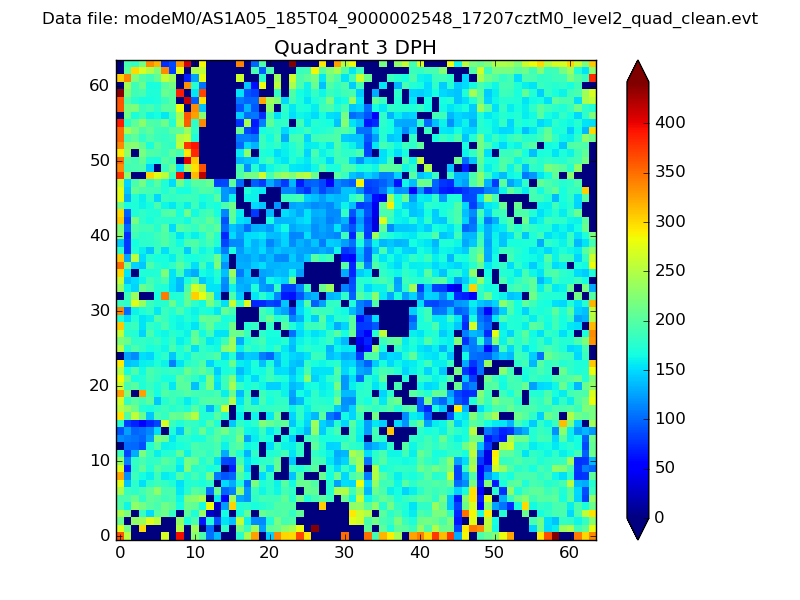 |
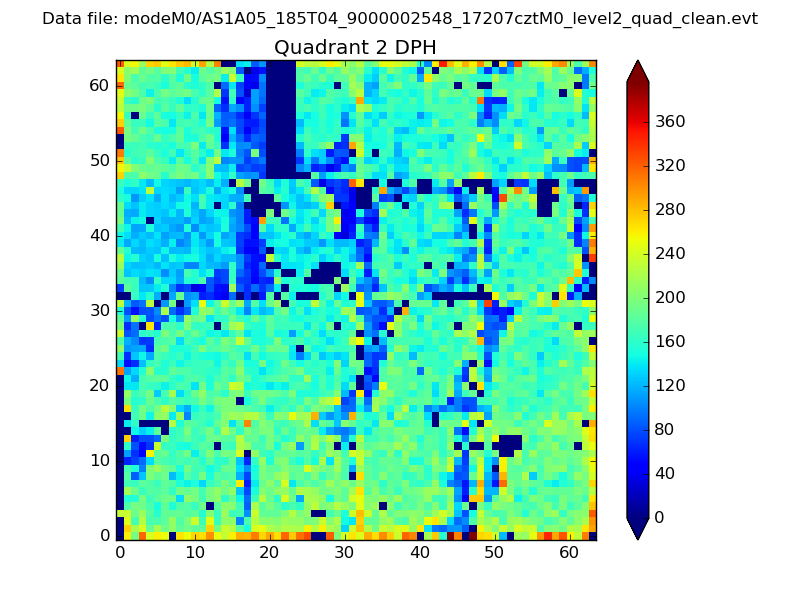 |
Quadrant C |
| Plot type | Count rate plots | Images |
|---|---|---|
| Comparison with Poisson distribution Blue bars denote a histogram of data divided into 1 sec bins. Red curve is a Poisson curve with rate = median count rate of data. |
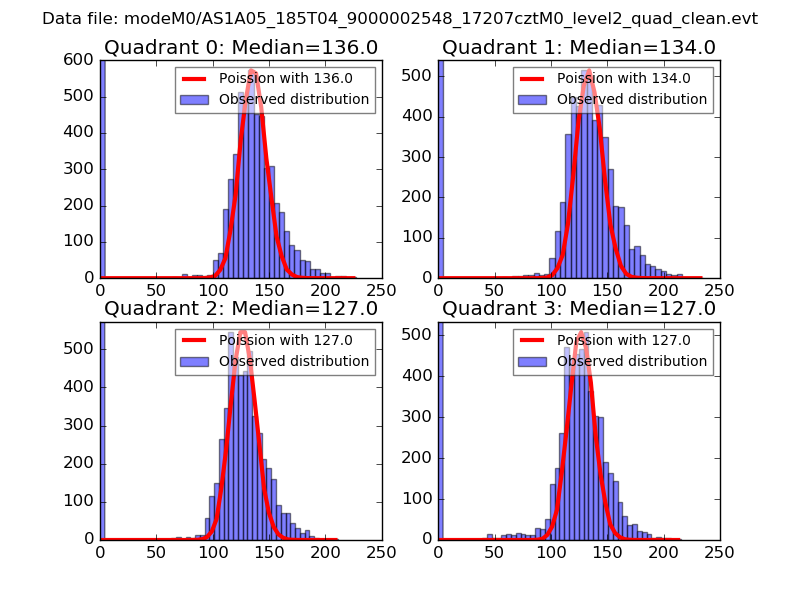 |
 |
| Quadrant-wise count rates Data is divided into 100 sec bins |
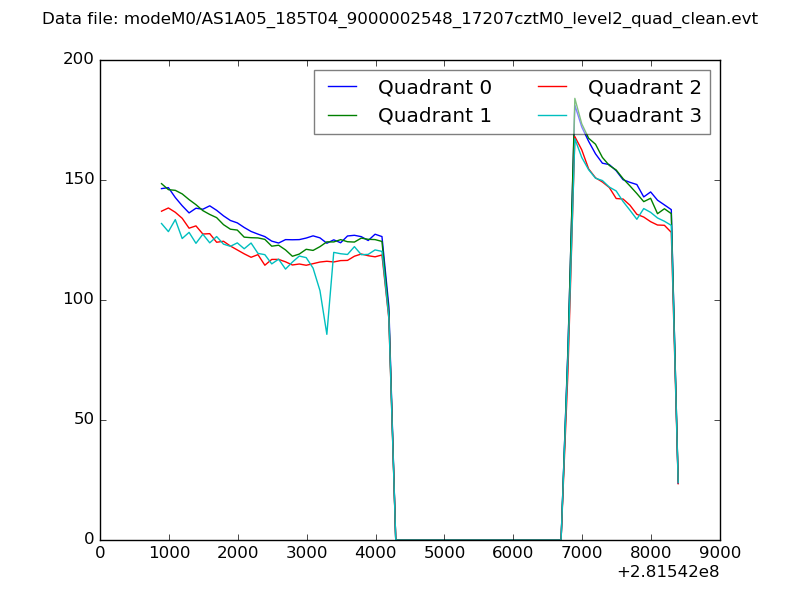 |
|
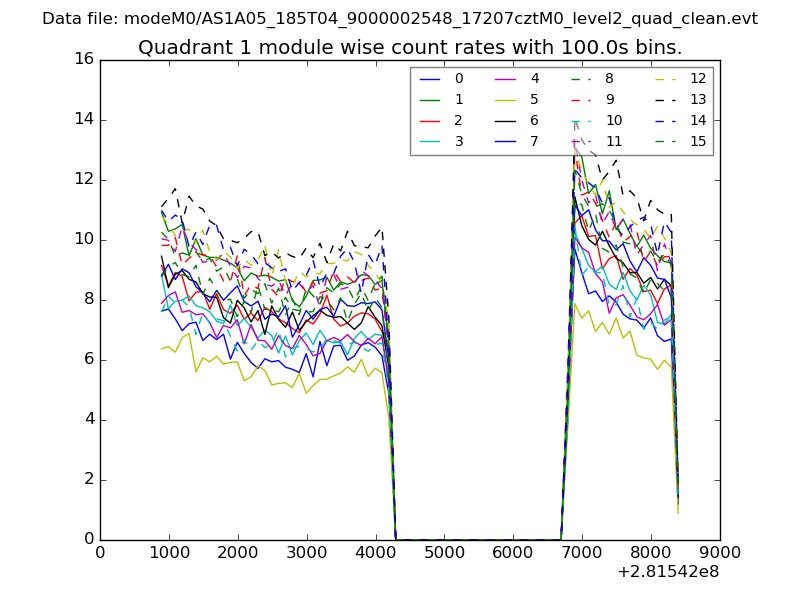
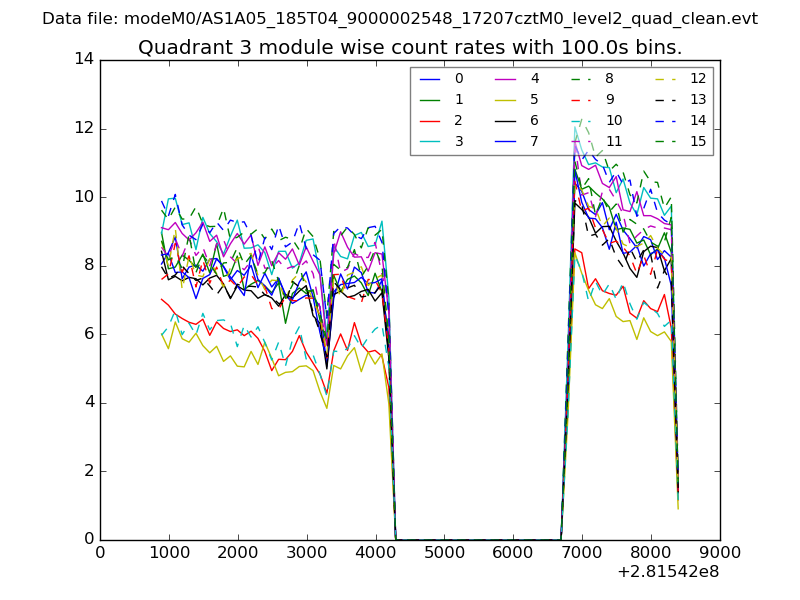
| Module-wise count rates for Quadrant A Data is divided into 100 sec bins |
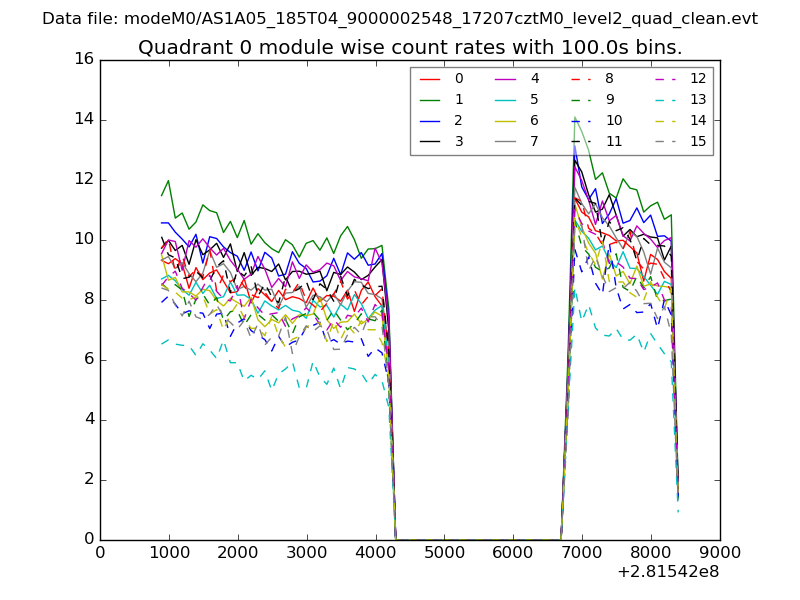 |
 |
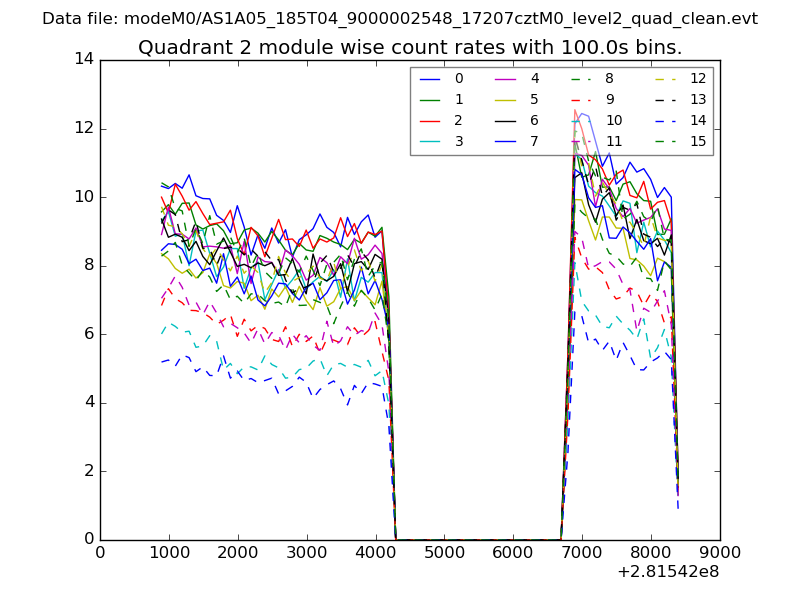
| Module-wise count rates for Quadrant B Data is divided into 100 sec bins |
 |
 |
| Module-wise count rates for Quadrant C Data is divided into 100 sec bins |
 |
 |
| Module-wise count rates for Quadrant D Data is divided into 100 sec bins |
 |
 |
| Parameter | Plot |
|---|---|
| CZT HV Monitor | 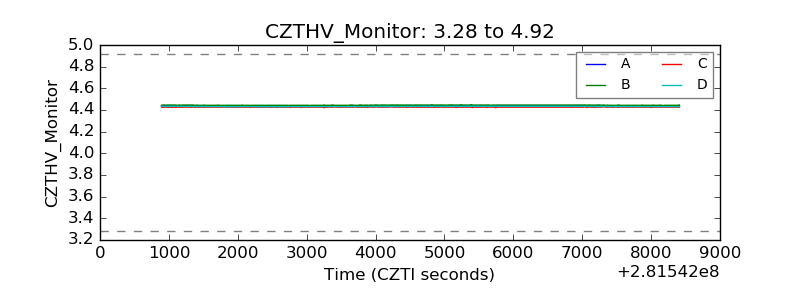 |
| D_VDD | 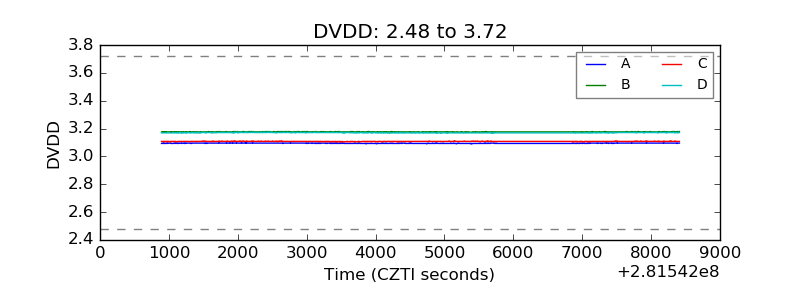 |
| Temperature 1 | 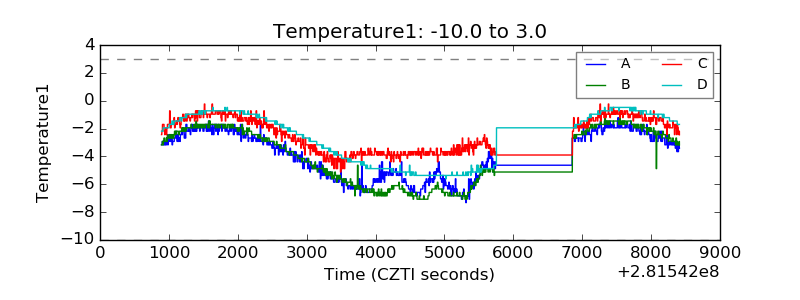 |
| Veto HV Monitor | 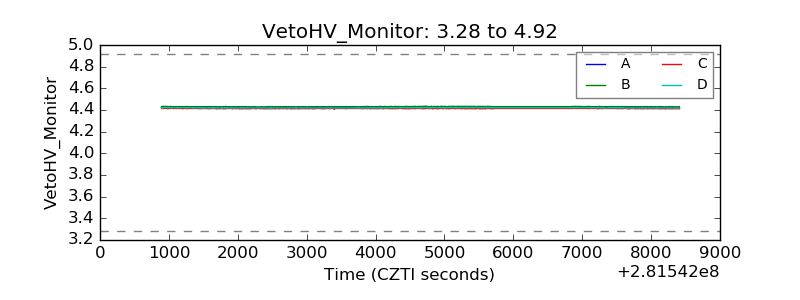 |
| Veto LLD | 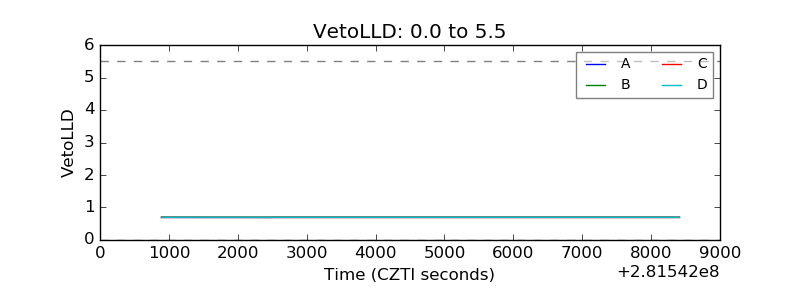 |
| Alpha Counter | 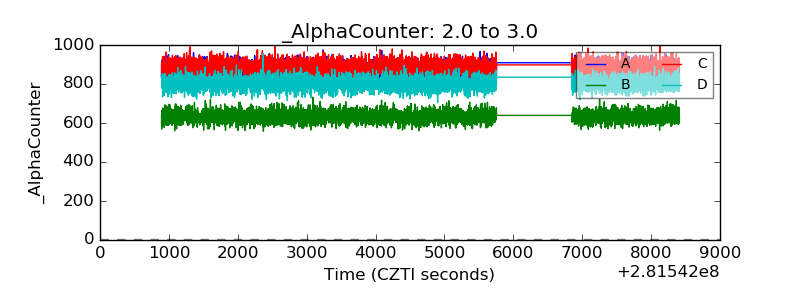 |
| _CPM_Rate | 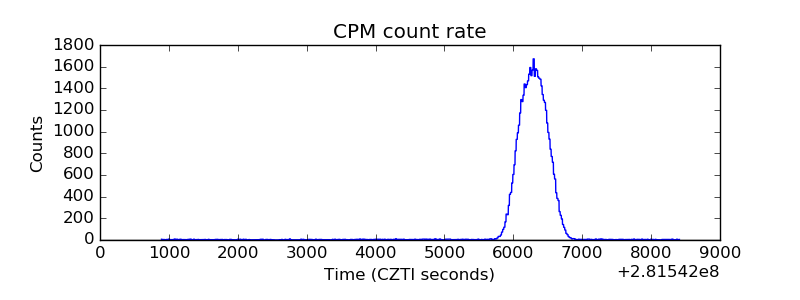 |
| CZT Counter | 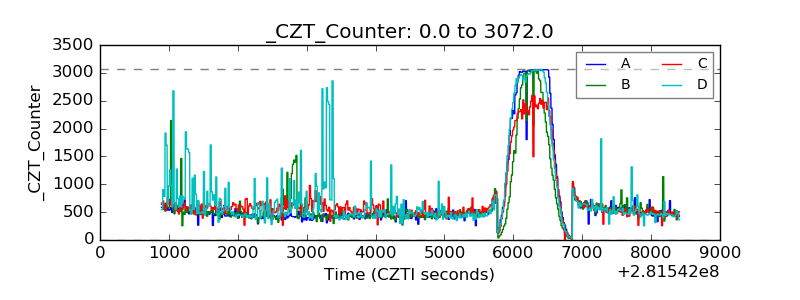 |
| +2.5 Volts monitor |  |
| +5 Volts monitor |  |
| _ROLL_ROT | 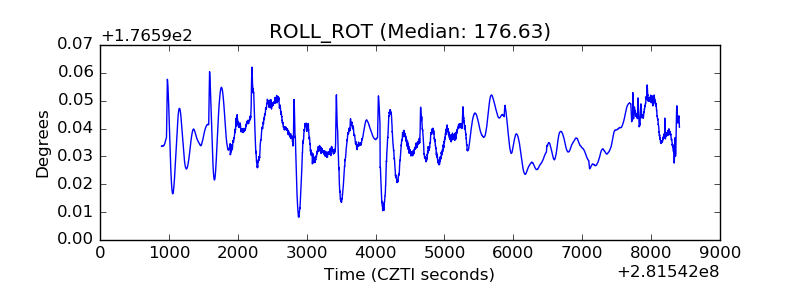 |
| _Roll_DEC | 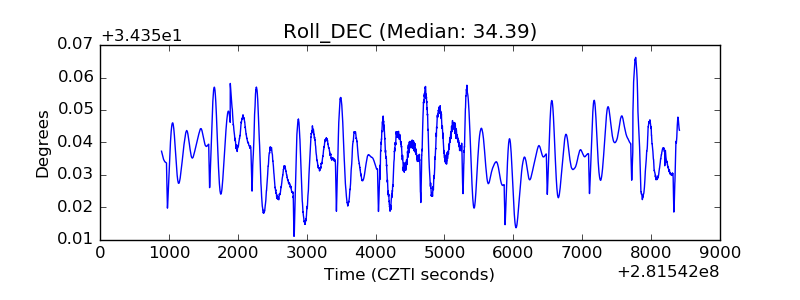 |
| _Roll_RA | 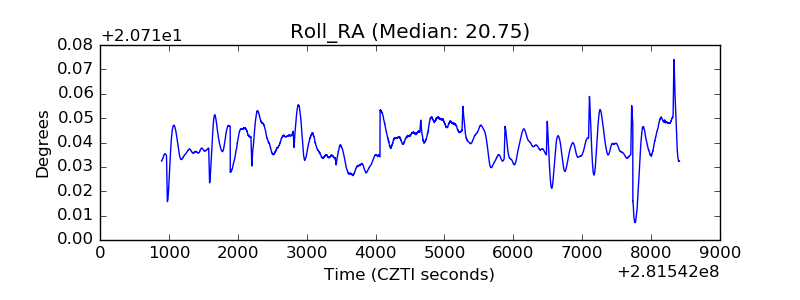 |
| Veto Counter | 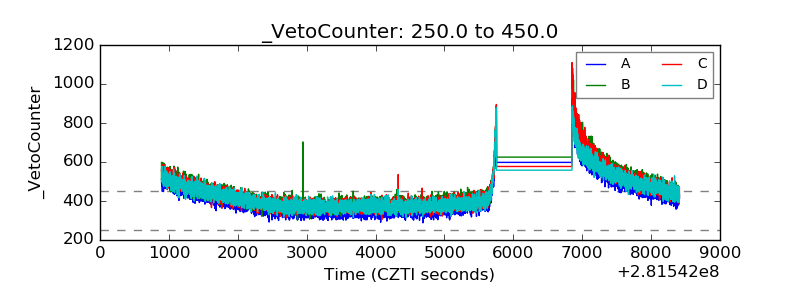 |