| Param | Original file | Final file |
|---|---|---|
| Filename | modeM0/AS1A05_185T04_9000002548_17209cztM0_level2.evt | modeM0/AS1A05_185T04_9000002548_17209cztM0_level2_quad_clean.evt |
| Size (bytes) | 462,692,160 | 96,549,120 |
| Size | 441.3 MB | 92.1 MB |
| Events in quadrant A | 3,167,659 | 642,183 |
| Events in quadrant B | 3,265,642 | 641,744 |
| Events in quadrant C | 3,633,725 | 603,690 |
| Events in quadrant D | 3,515,712 | 594,643 |
| Mode SS | |||
|---|---|---|---|
| Quadrant | BADHDUFLAG | Total packets | Discarded packets |
| A | 0 | 130 | 0 |
| B | 0 | 130 | 0 |
| C | 0 | 130 | 0 |
| D | 0 | 130 | 0 |
| Mode M9 | |||
|---|---|---|---|
| Quadrant | BADHDUFLAG | Total packets | Discarded packets |
| A | 0 | 12 | 0 |
| B | 0 | 12 | 0 |
| C | 0 | 12 | 0 |
| D | 0 | 12 | 0 |
| Mode M0 | |||
|---|---|---|---|
| Quadrant | BADHDUFLAG | Total packets | Discarded packets |
| A | 0 | 13456 | 2 |
| B | 0 | 13730 | 2 |
| C | 0 | 14703 | 2 |
| D | 0 | 14811 | 3 |
| Quadrant | Total seconds | Saturated seconds | Saturation percentage |
|---|---|---|---|
| A | 6324 | 54 | 0.853890% |
| B | 6325 | 52 | 0.822134% |
| C | 6325 | 87 | 1.375494% |
| D | 6324 | 120 | 1.897533% |
Noise dominated data is calculated using 1-second bins in cleaned event files. If a bin has >2000 counts, and if more than 50% of those come from <1% of pixels, then it is considered to be noise-dominated and hence unusable.
| Quadrant | # 1 sec bins | Bins with >0 counts | Bins with >2000 counts | High rate bins dominated by noise | Noise dominated (total time) | Noise dominated (detector-on time) | Marked lightcurve |
|---|---|---|---|---|---|---|---|
| A | 7609 | 6325 | 0 | 0 | 0.00% | 0.00% | 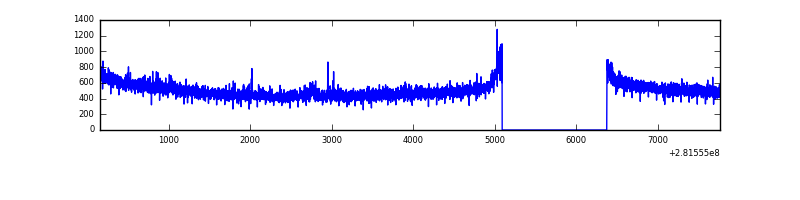 |
| B | 7610 | 6326 | 1 | 1 | 0.01% | 0.02% | 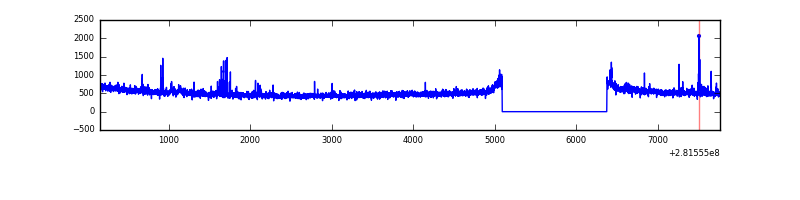 |
| C | 7610 | 6326 | 0 | 0 | 0.00% | 0.00% | 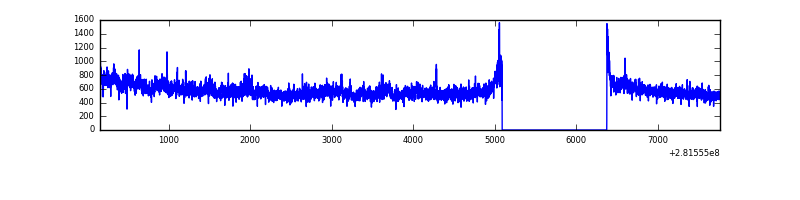 |
| D | 7609 | 6325 | 53 | 53 | 0.70% | 0.84% |  |
Top three noisy pixels from each quadrant. If the there are fewer than three noisy pixels in the level2.evt file, extra rows are filled as -1
| Pixel properties | Quadrant properties | ||||||
|---|---|---|---|---|---|---|---|
| Quadrant | DetID | PixID | Counts | Sigma | Mean | Median | Sigma |
| A | 12 | 189 | 32319 | 192.23 | 816 | 801 | 164.0 |
| A | 0 | 226 | 7308 | 39.69 | 816 | 801 | 164.0 |
| A | 12 | 194 | 6207 | 32.97 | 816 | 801 | 164.0 |
| B | 0 | 197 | 39712 | 255.06 | 814 | 796 | 152.6 |
| B | 12 | 111 | 17153 | 107.2 | 814 | 796 | 152.6 |
| B | 11 | 111 | 14553 | 90.16 | 814 | 796 | 152.6 |
| C | 3 | 233 | 471149 | 2610.63 | 779 | 785 | 180.2 |
| C | 14 | 238 | 121430 | 669.61 | 779 | 785 | 180.2 |
| C | 13 | 61 | 5475 | 26.03 | 779 | 785 | 180.2 |
| D | 5 | 222 | 331104 | 1700.97 | 794 | 771 | 194.2 |
| D | 12 | 233 | 135254 | 692.49 | 794 | 771 | 194.2 |
| D | 2 | 234 | 25933 | 129.57 | 794 | 771 | 194.2 |
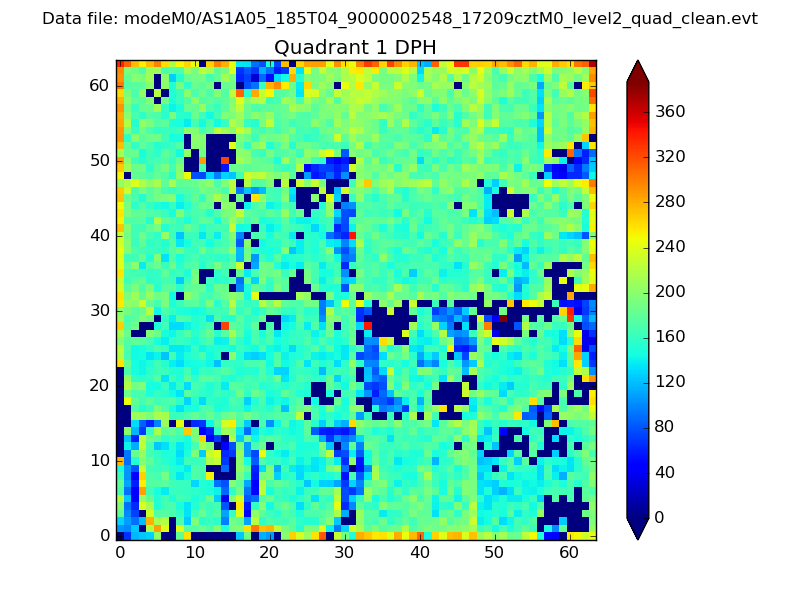
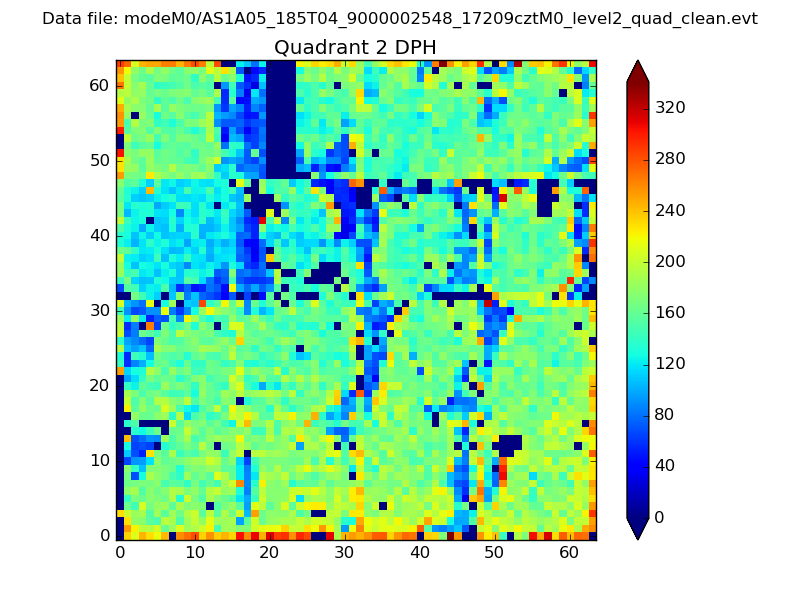
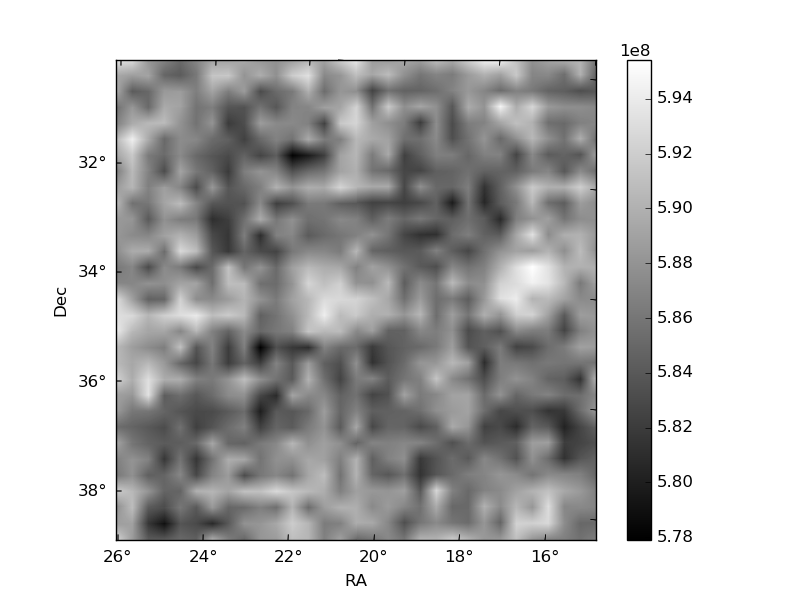
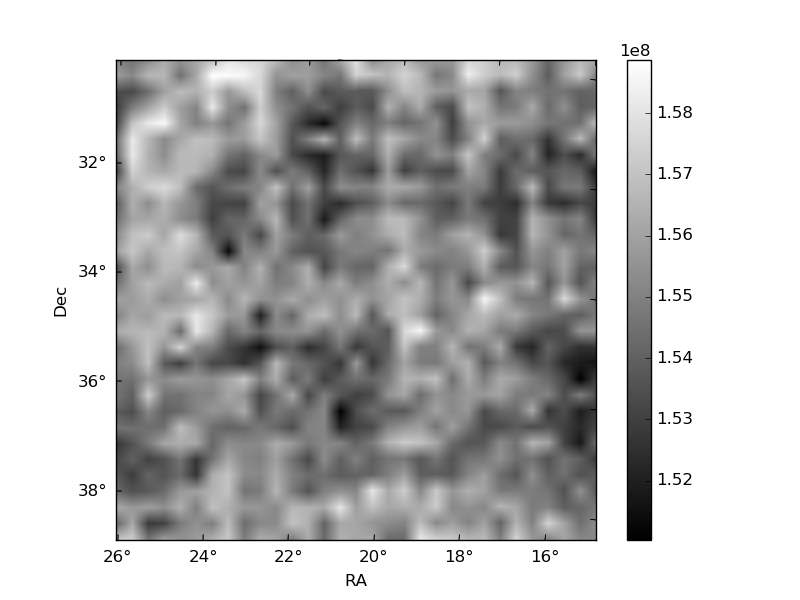
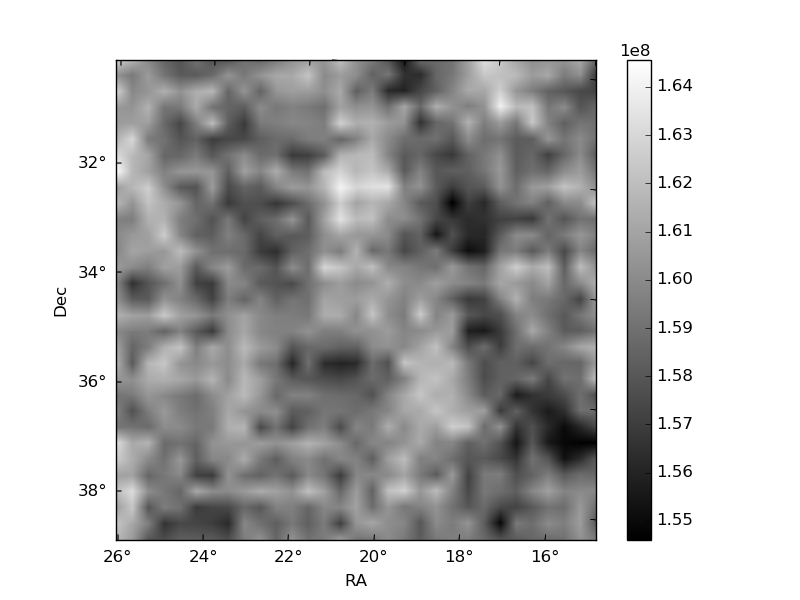
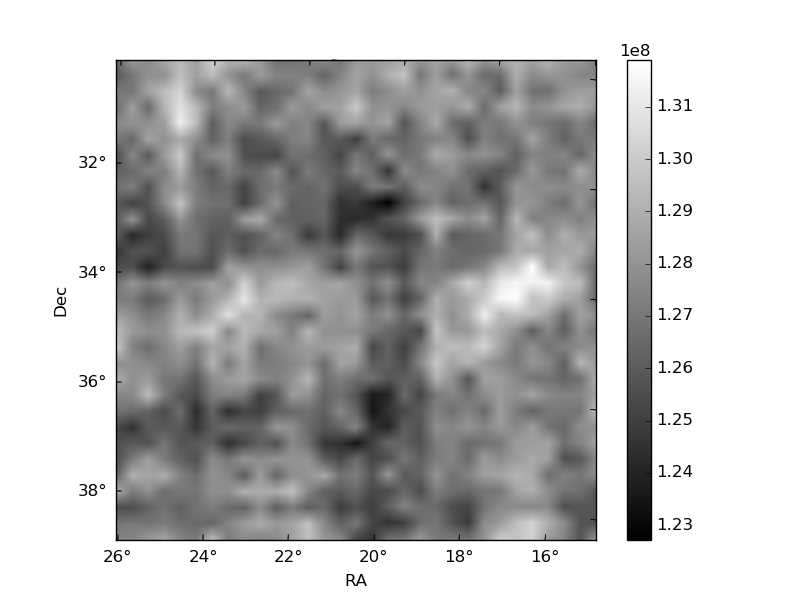
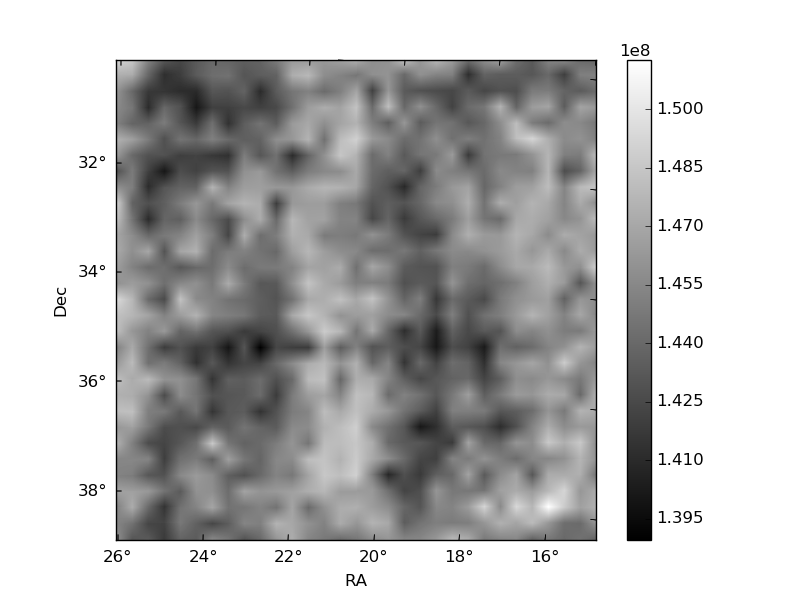
Histogram calculated using DETX and DETY for each event in the final _common_clean file
| Quadrant A | 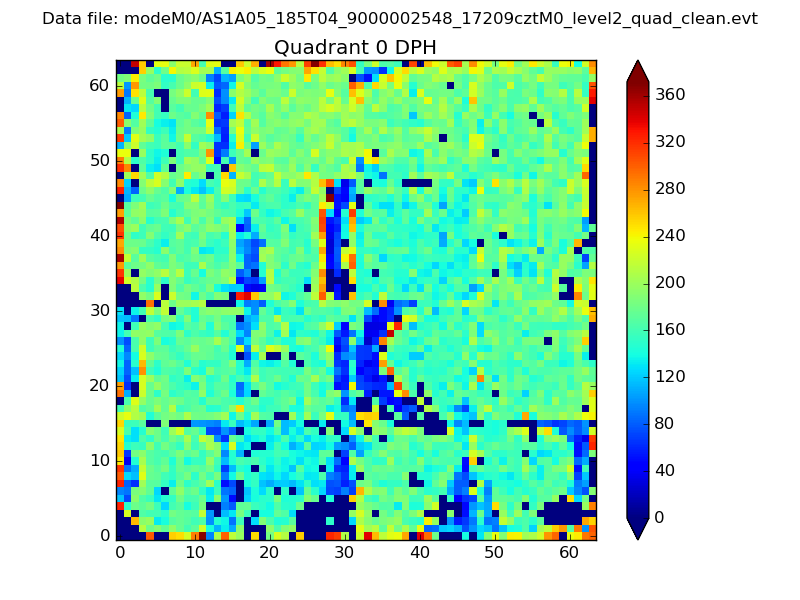 |
 |
Quadrant B |
|---|---|---|---|
| Quadrant D | 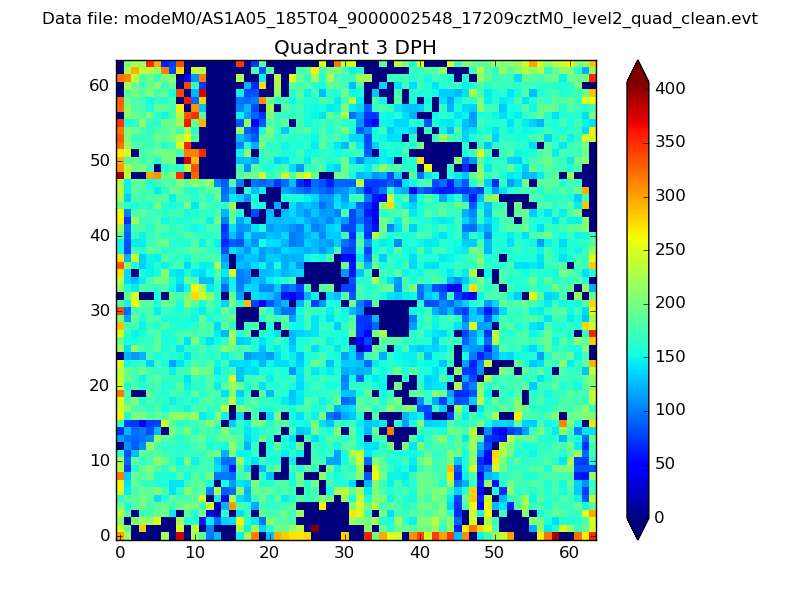 |
 |
Quadrant C |
| Plot type | Count rate plots | Images |
|---|---|---|
| Comparison with Poisson distribution Blue bars denote a histogram of data divided into 1 sec bins. Red curve is a Poisson curve with rate = median count rate of data. |
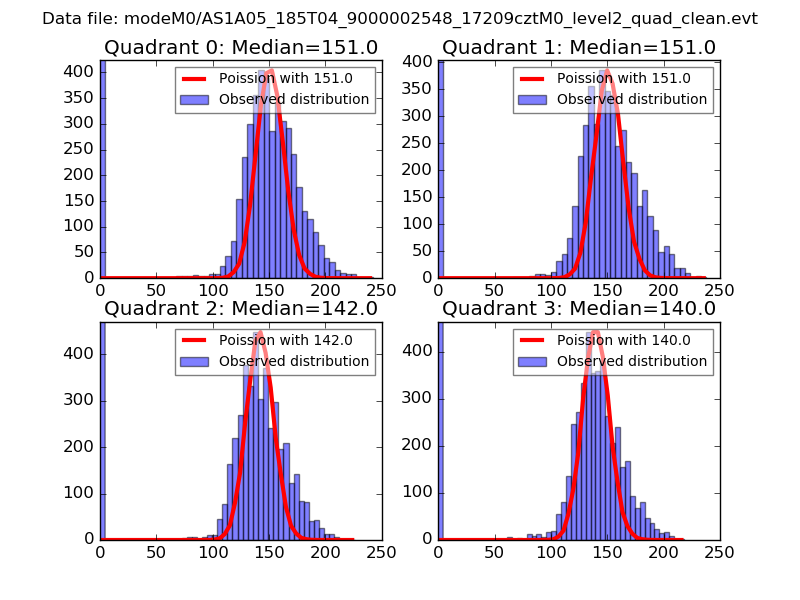 |
 |
| Quadrant-wise count rates Data is divided into 100 sec bins |
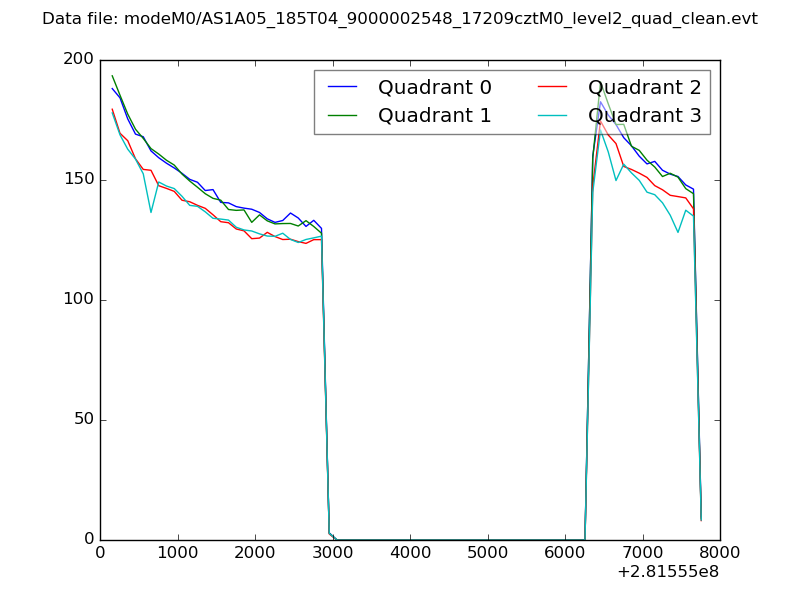 |
|
| Module-wise count rates for Quadrant A Data is divided into 100 sec bins |
 |
 |
| Module-wise count rates for Quadrant B Data is divided into 100 sec bins |
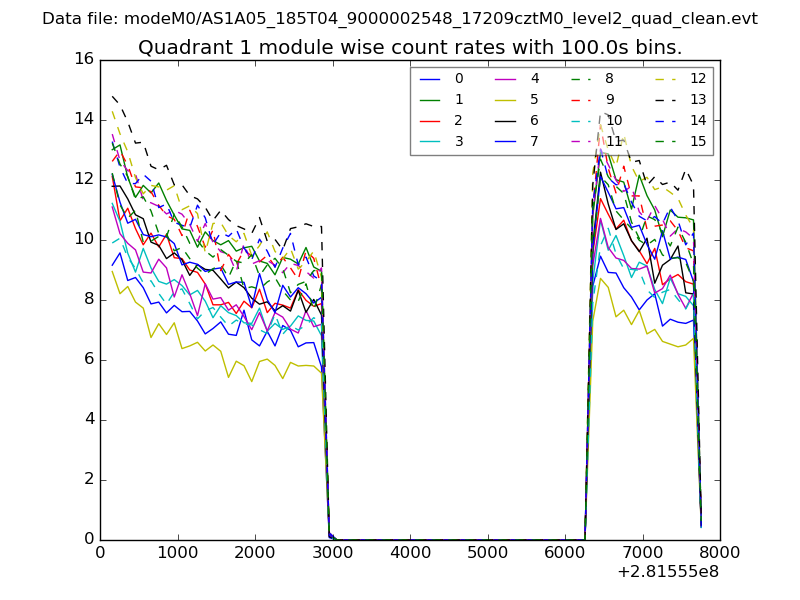 |
 |
| Module-wise count rates for Quadrant C Data is divided into 100 sec bins |
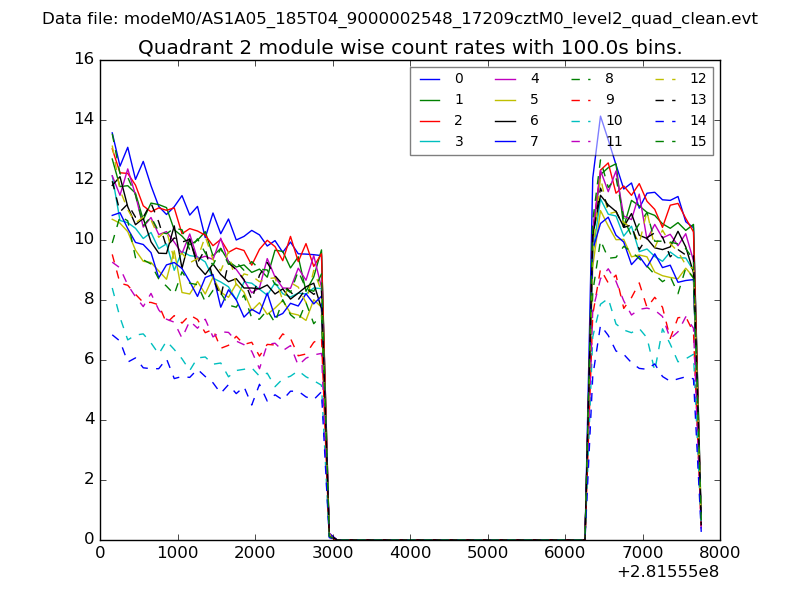 |
 |
| Module-wise count rates for Quadrant D Data is divided into 100 sec bins |
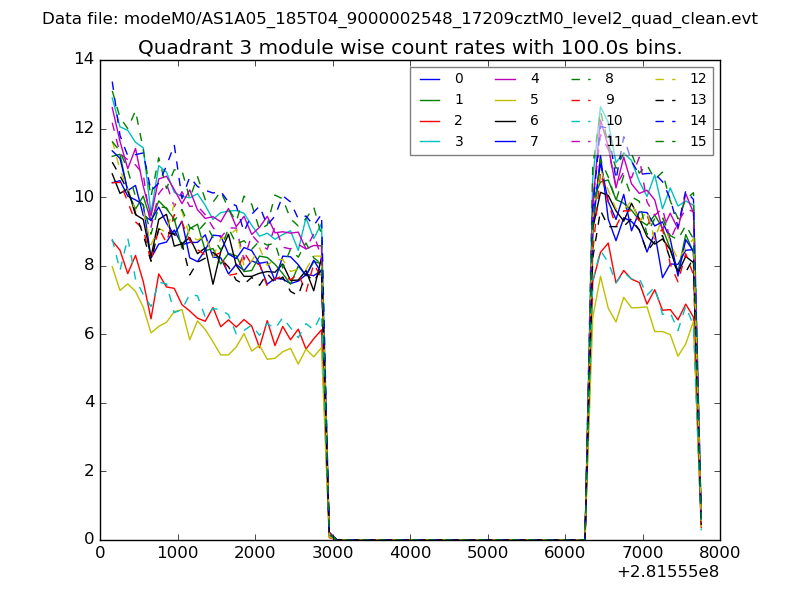 |
 |
| Parameter | Plot |
|---|---|
| CZT HV Monitor | 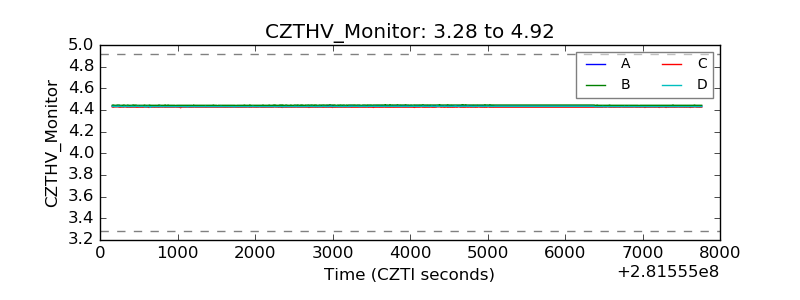 |
| D_VDD | 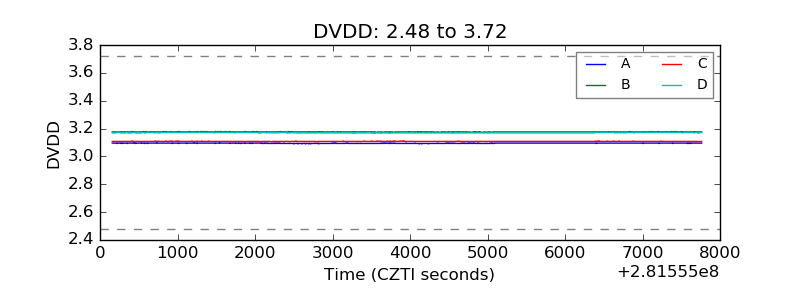 |
| Temperature 1 | 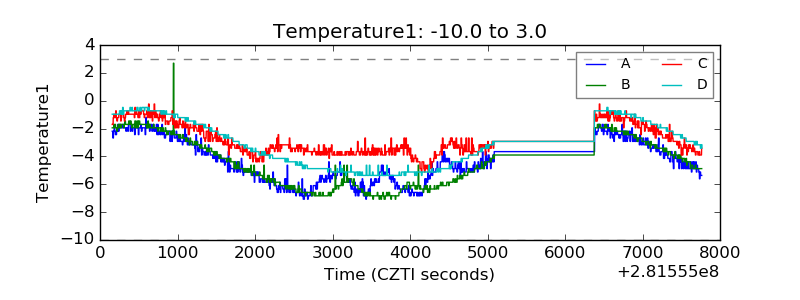 |
| Veto HV Monitor | 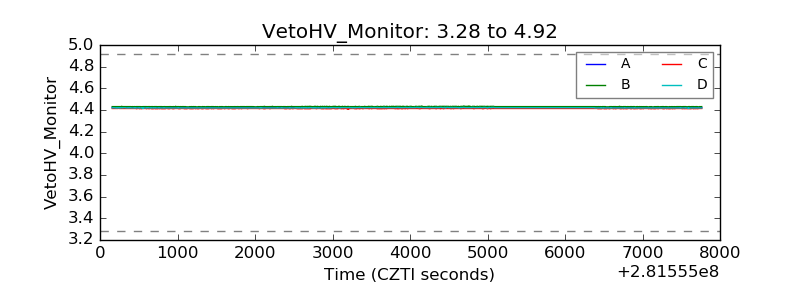 |
| Veto LLD | 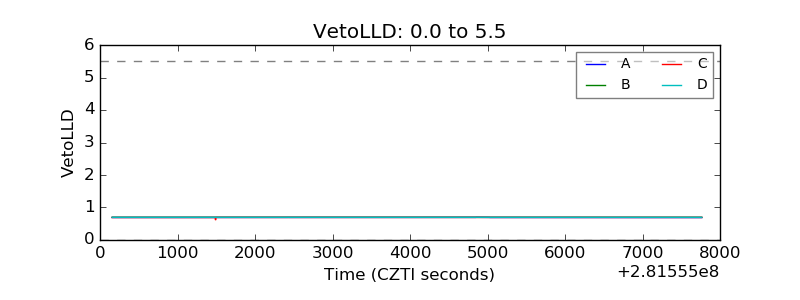 |
| Alpha Counter | 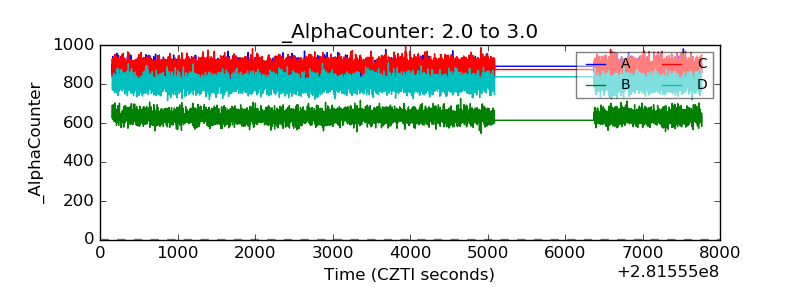 |
| _CPM_Rate | 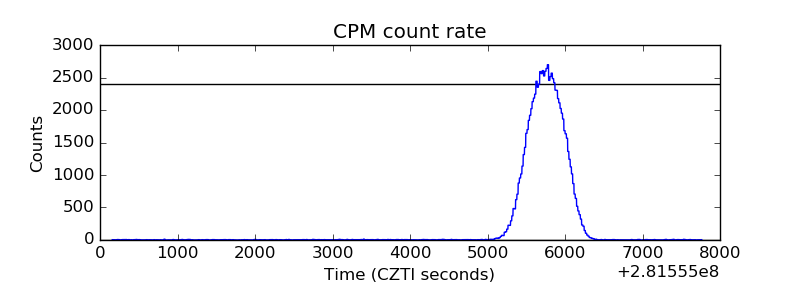 |
| CZT Counter | 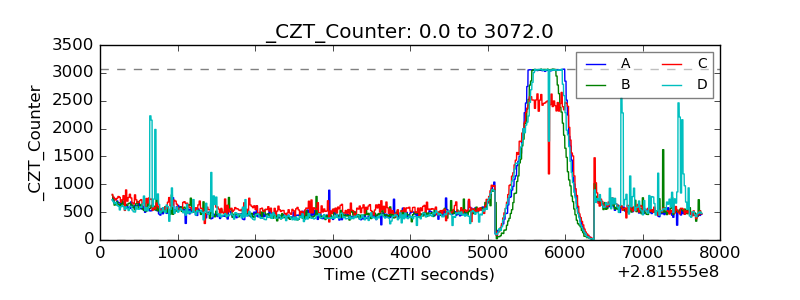 |
| +2.5 Volts monitor |  |
| +5 Volts monitor |  |
| _ROLL_ROT | 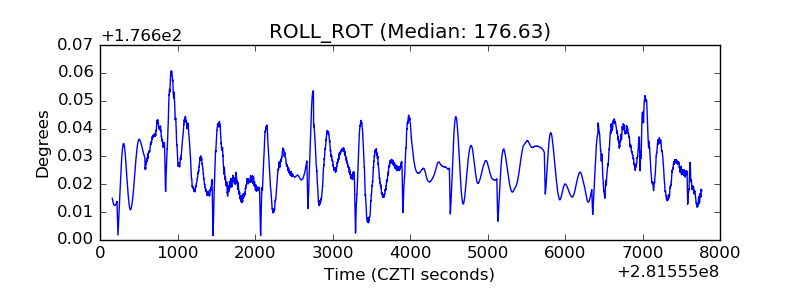 |
| _Roll_DEC | 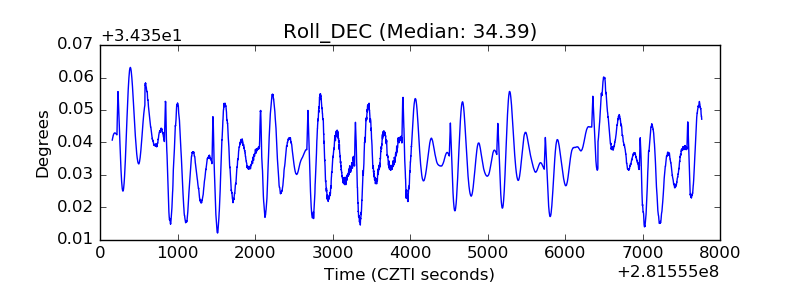 |
| _Roll_RA | 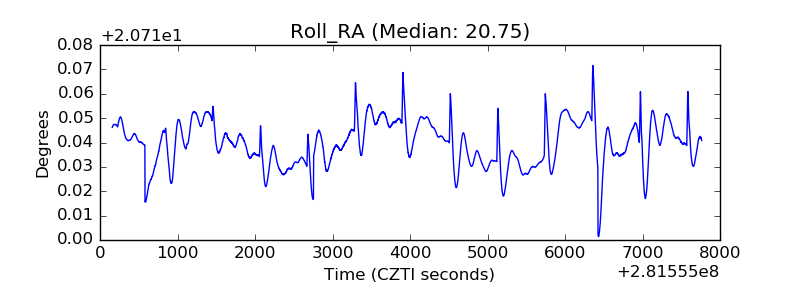 |
| Veto Counter | 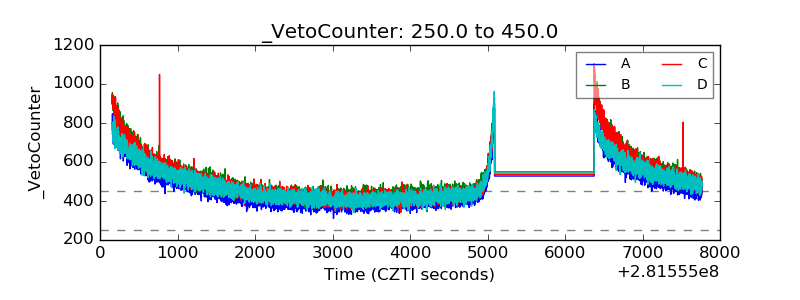 |