| Param | Original file | Final file |
|---|---|---|
| Filename | modeM0/AS1A05_185T04_9000002548_17210cztM0_level2.evt | modeM0/AS1A05_185T04_9000002548_17210cztM0_level2_quad_clean.evt |
| Size (bytes) | 440,184,960 | 92,171,520 |
| Size | 419.8 MB | 87.9 MB |
| Events in quadrant A | 3,023,155 | 608,939 |
| Events in quadrant B | 3,194,201 | 613,506 |
| Events in quadrant C | 3,199,637 | 576,825 |
| Events in quadrant D | 3,498,047 | 564,588 |
| Mode SS | |||
|---|---|---|---|
| Quadrant | BADHDUFLAG | Total packets | Discarded packets |
| A | 0 | 124 | 0 |
| B | 0 | 124 | 0 |
| C | 0 | 124 | 0 |
| D | 0 | 124 | 0 |
| Mode M9 | |||
|---|---|---|---|
| Quadrant | BADHDUFLAG | Total packets | Discarded packets |
| A | 0 | 19 | 0 |
| B | 0 | 20 | 0 |
| C | 0 | 20 | 0 |
| D | 0 | 20 | 0 |
| Mode M0 | |||
|---|---|---|---|
| Quadrant | BADHDUFLAG | Total packets | Discarded packets |
| A | 0 | 12847 | 2 |
| B | 0 | 13369 | 2 |
| C | 0 | 13333 | 2 |
| D | 0 | 14534 | 2 |
| Quadrant | Total seconds | Saturated seconds | Saturation percentage |
|---|---|---|---|
| A | 6125 | 22 | 0.359184% |
| B | 6124 | 38 | 0.620509% |
| C | 6124 | 61 | 0.996081% |
| D | 6124 | 81 | 1.322665% |
Noise dominated data is calculated using 1-second bins in cleaned event files. If a bin has >2000 counts, and if more than 50% of those come from <1% of pixels, then it is considered to be noise-dominated and hence unusable.
| Quadrant | # 1 sec bins | Bins with >0 counts | Bins with >2000 counts | High rate bins dominated by noise | Noise dominated (total time) | Noise dominated (detector-on time) | Marked lightcurve |
|---|---|---|---|---|---|---|---|
| A | 7475 | 6126 | 0 | 0 | 0.00% | 0.00% | 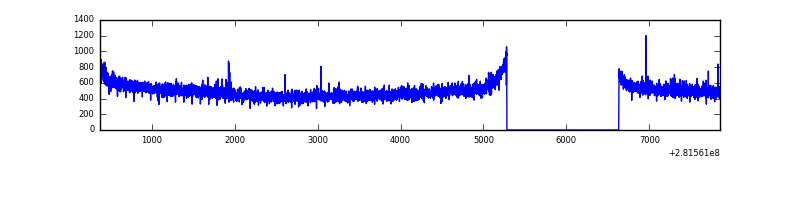 |
| B | 7474 | 6125 | 4 | 4 | 0.05% | 0.07% | 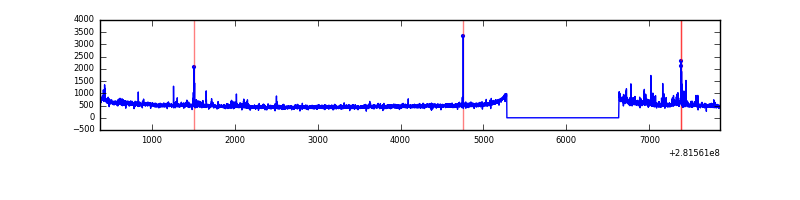 |
| C | 7474 | 6124 | 0 | 0 | 0.00% | 0.00% | 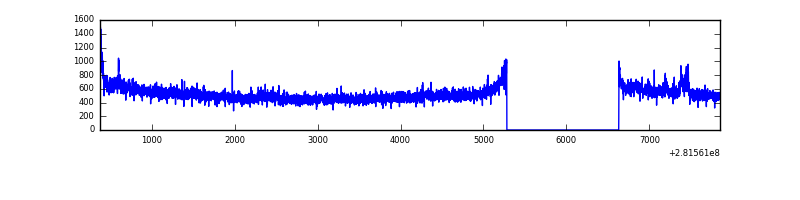 |
| D | 7474 | 6125 | 47 | 47 | 0.63% | 0.77% | 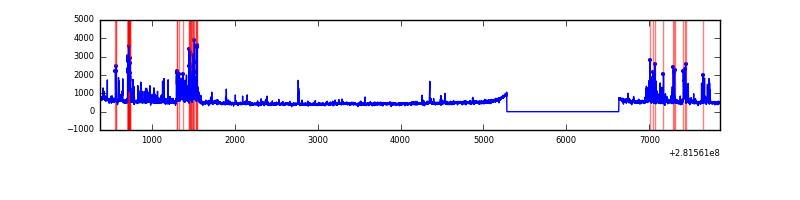 |
Top three noisy pixels from each quadrant. If the there are fewer than three noisy pixels in the level2.evt file, extra rows are filled as -1
| Pixel properties | Quadrant properties | ||||||
|---|---|---|---|---|---|---|---|
| Quadrant | DetID | PixID | Counts | Sigma | Mean | Median | Sigma |
| A | 12 | 189 | 11604 | 68.9 | 783 | 769 | 157.3 |
| A | 0 | 226 | 7071 | 40.07 | 783 | 769 | 157.3 |
| A | 12 | 194 | 5837 | 32.23 | 783 | 769 | 157.3 |
| B | 0 | 197 | 47882 | 321.68 | 784 | 768 | 146.5 |
| B | 6 | 36 | 37023 | 247.53 | 784 | 768 | 146.5 |
| B | 12 | 111 | 16502 | 107.43 | 784 | 768 | 146.5 |
| C | 3 | 233 | 150684 | 865.75 | 751 | 758 | 173.2 |
| C | 14 | 238 | 117233 | 672.59 | 751 | 758 | 173.2 |
| C | 13 | 61 | 5281 | 26.12 | 751 | 758 | 173.2 |
| D | 5 | 222 | 526142 | 2869.9 | 760 | 738 | 183.1 |
| D | 12 | 110 | 46488 | 249.9 | 760 | 738 | 183.1 |
| D | 12 | 233 | 30163 | 160.73 | 760 | 738 | 183.1 |
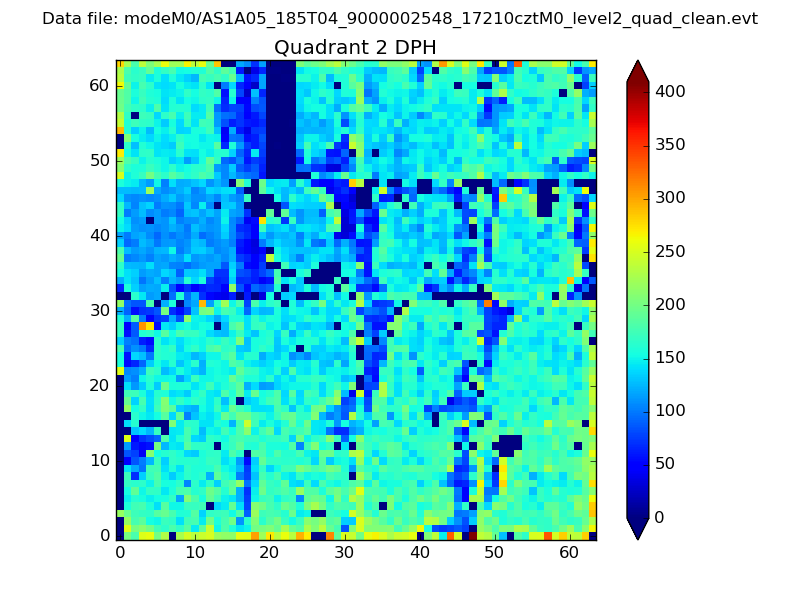
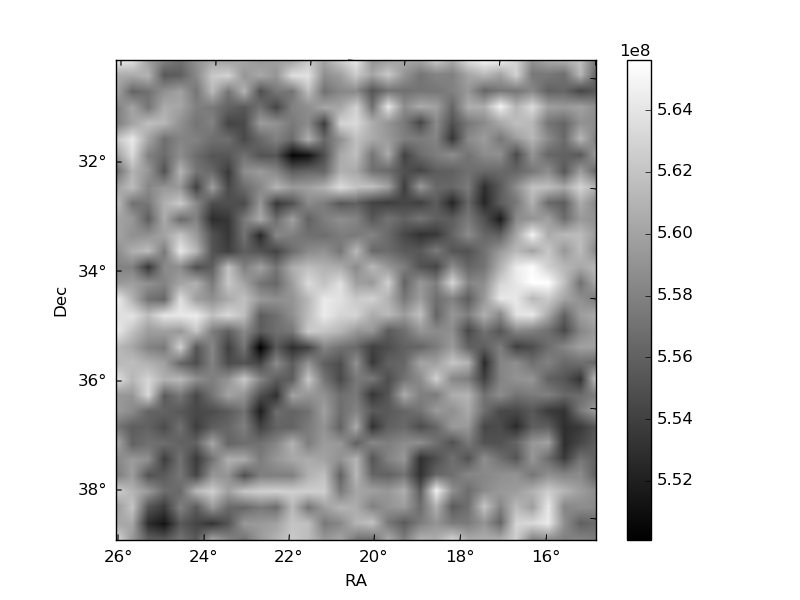
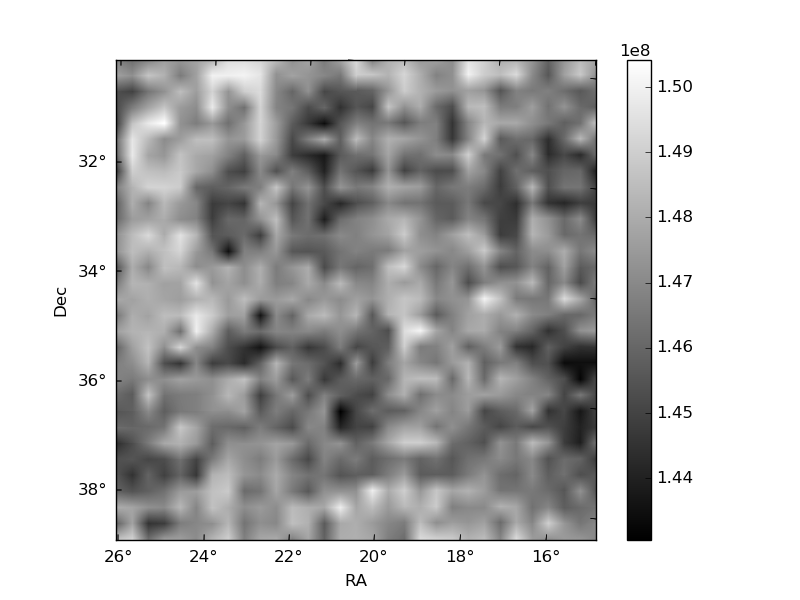
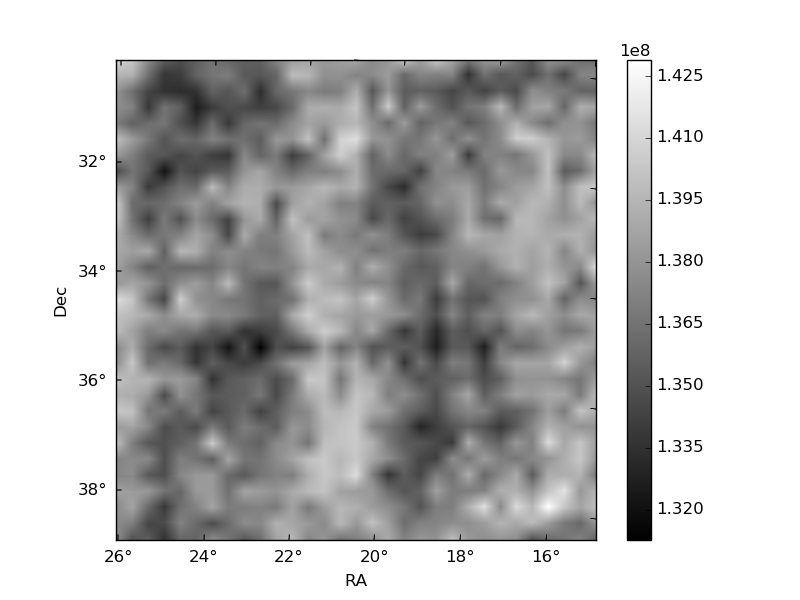
Histogram calculated using DETX and DETY for each event in the final _common_clean file
| Quadrant A | 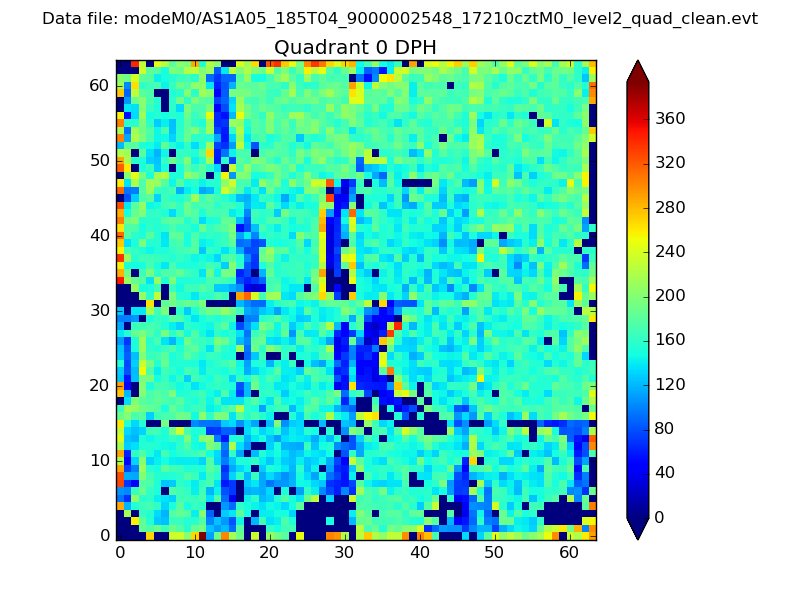 |
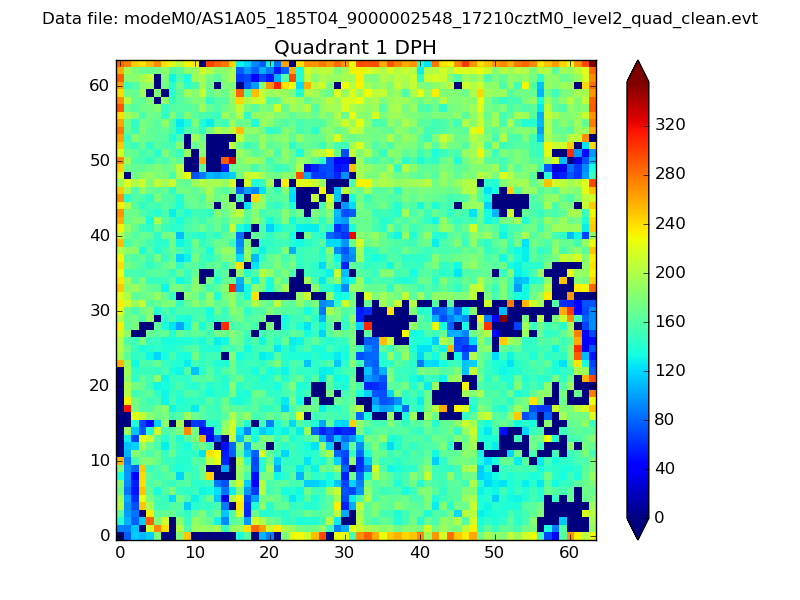 |
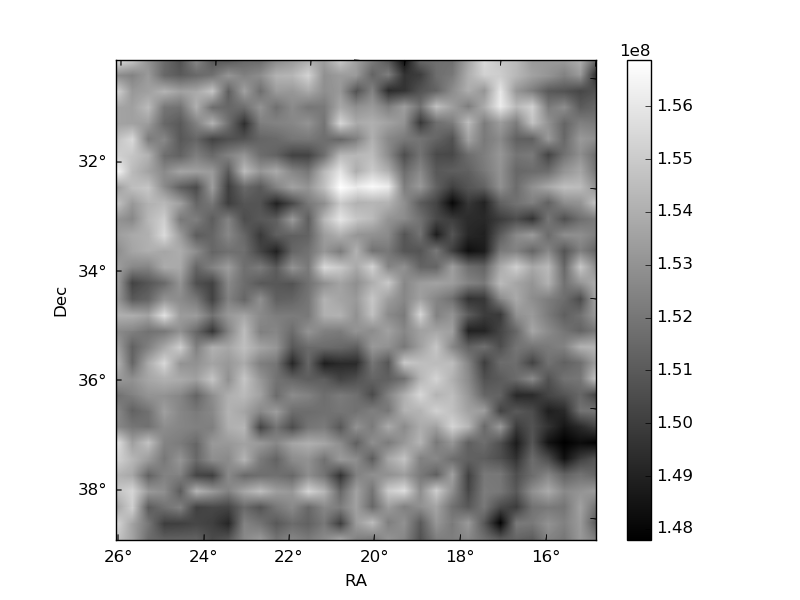
Quadrant B |
|---|---|---|---|
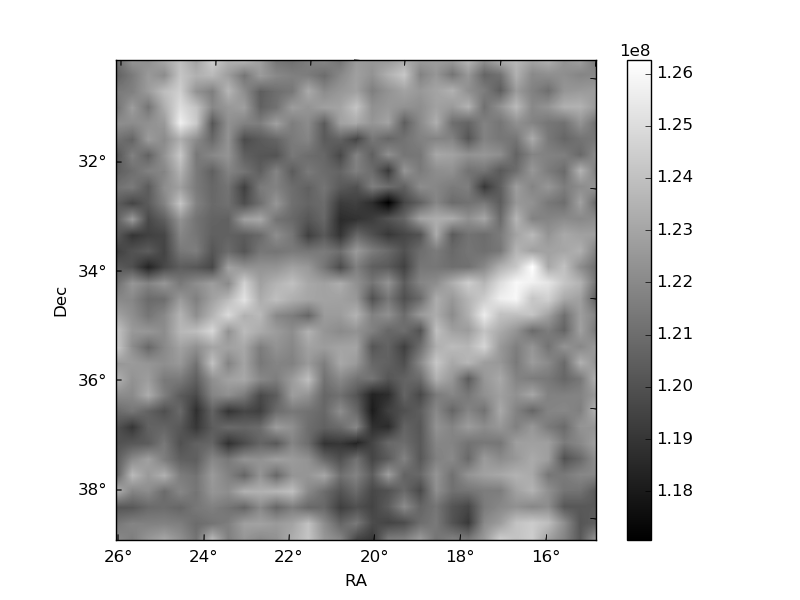
| Quadrant D | 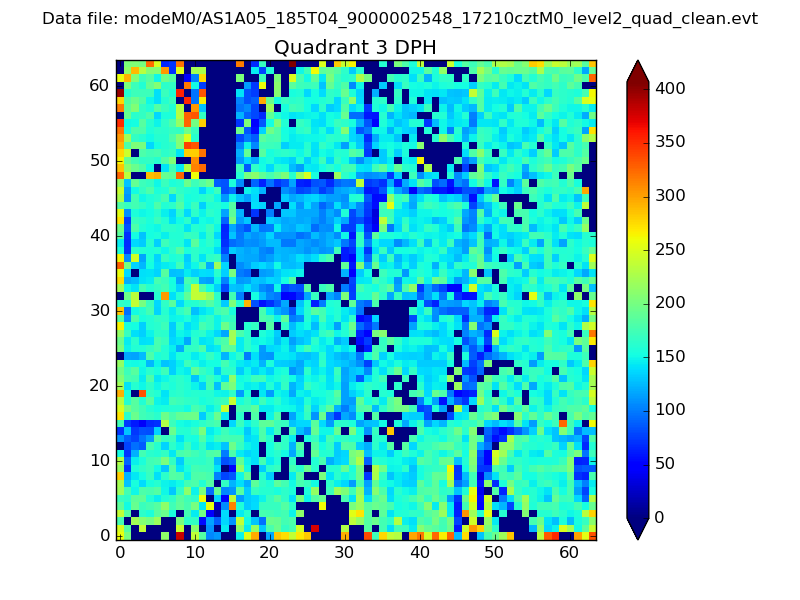 |
 |
Quadrant C |
| Plot type | Count rate plots | Images |
|---|---|---|
| Comparison with Poisson distribution Blue bars denote a histogram of data divided into 1 sec bins. Red curve is a Poisson curve with rate = median count rate of data. |
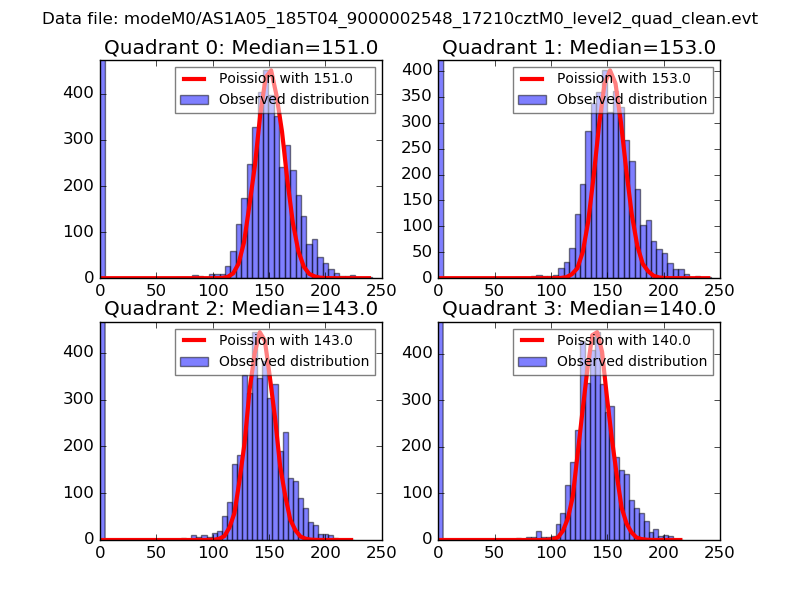 |
 |
| Quadrant-wise count rates Data is divided into 100 sec bins |
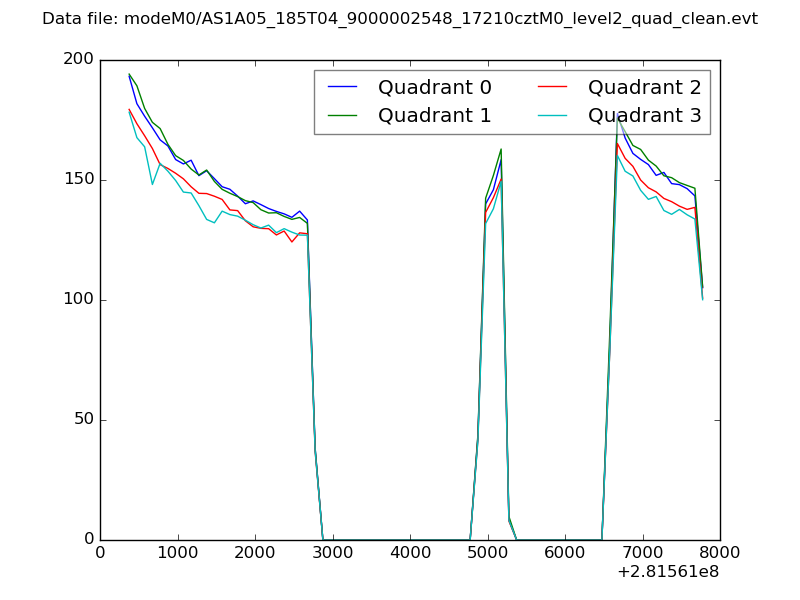 |
|
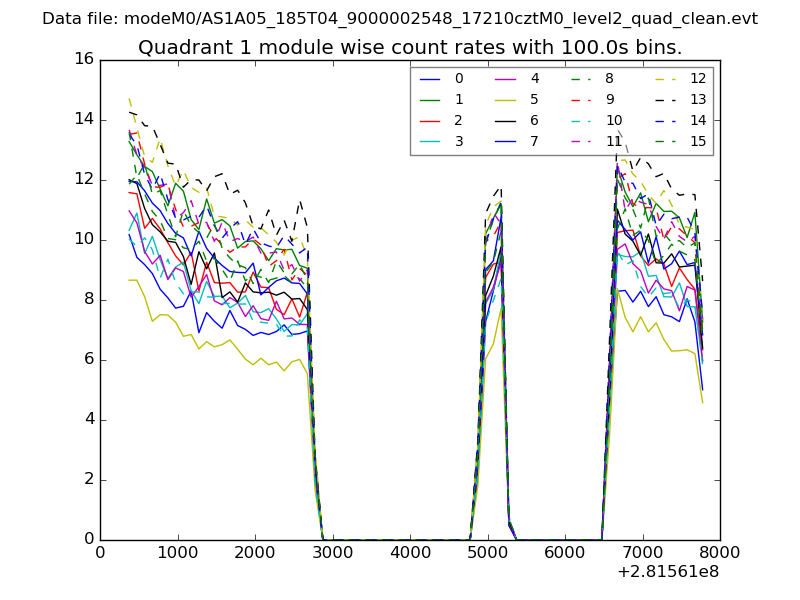
| Module-wise count rates for Quadrant A Data is divided into 100 sec bins |
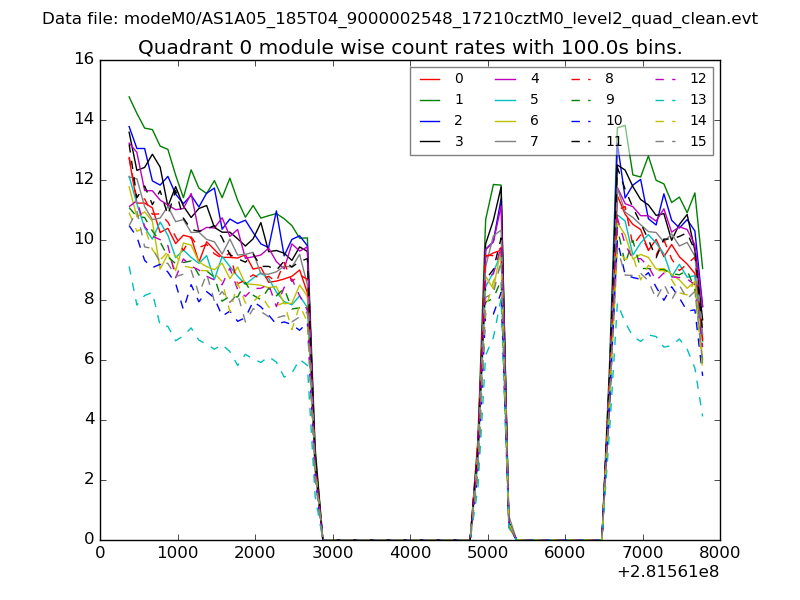 |
 |
| Module-wise count rates for Quadrant B Data is divided into 100 sec bins |
 |
 |
| Module-wise count rates for Quadrant C Data is divided into 100 sec bins |
 |
 |
| Module-wise count rates for Quadrant D Data is divided into 100 sec bins |
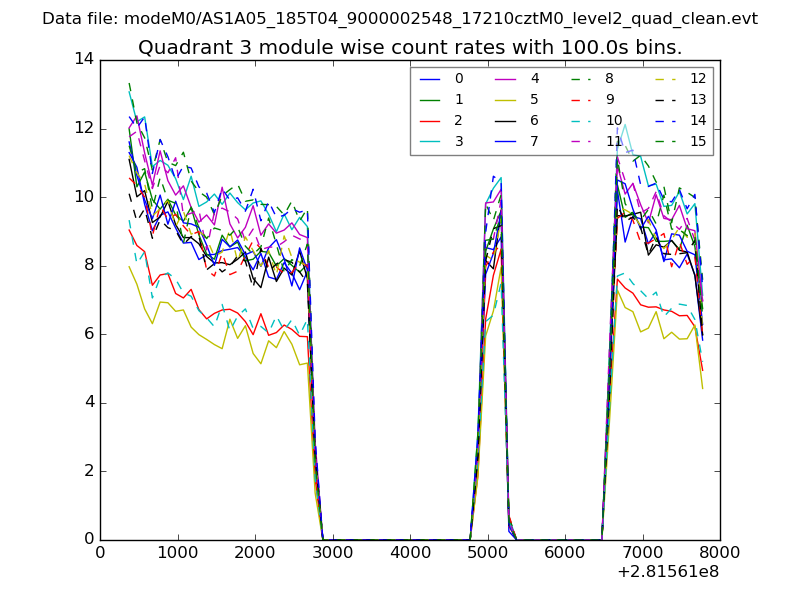 |
 |
| Parameter | Plot |
|---|---|
| CZT HV Monitor | 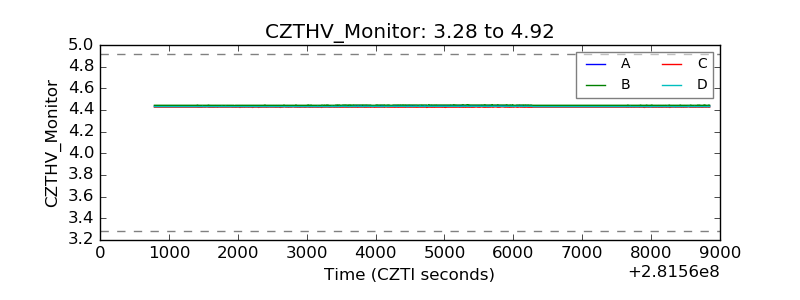 |
| D_VDD | 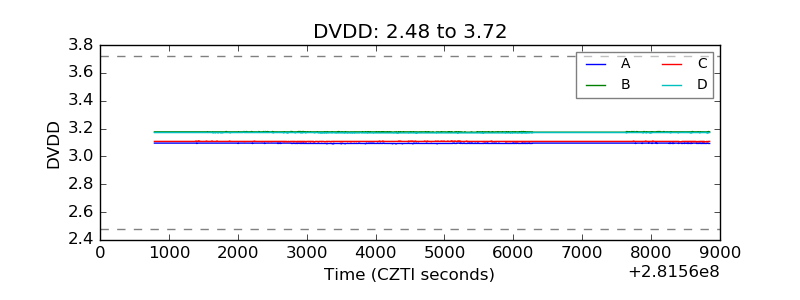 |
| Temperature 1 | 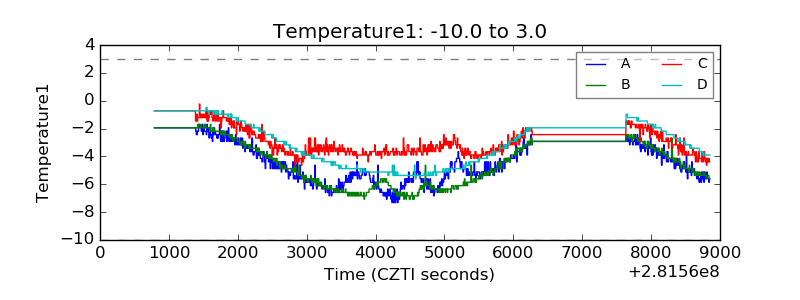 |
| Veto HV Monitor | 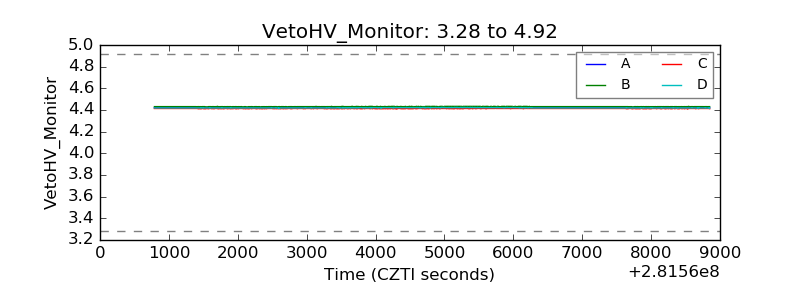 |
| Veto LLD | 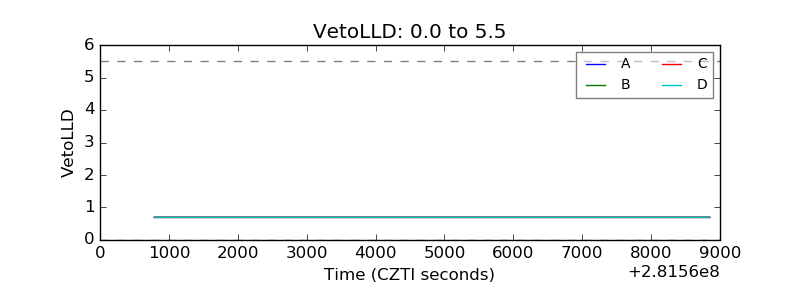 |
| Alpha Counter |  |
| _CPM_Rate | 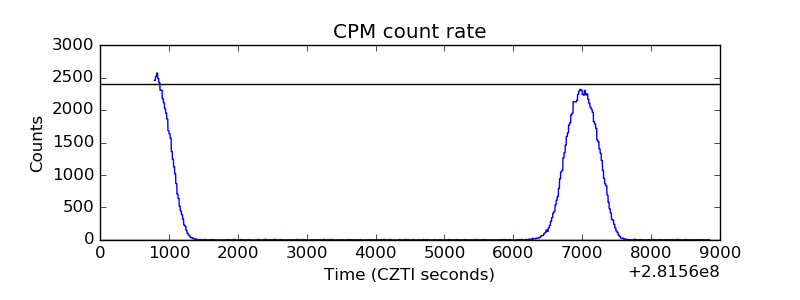 |
| CZT Counter | 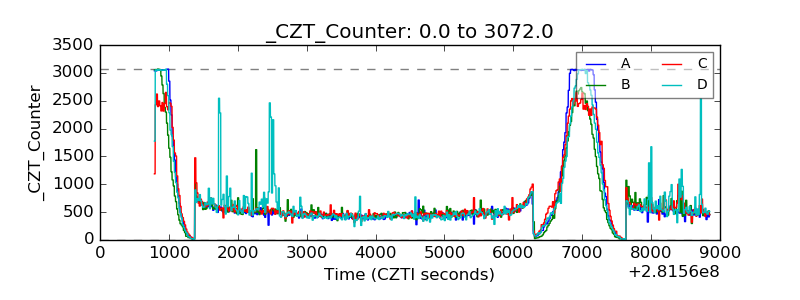 |
| +2.5 Volts monitor |  |
| +5 Volts monitor |  |
| _ROLL_ROT | 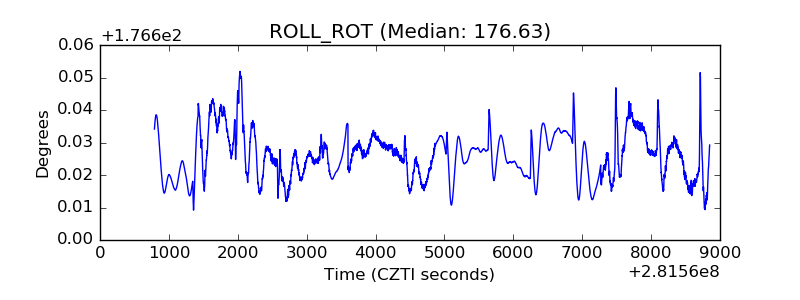 |
| _Roll_DEC | 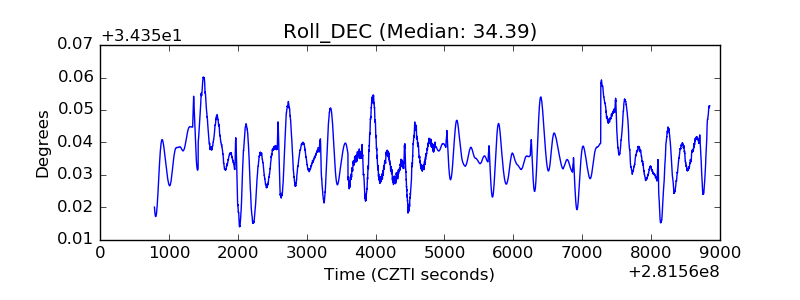 |
| _Roll_RA | 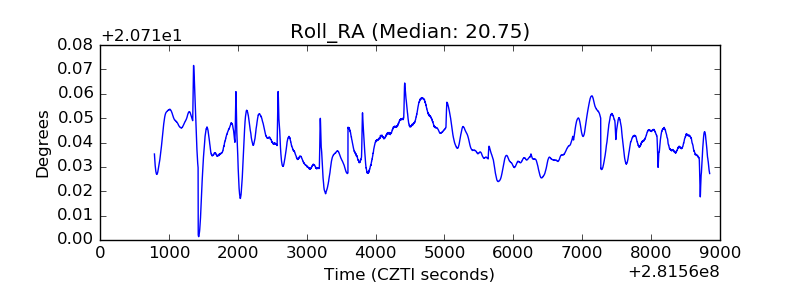 |
| Veto Counter | 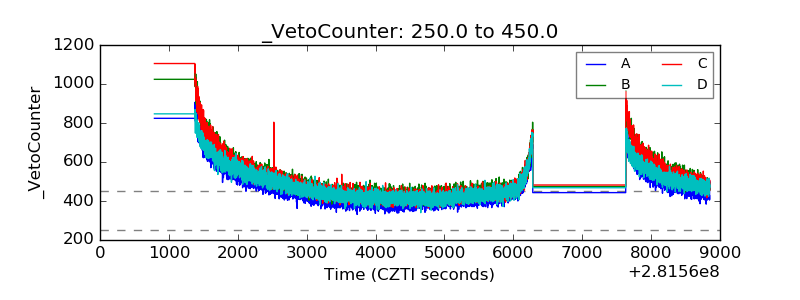 |